Immigrants from Albania vs Immigrants from St. Vincent and the Grenadines In Labor Force | Age 30-34
COMPARE
Immigrants from Albania
Immigrants from St. Vincent and the Grenadines
In Labor Force | Age 30-34
In Labor Force | Age 30-34 Comparison
Immigrants from Albania
Immigrants from St. Vincent and the Grenadines
86.1%
IN LABOR FORCE | AGE 30-34
100.0/ 100
METRIC RATING
15th/ 347
METRIC RANK
83.9%
IN LABOR FORCE | AGE 30-34
0.5/ 100
METRIC RATING
254th/ 347
METRIC RANK
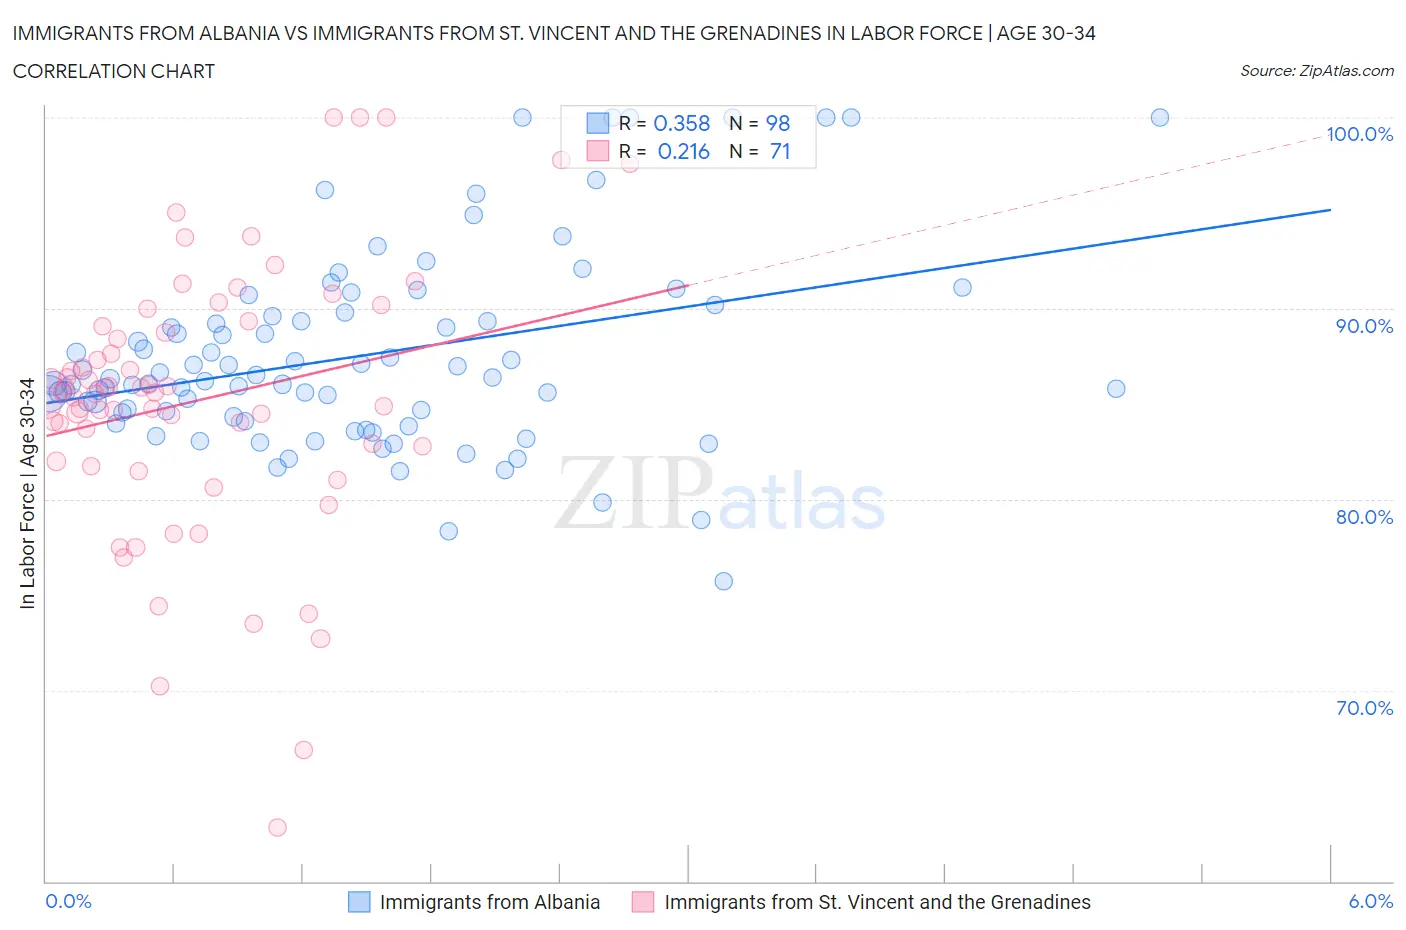
Immigrants from Albania vs Immigrants from St. Vincent and the Grenadines In Labor Force | Age 30-34 Correlation Chart
The statistical analysis conducted on geographies consisting of 119,375,013 people shows a mild positive correlation between the proportion of Immigrants from Albania and labor force participation rate among population between the ages 30 and 34 in the United States with a correlation coefficient (R) of 0.358 and weighted average of 86.1%. Similarly, the statistical analysis conducted on geographies consisting of 56,189,108 people shows a weak positive correlation between the proportion of Immigrants from St. Vincent and the Grenadines and labor force participation rate among population between the ages 30 and 34 in the United States with a correlation coefficient (R) of 0.216 and weighted average of 83.9%, a difference of 2.6%.
In Labor Force | Age 30-34 Correlation Summary
| Measurement | Immigrants from Albania | Immigrants from St. Vincent and the Grenadines |
| Minimum | 75.7% | 62.8% |
| Maximum | 100.0% | 100.0% |
| Range | 24.3% | 37.2% |
| Mean | 87.5% | 85.2% |
| Median | 86.2% | 85.6% |
| Interquartile 25% (IQ1) | 84.3% | 82.0% |
| Interquartile 75% (IQ3) | 89.6% | 89.1% |
| Interquartile Range (IQR) | 5.3% | 7.1% |
| Standard Deviation (Sample) | 5.1% | 7.1% |
| Standard Deviation (Population) | 5.1% | 7.1% |
Similar Demographics by In Labor Force | Age 30-34
Demographics Similar to Immigrants from Albania by In Labor Force | Age 30-34
In terms of in labor force | age 30-34, the demographic groups most similar to Immigrants from Albania are Immigrants from Cabo Verde (86.1%, a difference of 0.010%), Bolivian (86.1%, a difference of 0.030%), Immigrants from Croatia (86.1%, a difference of 0.030%), Latvian (86.0%, a difference of 0.030%), and Immigrants from Cameroon (86.0%, a difference of 0.040%).
| Demographics | Rating | Rank | In Labor Force | Age 30-34 |
| Cambodians | 100.0 /100 | #8 | Exceptional 86.2% |
| Immigrants | Somalia | 100.0 /100 | #9 | Exceptional 86.2% |
| Immigrants | Serbia | 100.0 /100 | #10 | Exceptional 86.2% |
| Carpatho Rusyns | 100.0 /100 | #11 | Exceptional 86.2% |
| Bolivians | 100.0 /100 | #12 | Exceptional 86.1% |
| Immigrants | Croatia | 100.0 /100 | #13 | Exceptional 86.1% |
| Immigrants | Cabo Verde | 100.0 /100 | #14 | Exceptional 86.1% |
| Immigrants | Albania | 100.0 /100 | #15 | Exceptional 86.1% |
| Latvians | 100.0 /100 | #16 | Exceptional 86.0% |
| Immigrants | Cameroon | 100.0 /100 | #17 | Exceptional 86.0% |
| Immigrants | Sierra Leone | 100.0 /100 | #18 | Exceptional 86.0% |
| Sierra Leoneans | 100.0 /100 | #19 | Exceptional 86.0% |
| Bulgarians | 100.0 /100 | #20 | Exceptional 86.0% |
| Immigrants | Bulgaria | 100.0 /100 | #21 | Exceptional 86.0% |
| Bermudans | 100.0 /100 | #22 | Exceptional 85.9% |
Demographics Similar to Immigrants from St. Vincent and the Grenadines by In Labor Force | Age 30-34
In terms of in labor force | age 30-34, the demographic groups most similar to Immigrants from St. Vincent and the Grenadines are Bahamian (83.9%, a difference of 0.020%), Immigrants from Nicaragua (83.9%, a difference of 0.020%), White/Caucasian (83.9%, a difference of 0.020%), Nicaraguan (83.9%, a difference of 0.030%), and Immigrants from Iraq (83.9%, a difference of 0.040%).
| Demographics | Rating | Rank | In Labor Force | Age 30-34 |
| British West Indians | 0.8 /100 | #247 | Tragic 84.0% |
| Portuguese | 0.8 /100 | #248 | Tragic 84.0% |
| Immigrants | Dominica | 0.7 /100 | #249 | Tragic 84.0% |
| Immigrants | Iraq | 0.7 /100 | #250 | Tragic 83.9% |
| Nicaraguans | 0.6 /100 | #251 | Tragic 83.9% |
| Bahamians | 0.6 /100 | #252 | Tragic 83.9% |
| Immigrants | Nicaragua | 0.6 /100 | #253 | Tragic 83.9% |
| Immigrants | St. Vincent and the Grenadines | 0.5 /100 | #254 | Tragic 83.9% |
| Whites/Caucasians | 0.5 /100 | #255 | Tragic 83.9% |
| Immigrants | Lebanon | 0.4 /100 | #256 | Tragic 83.9% |
| Iraqis | 0.3 /100 | #257 | Tragic 83.8% |
| Hondurans | 0.3 /100 | #258 | Tragic 83.8% |
| Scotch-Irish | 0.3 /100 | #259 | Tragic 83.8% |
| Immigrants | Dominican Republic | 0.3 /100 | #260 | Tragic 83.8% |
| Guyanese | 0.3 /100 | #261 | Tragic 83.8% |