Immigrants from Albania vs Immigrants from Pakistan In Labor Force | Age 16-19

COMPARE

Immigrants from Albania
Race
Ancestry
AfghanAfricanAlaska NativeAlaskan AthabascanAlbanianAleutAlsatianAmericanApacheArabArapahoArgentineanArmenianAssyrian/Chaldean/SyriacAustralianAustrianBahamianBangladeshiBarbadianBasqueBelgianBelizeanBermudanBhutaneseBlackfeetBolivianBrazilianBritishBritish West IndianBulgarianBurmeseCajunCambodianCanadianCape VerdeanCarpatho RusynCelticCentral AmericanCentral American IndianCherokeeCheyenneChickasawChileanChineseChippewaChoctawColombianColvilleComancheCosta RicanCreeCreekCroatianCrowCubanCypriotCzechCzechoslovakianDanishDelawareDominicanDutchDutch West IndianEastern EuropeanEcuadorianEgyptianEnglishEstonianEthiopianEuropeanFijianFilipinoFinnishFrenchFrench American IndianFrench CanadianGermanGerman RussianGhanaianGreekGuamanian/ChamorroGuatemalanGuyaneseHaitianHmongHonduranHopiHoumaHungarianIcelanderIndian (Asian)IndonesianInupiatIranianIraqiIrishIroquoisIsraeliItalianJamaicanJapaneseJordanianKenyanKiowaKoreanLaotianLatvianLebaneseLiberianLithuanianLumbeeLuxembourgerMacedonianMalaysianMalteseMarshalleseMenomineeMexicanMexican American IndianMongolianMoroccanNative HawaiianNavajoNepaleseNew ZealanderNicaraguanNigerianNorthern EuropeanNorwegianOkinawanOsageOttawaPaiutePakistaniPalestinianPanamanianParaguayanPennsylvania GermanPeruvianPimaPolishPortuguesePotawatomiPuebloPuerto RicanPuget Sound SalishRomanianRussianSalvadoranSamoanScandinavianScotch-IrishScottishSeminoleSenegaleseSerbianShoshoneSierra LeoneanSiouxSlavicSlovakSloveneSomaliSouth AfricanSouth AmericanSouth American IndianSoviet UnionSpaniardSpanishSpanish AmericanSpanish American IndianSri LankanSubsaharan AfricanSudaneseSwedishSwissSyrianTaiwaneseThaiTlingit-HaidaTohono O'OdhamTonganTrinidadian and TobagonianTsimshianTurkishU.S. Virgin IslanderUgandanUkrainianUruguayanUteVenezuelanVietnameseWelshWest IndianYakamaYaquiYugoslavianYumanYup'ikZimbabwean
Immigration
NonimmigrantsImmigrantsAfghanistanAfricaAlbaniaArgentinaArmeniaAsiaAustraliaAustriaBahamasBangladeshBarbadosBelarusBelgiumBelizeBoliviaBosnia and HerzegovinaBrazilBulgariaBurma/MyanmarCabo VerdeCambodiaCameroonCanadaCaribbeanCentral AmericaChileChinaColombiaCongoCosta RicaCroatiaCubaCzechoslovakiaDenmarkDominicaDominican RepublicEastern AfricaEastern AsiaEastern EuropeEcuadorEgyptEl SalvadorEnglandEritreaEthiopiaEuropeFijiFranceGermanyGhanaGreeceGrenadaGuatemalaGuyanaHaitiHondurasHong KongHungaryIndiaIndonesiaIranIraqIrelandIsraelItalyJamaicaJapanJordanKazakhstanKenyaKoreaKuwaitLaosLatin AmericaLatviaLebanonLiberiaLithuaniaMalaysiaMexicoMicronesiaMiddle AfricaMoldovaMoroccoNepalNetherlandsNicaraguaNigeriaNorth AmericaNorth MacedoniaNorthern AfricaNorthern EuropeNorwayOceaniaPanamaPeruPhilippinesPolandPortugalRomaniaRussiaSaudi ArabiaScotlandSenegalSerbiaSierra LeoneSingaporeSomaliaSouth AfricaSouth AmericaSouth Central AsiaSouth Eastern AsiaSouthern EuropeSpainSri LankaSt. Vincent and the GrenadinesSudanSwedenSwitzerlandSyriaTaiwanThailandTrinidad and TobagoTurkeyUgandaUkraineUruguayUzbekistanVenezuelaVietnamWest IndiesWestern AfricaWestern AsiaWestern EuropeYemenZaireZimbabweAzores
Immigrants from Pakistan
Race
Ancestry
AfghanAfricanAlaska NativeAlaskan AthabascanAlbanianAleutAlsatianAmericanApacheArabArapahoArgentineanArmenianAssyrian/Chaldean/SyriacAustralianAustrianBahamianBangladeshiBarbadianBasqueBelgianBelizeanBermudanBhutaneseBlackfeetBolivianBrazilianBritishBritish West IndianBulgarianBurmeseCajunCambodianCanadianCape VerdeanCarpatho RusynCelticCentral AmericanCentral American IndianCherokeeCheyenneChickasawChileanChineseChippewaChoctawColombianColvilleComancheCosta RicanCreeCreekCroatianCrowCubanCypriotCzechCzechoslovakianDanishDelawareDominicanDutchDutch West IndianEastern EuropeanEcuadorianEgyptianEnglishEstonianEthiopianEuropeanFijianFilipinoFinnishFrenchFrench American IndianFrench CanadianGermanGerman RussianGhanaianGreekGuamanian/ChamorroGuatemalanGuyaneseHaitianHmongHonduranHopiHoumaHungarianIcelanderIndian (Asian)IndonesianInupiatIranianIraqiIrishIroquoisIsraeliItalianJamaicanJapaneseJordanianKenyanKiowaKoreanLaotianLatvianLebaneseLiberianLithuanianLumbeeLuxembourgerMacedonianMalaysianMalteseMarshalleseMenomineeMexicanMexican American IndianMongolianMoroccanNative HawaiianNavajoNepaleseNew ZealanderNicaraguanNigerianNorthern EuropeanNorwegianOkinawanOsageOttawaPaiutePakistaniPalestinianPanamanianParaguayanPennsylvania GermanPeruvianPimaPolishPortuguesePotawatomiPuebloPuerto RicanPuget Sound SalishRomanianRussianSalvadoranSamoanScandinavianScotch-IrishScottishSeminoleSenegaleseSerbianShoshoneSierra LeoneanSiouxSlavicSlovakSloveneSomaliSouth AfricanSouth AmericanSouth American IndianSoviet UnionSpaniardSpanishSpanish AmericanSpanish American IndianSri LankanSubsaharan AfricanSudaneseSwedishSwissSyrianTaiwaneseThaiTlingit-HaidaTohono O'OdhamTonganTrinidadian and TobagonianTsimshianTurkishU.S. Virgin IslanderUgandanUkrainianUruguayanUteVenezuelanVietnameseWelshWest IndianYakamaYaquiYugoslavianYumanYup'ikZimbabwean
Immigration
NonimmigrantsImmigrantsAfghanistanAfricaArgentinaArmeniaAsiaAustraliaAustriaBahamasBangladeshBarbadosBelarusBelgiumBelizeBoliviaBosnia and HerzegovinaBrazilBulgariaBurma/MyanmarCabo VerdeCambodiaCameroonCanadaCaribbeanCentral AmericaChileChinaColombiaCongoCosta RicaCroatiaCubaCzechoslovakiaDenmarkDominicaDominican RepublicEastern AfricaEastern AsiaEastern EuropeEcuadorEgyptEl SalvadorEnglandEritreaEthiopiaEuropeFijiFranceGermanyGhanaGreeceGrenadaGuatemalaGuyanaHaitiHondurasHong KongHungaryIndiaIndonesiaIranIraqIrelandIsraelItalyJamaicaJapanJordanKazakhstanKenyaKoreaKuwaitLaosLatin AmericaLatviaLebanonLiberiaLithuaniaMalaysiaMexicoMicronesiaMiddle AfricaMoldovaMoroccoNepalNetherlandsNicaraguaNigeriaNorth AmericaNorth MacedoniaNorthern AfricaNorthern EuropeNorwayOceaniaPakistanPanamaPeruPhilippinesPolandPortugalRomaniaRussiaSaudi ArabiaScotlandSenegalSerbiaSierra LeoneSingaporeSomaliaSouth AfricaSouth AmericaSouth Central AsiaSouth Eastern AsiaSouthern EuropeSpainSri LankaSt. Vincent and the GrenadinesSudanSwedenSwitzerlandSyriaTaiwanThailandTrinidad and TobagoTurkeyUgandaUkraineUruguayUzbekistanVenezuelaVietnamWest IndiesWestern AfricaWestern AsiaWestern EuropeYemenZaireZimbabweAzores
In Labor Force | Age 16-19
Income
Poverty
Unemployment
Labor Participation
Family Structure
Vehicle Availability
Education Level
Disability

In Labor Force | Age 16-19 Comparison

Immigrants from Albania

Immigrants from Pakistan

Poor
Tragic
35.8%
IN LABOR FORCE | AGE 16-19
15.0/ 100
METRIC RATING
204th/ 347
METRIC RANK
34.8%
IN LABOR FORCE | AGE 16-19
2.0/ 100
METRIC RATING
250th/ 347
METRIC RANK

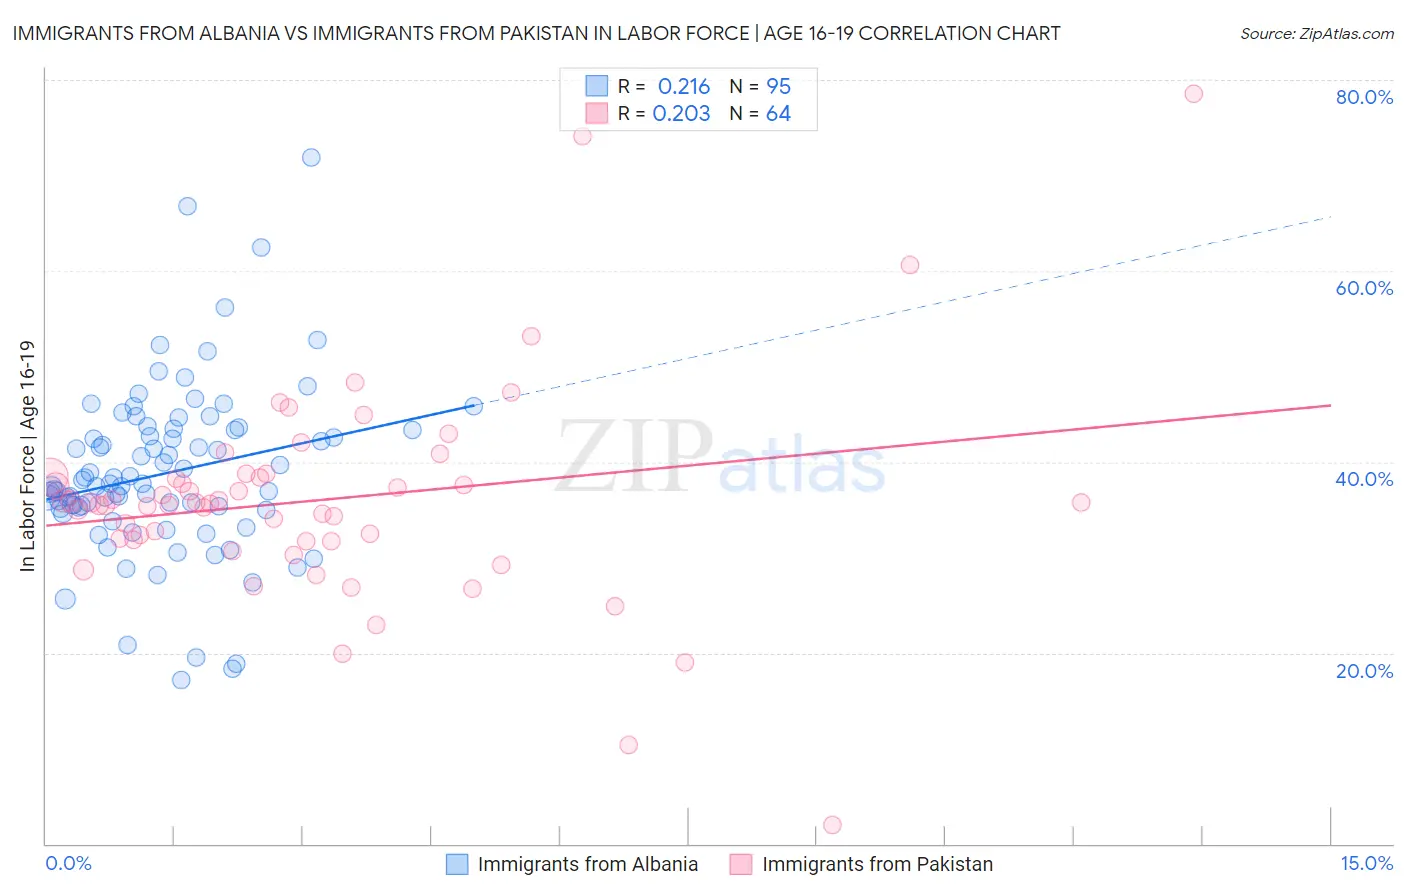
Immigrants from Albania vs Immigrants from Pakistan In Labor Force | Age 16-19 Correlation Chart

The statistical analysis conducted on geographies consisting of 119,330,257 people shows a weak positive correlation between the proportion of Immigrants from Albania and labor force participation rate among population between the ages 16 and 19 in the United States with a correlation coefficient (R) of 0.216 and weighted average of 35.8%. Similarly, the statistical analysis conducted on geographies consisting of 283,687,776 people shows a weak positive correlation between the proportion of Immigrants from Pakistan and labor force participation rate among population between the ages 16 and 19 in the United States with a correlation coefficient (R) of 0.203 and weighted average of 34.8%, a difference of 2.8%.
Immigrants from Albania vs Immigrants from Pakistan In Labor Force | Age 16-19

In Labor Force | Age 16-19 Correlation Summary

MeasurementImmigrants from AlbaniaImmigrants from Pakistan
Minimum17.1%2.0%
Maximum71.9%78.6%
Range54.8%76.6%
Mean38.8%36.0%
Median37.7%35.7%
Interquartile 25% (IQ1)35.1%31.8%
Interquartile 75% (IQ3)43.4%38.5%
Interquartile Range (IQR)8.3%6.7%
Standard Deviation (Sample)9.0%11.4%
Standard Deviation (Population)9.0%11.3%

Similar Demographics by In Labor Force | Age 16-19

Demographics Similar to Immigrants from Albania by In Labor Force | Age 16-19

In terms of in labor force | age 16-19, the demographic groups most similar to Immigrants from Albania are South American Indian (35.8%, a difference of 0.040%), Chilean (35.8%, a difference of 0.040%), Immigrants from Eastern Europe (35.8%, a difference of 0.050%), Immigrants from Nigeria (35.8%, a difference of 0.17%), and Korean (35.7%, a difference of 0.17%).
DemographicsRating | RankIn Labor Force | Age 16-19
Immigrants | Serbia
21.0
/100
|
#197
Fair
36.0%
Immigrants | Northern Africa
19.9
/100
|
#198
Poor
35.9%
Immigrants | Norway
19.8
/100
|
#199
Poor
35.9%
Immigrants | Sweden
18.8
/100
|
#200
Poor
35.9%
Alsatians
17.5
/100
|
#201
Poor
35.9%
Senegalese
17.4
/100
|
#202
Poor
35.9%
Immigrants | Nigeria
16.8
/100
|
#203
Poor
35.8%
Immigrants | Albania
15.0
/100
|
#204
Poor
35.8%
South American Indians
14.6
/100
|
#205
Poor
35.8%
Chileans
14.6
/100
|
#206
Poor
35.8%
Immigrants | Eastern Europe
14.5
/100
|
#207
Poor
35.8%
Koreans
13.3
/100
|
#208
Poor
35.7%
Moroccans
12.7
/100
|
#209
Poor
35.7%
Immigrants | Switzerland
11.9
/100
|
#210
Poor
35.6%
Mexicans
11.9
/100
|
#211
Poor
35.6%

Demographics Similar to Immigrants from Pakistan by In Labor Force | Age 16-19

In terms of in labor force | age 16-19, the demographic groups most similar to Immigrants from Pakistan are Immigrants from Western Asia (34.8%, a difference of 0.020%), Immigrants from Chile (34.8%, a difference of 0.030%), Immigrants from Ukraine (34.8%, a difference of 0.10%), Central American (34.8%, a difference of 0.13%), and Laotian (34.9%, a difference of 0.21%).
DemographicsRating | RankIn Labor Force | Age 16-19
Pueblo
2.6
/100
|
#243
Tragic
34.9%
Immigrants | Turkey
2.6
/100
|
#244
Tragic
34.9%
Immigrants | Greece
2.4
/100
|
#245
Tragic
34.9%
Immigrants | Sri Lanka
2.4
/100
|
#246
Tragic
34.9%
Laotians
2.4
/100
|
#247
Tragic
34.9%
Central Americans
2.2
/100
|
#248
Tragic
34.8%
Immigrants | Ukraine
2.2
/100
|
#249
Tragic
34.8%
Immigrants | Pakistan
2.0
/100
|
#250
Tragic
34.8%
Immigrants | Western Asia
2.0
/100
|
#251
Tragic
34.8%
Immigrants | Chile
2.0
/100
|
#252
Tragic
34.8%
Immigrants | Japan
1.5
/100
|
#253
Tragic
34.7%
Bahamians
1.4
/100
|
#254
Tragic
34.6%
Peruvians
1.4
/100
|
#255
Tragic
34.6%
Immigrants | South Central Asia
1.3
/100
|
#256
Tragic
34.6%
Immigrants | Egypt
1.2
/100
|
#257
Tragic
34.6%