Immigrants from Africa vs Mexican In Labor Force | Age 45-54
COMPARE
Immigrants from Africa
Mexican
In Labor Force | Age 45-54
In Labor Force | Age 45-54 Comparison
Immigrants from Africa
Mexicans
83.2%
IN LABOR FORCE | AGE 45-54
92.6/ 100
METRIC RATING
110th/ 347
METRIC RANK
79.8%
IN LABOR FORCE | AGE 45-54
0.0/ 100
METRIC RATING
311th/ 347
METRIC RANK
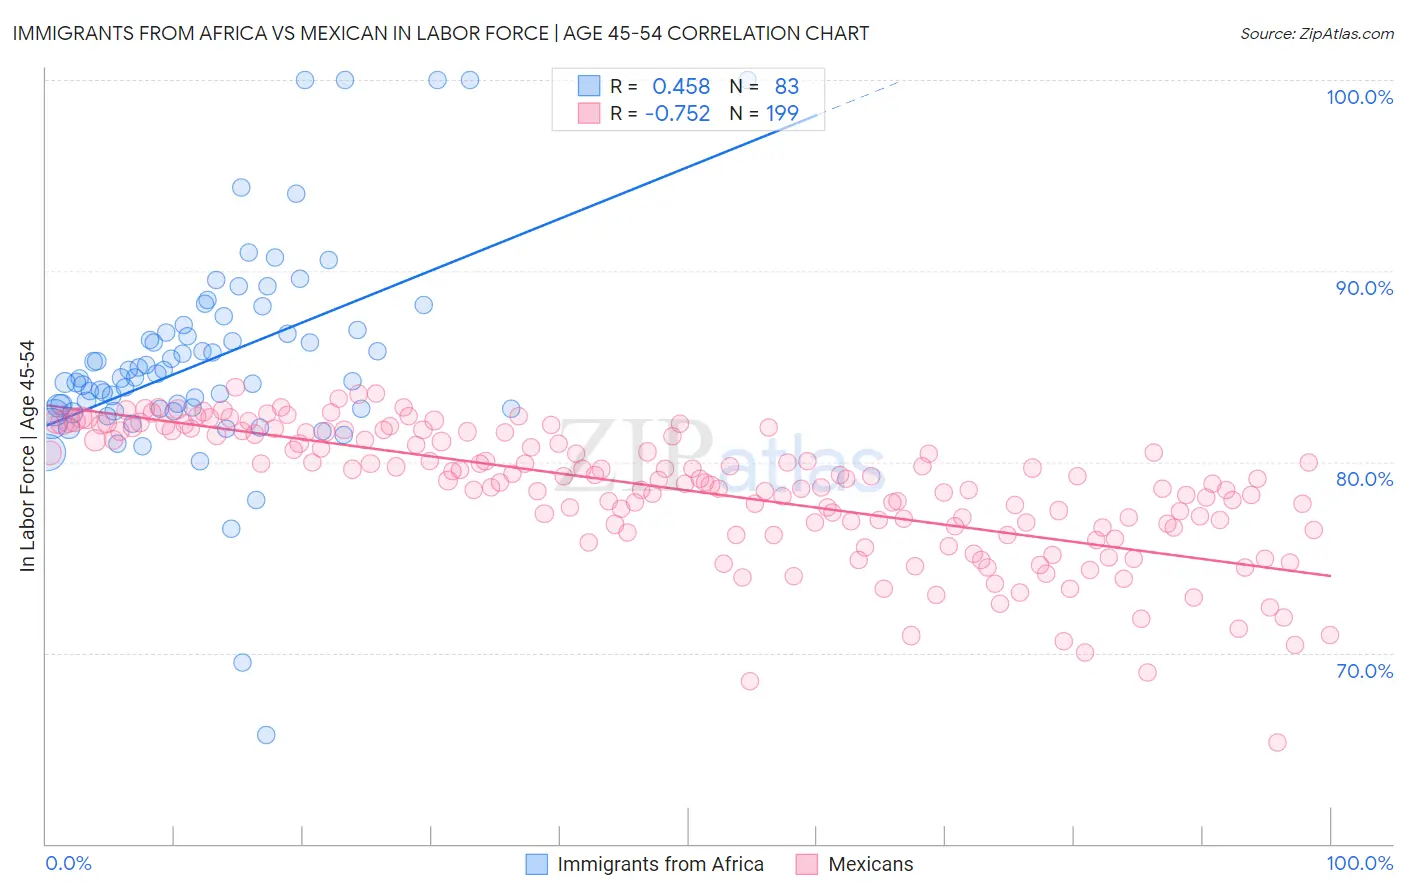
Immigrants from Africa vs Mexican In Labor Force | Age 45-54 Correlation Chart
The statistical analysis conducted on geographies consisting of 468,907,137 people shows a moderate positive correlation between the proportion of Immigrants from Africa and labor force participation rate among population between the ages 45 and 54 in the United States with a correlation coefficient (R) of 0.458 and weighted average of 83.2%. Similarly, the statistical analysis conducted on geographies consisting of 564,480,863 people shows a strong negative correlation between the proportion of Mexicans and labor force participation rate among population between the ages 45 and 54 in the United States with a correlation coefficient (R) of -0.752 and weighted average of 79.8%, a difference of 4.3%.
In Labor Force | Age 45-54 Correlation Summary
| Measurement | Immigrants from Africa | Mexican |
| Minimum | 65.7% | 65.3% |
| Maximum | 100.0% | 83.9% |
| Range | 34.3% | 18.6% |
| Mean | 85.3% | 78.5% |
| Median | 84.4% | 79.0% |
| Interquartile 25% (IQ1) | 82.8% | 76.6% |
| Interquartile 75% (IQ3) | 86.9% | 81.5% |
| Interquartile Range (IQR) | 4.1% | 4.9% |
| Standard Deviation (Sample) | 5.5% | 3.4% |
| Standard Deviation (Population) | 5.5% | 3.4% |
Similar Demographics by In Labor Force | Age 45-54
Demographics Similar to Immigrants from Africa by In Labor Force | Age 45-54
In terms of in labor force | age 45-54, the demographic groups most similar to Immigrants from Africa are Slovak (83.2%, a difference of 0.0%), Ukrainian (83.2%, a difference of 0.0%), Immigrants from Italy (83.2%, a difference of 0.0%), Iranian (83.2%, a difference of 0.010%), and Immigrants from Afghanistan (83.2%, a difference of 0.010%).
| Demographics | Rating | Rank | In Labor Force | Age 45-54 |
| Albanians | 93.9 /100 | #103 | Exceptional 83.3% |
| Immigrants | Romania | 93.8 /100 | #104 | Exceptional 83.3% |
| Immigrants | South America | 93.5 /100 | #105 | Exceptional 83.2% |
| Sri Lankans | 93.2 /100 | #106 | Exceptional 83.2% |
| Iranians | 92.9 /100 | #107 | Exceptional 83.2% |
| Slovaks | 92.8 /100 | #108 | Exceptional 83.2% |
| Ukrainians | 92.7 /100 | #109 | Exceptional 83.2% |
| Immigrants | Africa | 92.6 /100 | #110 | Exceptional 83.2% |
| Immigrants | Italy | 92.5 /100 | #111 | Exceptional 83.2% |
| Immigrants | Afghanistan | 92.4 /100 | #112 | Exceptional 83.2% |
| Immigrants | Albania | 91.8 /100 | #113 | Exceptional 83.2% |
| Assyrians/Chaldeans/Syriacs | 91.7 /100 | #114 | Exceptional 83.2% |
| Immigrants | Chile | 91.6 /100 | #115 | Exceptional 83.2% |
| Immigrants | Malaysia | 91.4 /100 | #116 | Exceptional 83.2% |
| Immigrants | China | 90.9 /100 | #117 | Exceptional 83.2% |
Demographics Similar to Mexicans by In Labor Force | Age 45-54
In terms of in labor force | age 45-54, the demographic groups most similar to Mexicans are Inupiat (79.9%, a difference of 0.11%), Immigrants from Mexico (79.7%, a difference of 0.14%), Potawatomi (80.0%, a difference of 0.20%), Central American Indian (80.0%, a difference of 0.22%), and Blackfeet (80.0%, a difference of 0.26%).
| Demographics | Rating | Rank | In Labor Force | Age 45-54 |
| Hispanics or Latinos | 0.0 /100 | #304 | Tragic 80.1% |
| Immigrants | Dominican Republic | 0.0 /100 | #305 | Tragic 80.1% |
| Spanish Americans | 0.0 /100 | #306 | Tragic 80.1% |
| Blackfeet | 0.0 /100 | #307 | Tragic 80.0% |
| Central American Indians | 0.0 /100 | #308 | Tragic 80.0% |
| Potawatomi | 0.0 /100 | #309 | Tragic 80.0% |
| Inupiat | 0.0 /100 | #310 | Tragic 79.9% |
| Mexicans | 0.0 /100 | #311 | Tragic 79.8% |
| Immigrants | Mexico | 0.0 /100 | #312 | Tragic 79.7% |
| Colville | 0.0 /100 | #313 | Tragic 79.5% |
| Ottawa | 0.0 /100 | #314 | Tragic 79.5% |
| Blacks/African Americans | 0.0 /100 | #315 | Tragic 79.3% |
| Shoshone | 0.0 /100 | #316 | Tragic 79.3% |
| Comanche | 0.0 /100 | #317 | Tragic 79.2% |
| Chickasaw | 0.0 /100 | #318 | Tragic 79.0% |