Immigrants from Afghanistan vs Norwegian In Labor Force | Age 16-19
COMPARE
Immigrants from Afghanistan
Norwegian
In Labor Force | Age 16-19
In Labor Force | Age 16-19 Comparison
Immigrants from Afghanistan
Norwegians
36.3%
IN LABOR FORCE | AGE 16-19
34.0/ 100
METRIC RATING
187th/ 347
METRIC RANK
46.2%
IN LABOR FORCE | AGE 16-19
100.0/ 100
METRIC RATING
2nd/ 347
METRIC RANK
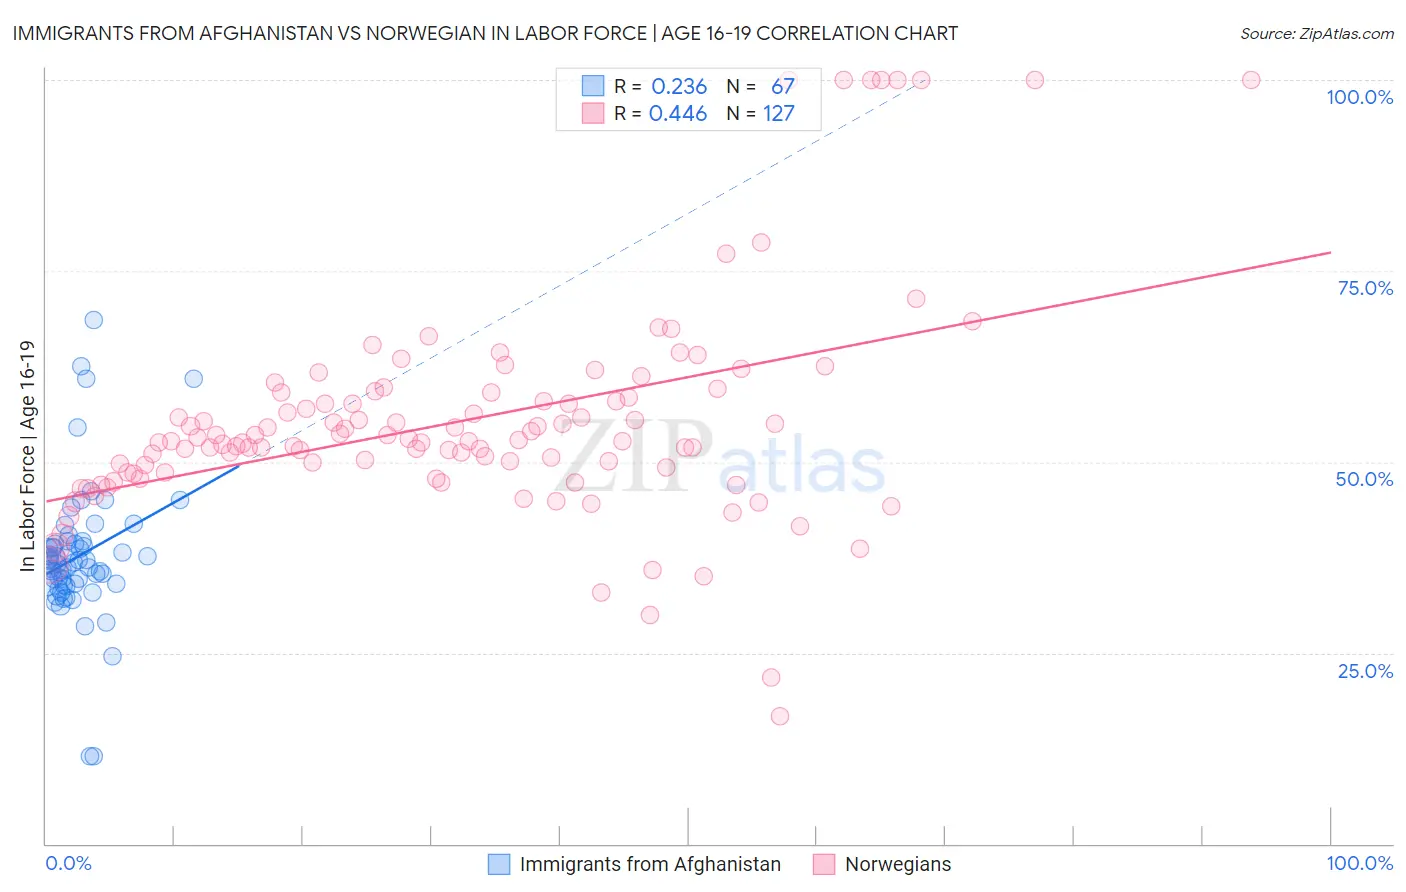
Immigrants from Afghanistan vs Norwegian In Labor Force | Age 16-19 Correlation Chart
The statistical analysis conducted on geographies consisting of 147,514,090 people shows a weak positive correlation between the proportion of Immigrants from Afghanistan and labor force participation rate among population between the ages 16 and 19 in the United States with a correlation coefficient (R) of 0.236 and weighted average of 36.3%. Similarly, the statistical analysis conducted on geographies consisting of 530,724,351 people shows a moderate positive correlation between the proportion of Norwegians and labor force participation rate among population between the ages 16 and 19 in the United States with a correlation coefficient (R) of 0.446 and weighted average of 46.2%, a difference of 27.4%.
In Labor Force | Age 16-19 Correlation Summary
| Measurement | Immigrants from Afghanistan | Norwegian |
| Minimum | 11.4% | 16.7% |
| Maximum | 68.5% | 100.0% |
| Range | 57.1% | 83.3% |
| Mean | 37.7% | 55.4% |
| Median | 36.9% | 52.8% |
| Interquartile 25% (IQ1) | 34.0% | 48.6% |
| Interquartile 75% (IQ3) | 39.3% | 59.1% |
| Interquartile Range (IQR) | 5.3% | 10.5% |
| Standard Deviation (Sample) | 9.0% | 14.6% |
| Standard Deviation (Population) | 9.0% | 14.6% |
Similar Demographics by In Labor Force | Age 16-19
Demographics Similar to Immigrants from Afghanistan by In Labor Force | Age 16-19
In terms of in labor force | age 16-19, the demographic groups most similar to Immigrants from Afghanistan are Immigrants from Romania (36.3%, a difference of 0.0%), Bhutanese (36.3%, a difference of 0.080%), Costa Rican (36.3%, a difference of 0.12%), Immigrants from Europe (36.2%, a difference of 0.13%), and Eastern European (36.4%, a difference of 0.27%).
| Demographics | Rating | Rank | In Labor Force | Age 16-19 |
| Immigrants | Morocco | 41.1 /100 | #180 | Average 36.4% |
| Jordanians | 39.6 /100 | #181 | Fair 36.4% |
| Immigrants | Italy | 39.1 /100 | #182 | Fair 36.4% |
| Eastern Europeans | 38.8 /100 | #183 | Fair 36.4% |
| Costa Ricans | 36.1 /100 | #184 | Fair 36.3% |
| Bhutanese | 35.3 /100 | #185 | Fair 36.3% |
| Immigrants | Romania | 34.0 /100 | #186 | Fair 36.3% |
| Immigrants | Afghanistan | 34.0 /100 | #187 | Fair 36.3% |
| Immigrants | Europe | 31.8 /100 | #188 | Fair 36.2% |
| Immigrants | Hungary | 28.8 /100 | #189 | Fair 36.2% |
| Panamanians | 28.6 /100 | #190 | Fair 36.1% |
| Immigrants | Croatia | 27.5 /100 | #191 | Fair 36.1% |
| Afghans | 25.7 /100 | #192 | Fair 36.1% |
| Immigrants | Denmark | 25.0 /100 | #193 | Fair 36.1% |
| Nigerians | 24.6 /100 | #194 | Fair 36.1% |
Demographics Similar to Norwegians by In Labor Force | Age 16-19
In terms of in labor force | age 16-19, the demographic groups most similar to Norwegians are Pennsylvania German (46.4%, a difference of 0.56%), Immigrants from Somalia (45.6%, a difference of 1.3%), Luxembourger (45.3%, a difference of 2.0%), Alaskan Athabascan (45.2%, a difference of 2.2%), and Somali (45.1%, a difference of 2.4%).
| Demographics | Rating | Rank | In Labor Force | Age 16-19 |
| Pennsylvania Germans | 100.0 /100 | #1 | Exceptional 46.4% |
| Norwegians | 100.0 /100 | #2 | Exceptional 46.2% |
| Immigrants | Somalia | 100.0 /100 | #3 | Exceptional 45.6% |
| Luxembourgers | 100.0 /100 | #4 | Exceptional 45.3% |
| Alaskan Athabascans | 100.0 /100 | #5 | Exceptional 45.2% |
| Somalis | 100.0 /100 | #6 | Exceptional 45.1% |
| Danes | 100.0 /100 | #7 | Exceptional 44.7% |
| Immigrants | Cabo Verde | 100.0 /100 | #8 | Exceptional 44.7% |
| Cape Verdeans | 100.0 /100 | #9 | Exceptional 44.5% |
| Germans | 100.0 /100 | #10 | Exceptional 44.2% |
| Swedes | 100.0 /100 | #11 | Exceptional 44.1% |
| Finns | 100.0 /100 | #12 | Exceptional 43.9% |
| Dutch | 100.0 /100 | #13 | Exceptional 43.8% |
| Chippewa | 100.0 /100 | #14 | Exceptional 43.8% |
| Slovenes | 100.0 /100 | #15 | Exceptional 43.7% |