Immigrants from Afghanistan vs German In Labor Force | Age > 16

COMPARE

Immigrants from Afghanistan
Race
Ancestry
AfghanAfricanAlaska NativeAlaskan AthabascanAlbanianAleutAlsatianAmericanApacheArabArapahoArgentineanArmenianAssyrian/Chaldean/SyriacAustralianAustrianBahamianBangladeshiBarbadianBasqueBelgianBelizeanBermudanBhutaneseBlackfeetBolivianBrazilianBritishBritish West IndianBulgarianBurmeseCajunCambodianCanadianCape VerdeanCarpatho RusynCelticCentral AmericanCentral American IndianCherokeeCheyenneChickasawChileanChineseChippewaChoctawColombianColvilleComancheCosta RicanCreeCreekCroatianCrowCubanCypriotCzechCzechoslovakianDanishDelawareDominicanDutchDutch West IndianEastern EuropeanEcuadorianEgyptianEnglishEstonianEthiopianEuropeanFijianFilipinoFinnishFrenchFrench American IndianFrench CanadianGerman RussianGhanaianGreekGuamanian/ChamorroGuatemalanGuyaneseHaitianHmongHonduranHopiHoumaHungarianIcelanderIndian (Asian)IndonesianInupiatIranianIraqiIrishIroquoisIsraeliItalianJamaicanJapaneseJordanianKenyanKiowaKoreanLaotianLatvianLebaneseLiberianLithuanianLumbeeLuxembourgerMacedonianMalaysianMalteseMarshalleseMenomineeMexicanMexican American IndianMongolianMoroccanNative HawaiianNavajoNepaleseNew ZealanderNicaraguanNigerianNorthern EuropeanNorwegianOkinawanOsageOttawaPaiutePakistaniPalestinianPanamanianParaguayanPennsylvania GermanPeruvianPimaPolishPortuguesePotawatomiPuebloPuerto RicanPuget Sound SalishRomanianRussianSalvadoranSamoanScandinavianScotch-IrishScottishSeminoleSenegaleseSerbianShoshoneSierra LeoneanSiouxSlavicSlovakSloveneSomaliSouth AfricanSouth AmericanSouth American IndianSoviet UnionSpaniardSpanishSpanish AmericanSpanish American IndianSri LankanSubsaharan AfricanSudaneseSwedishSwissSyrianTaiwaneseThaiTlingit-HaidaTohono O'OdhamTonganTrinidadian and TobagonianTsimshianTurkishU.S. Virgin IslanderUgandanUkrainianUruguayanUteVenezuelanVietnameseWelshWest IndianYakamaYaquiYugoslavianYumanYup'ikZimbabwean
Immigration
NonimmigrantsImmigrantsAfghanistanAfricaAlbaniaArgentinaArmeniaAsiaAustraliaAustriaBahamasBangladeshBarbadosBelarusBelgiumBelizeBoliviaBosnia and HerzegovinaBrazilBulgariaBurma/MyanmarCabo VerdeCambodiaCameroonCanadaCaribbeanCentral AmericaChileChinaColombiaCongoCosta RicaCroatiaCubaCzechoslovakiaDenmarkDominicaDominican RepublicEastern AfricaEastern AsiaEastern EuropeEcuadorEgyptEl SalvadorEnglandEritreaEthiopiaEuropeFijiFranceGermanyGhanaGreeceGrenadaGuatemalaGuyanaHaitiHondurasHong KongHungaryIndiaIndonesiaIranIraqIrelandIsraelItalyJamaicaJapanJordanKazakhstanKenyaKoreaKuwaitLaosLatin AmericaLatviaLebanonLiberiaLithuaniaMalaysiaMexicoMicronesiaMiddle AfricaMoldovaMoroccoNepalNetherlandsNicaraguaNigeriaNorth AmericaNorth MacedoniaNorthern AfricaNorthern EuropeNorwayOceaniaPakistanPanamaPeruPhilippinesPolandPortugalRomaniaRussiaSaudi ArabiaScotlandSenegalSerbiaSierra LeoneSingaporeSomaliaSouth AfricaSouth AmericaSouth Central AsiaSouth Eastern AsiaSouthern EuropeSpainSri LankaSt. Vincent and the GrenadinesSudanSwedenSwitzerlandSyriaTaiwanThailandTrinidad and TobagoTurkeyUgandaUkraineUruguayUzbekistanVenezuelaVietnamWest IndiesWestern AfricaWestern AsiaWestern EuropeYemenZaireZimbabweAzores
German
Race
Ancestry
AfghanAfricanAlaska NativeAlaskan AthabascanAlbanianAleutAlsatianAmericanApacheArabArapahoArgentineanArmenianAssyrian/Chaldean/SyriacAustralianAustrianBahamianBangladeshiBarbadianBasqueBelgianBelizeanBermudanBhutaneseBlackfeetBolivianBrazilianBritishBritish West IndianBulgarianBurmeseCajunCambodianCanadianCape VerdeanCarpatho RusynCelticCentral AmericanCentral American IndianCherokeeCheyenneChickasawChileanChineseChippewaChoctawColombianColvilleComancheCosta RicanCreeCreekCroatianCrowCubanCypriotCzechCzechoslovakianDanishDelawareDominicanDutchDutch West IndianEastern EuropeanEcuadorianEgyptianEnglishEstonianEthiopianEuropeanFijianFilipinoFinnishFrenchFrench American IndianFrench CanadianGermanGerman RussianGhanaianGreekGuamanian/ChamorroGuatemalanGuyaneseHaitianHmongHonduranHopiHoumaHungarianIcelanderIndian (Asian)IndonesianInupiatIranianIraqiIrishIroquoisIsraeliItalianJamaicanJapaneseJordanianKenyanKiowaKoreanLaotianLatvianLebaneseLiberianLithuanianLumbeeLuxembourgerMacedonianMalaysianMalteseMarshalleseMenomineeMexicanMexican American IndianMongolianMoroccanNative HawaiianNavajoNepaleseNew ZealanderNicaraguanNigerianNorthern EuropeanNorwegianOkinawanOsageOttawaPaiutePakistaniPalestinianPanamanianParaguayanPennsylvania GermanPeruvianPimaPolishPortuguesePotawatomiPuebloPuerto RicanPuget Sound SalishRomanianRussianSalvadoranSamoanScandinavianScotch-IrishScottishSeminoleSenegaleseSerbianShoshoneSierra LeoneanSiouxSlavicSlovakSloveneSomaliSouth AfricanSouth AmericanSouth American IndianSoviet UnionSpaniardSpanishSpanish AmericanSpanish American IndianSri LankanSubsaharan AfricanSudaneseSwedishSwissSyrianTaiwaneseThaiTlingit-HaidaTohono O'OdhamTonganTrinidadian and TobagonianTsimshianTurkishU.S. Virgin IslanderUgandanUkrainianUruguayanUteVenezuelanVietnameseWelshWest IndianYakamaYaquiYugoslavianYumanYup'ikZimbabwean
Immigration
NonimmigrantsImmigrantsAfricaAlbaniaArgentinaArmeniaAsiaAustraliaAustriaBahamasBangladeshBarbadosBelarusBelgiumBelizeBoliviaBosnia and HerzegovinaBrazilBulgariaBurma/MyanmarCabo VerdeCambodiaCameroonCanadaCaribbeanCentral AmericaChileChinaColombiaCongoCosta RicaCroatiaCubaCzechoslovakiaDenmarkDominicaDominican RepublicEastern AfricaEastern AsiaEastern EuropeEcuadorEgyptEl SalvadorEnglandEritreaEthiopiaEuropeFijiFranceGermanyGhanaGreeceGrenadaGuatemalaGuyanaHaitiHondurasHong KongHungaryIndiaIndonesiaIranIraqIrelandIsraelItalyJamaicaJapanJordanKazakhstanKenyaKoreaKuwaitLaosLatin AmericaLatviaLebanonLiberiaLithuaniaMalaysiaMexicoMicronesiaMiddle AfricaMoldovaMoroccoNepalNetherlandsNicaraguaNigeriaNorth AmericaNorth MacedoniaNorthern AfricaNorthern EuropeNorwayOceaniaPakistanPanamaPeruPhilippinesPolandPortugalRomaniaRussiaSaudi ArabiaScotlandSenegalSerbiaSierra LeoneSingaporeSomaliaSouth AfricaSouth AmericaSouth Central AsiaSouth Eastern AsiaSouthern EuropeSpainSri LankaSt. Vincent and the GrenadinesSudanSwedenSwitzerlandSyriaTaiwanThailandTrinidad and TobagoTurkeyUgandaUkraineUruguayUzbekistanVenezuelaVietnamWest IndiesWestern AfricaWestern AsiaWestern EuropeYemenZaireZimbabweAzores
In Labor Force | Age > 16
Income
Poverty
Unemployment
Labor Participation
Family Structure
Vehicle Availability
Education Level
Disability

In Labor Force | Age > 16 Comparison

Immigrants from Afghanistan

Germans

Exceptional
Tragic
67.0%
IN LABOR FORCE | AGE > 16
100.0/ 100
METRIC RATING
37th/ 347
METRIC RANK
64.4%
IN LABOR FORCE | AGE > 16
1.8/ 100
METRIC RATING
249th/ 347
METRIC RANK

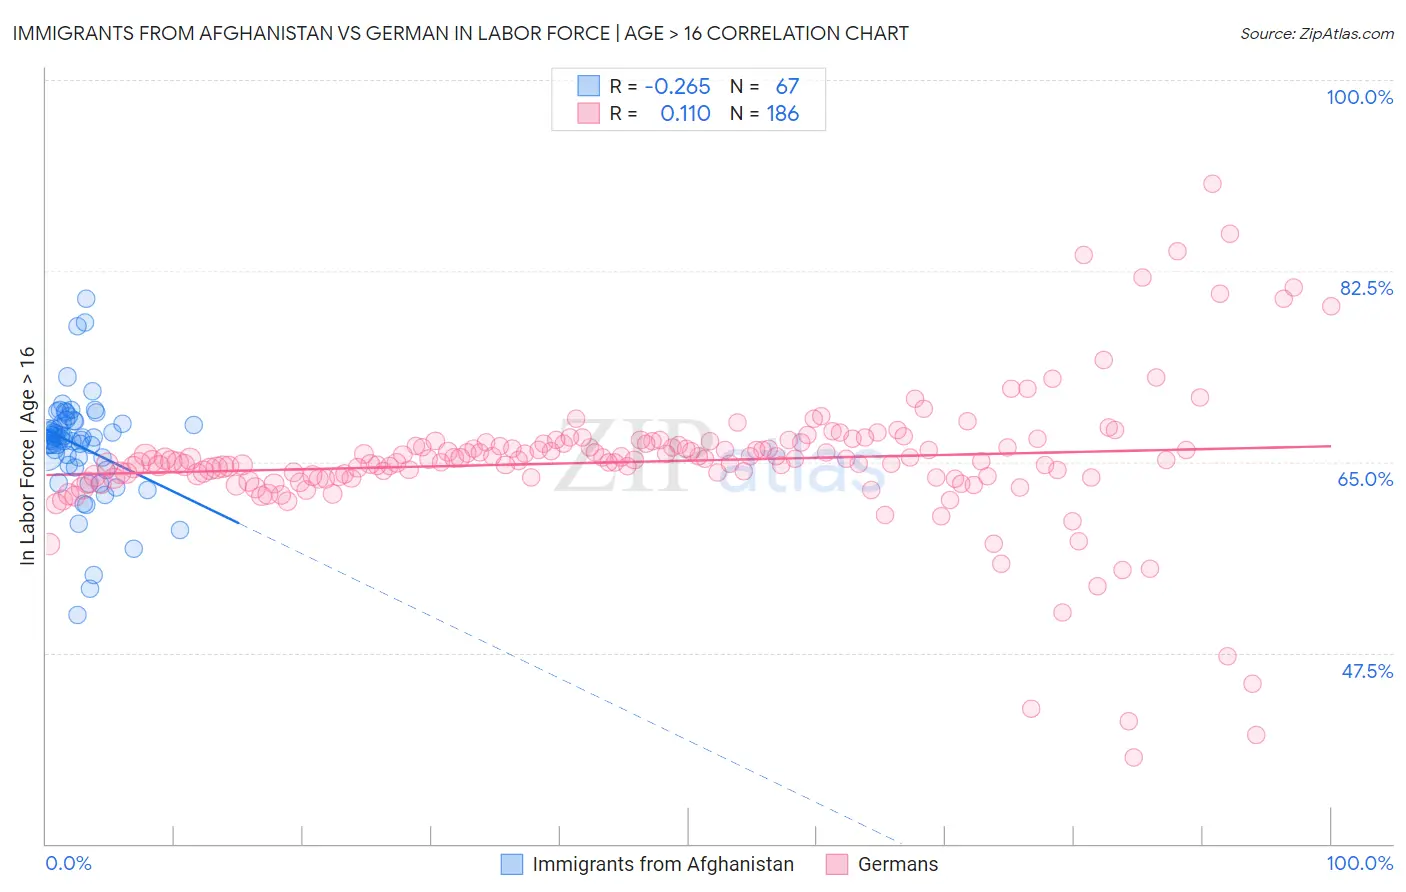
Immigrants from Afghanistan vs German In Labor Force | Age > 16 Correlation Chart

The statistical analysis conducted on geographies consisting of 147,646,039 people shows a weak negative correlation between the proportion of Immigrants from Afghanistan and labor force participation rate among population ages 16 and over in the United States with a correlation coefficient (R) of -0.265 and weighted average of 67.0%. Similarly, the statistical analysis conducted on geographies consisting of 581,290,926 people shows a poor positive correlation between the proportion of Germans and labor force participation rate among population ages 16 and over in the United States with a correlation coefficient (R) of 0.110 and weighted average of 64.4%, a difference of 4.1%.
Immigrants from Afghanistan vs German In Labor Force | Age > 16

In Labor Force | Age > 16 Correlation Summary

MeasurementImmigrants from AfghanistanGerman
Minimum50.9%37.9%
Maximum80.0%90.5%
Range29.1%52.6%
Mean66.5%65.0%
Median67.1%65.1%
Interquartile 25% (IQ1)64.7%63.6%
Interquartile 75% (IQ3)68.7%66.6%
Interquartile Range (IQR)4.0%3.0%
Standard Deviation (Sample)4.8%6.5%
Standard Deviation (Population)4.8%6.5%

Similar Demographics by In Labor Force | Age > 16

Demographics Similar to Immigrants from Afghanistan by In Labor Force | Age > 16

In terms of in labor force | age > 16, the demographic groups most similar to Immigrants from Afghanistan are Immigrants from South Central Asia (67.1%, a difference of 0.080%), Immigrants from Western Africa (67.1%, a difference of 0.080%), Immigrants from Nigeria (66.9%, a difference of 0.12%), Immigrants from Ghana (67.1%, a difference of 0.13%), and Immigrants from Congo (67.1%, a difference of 0.14%).
DemographicsRating | RankIn Labor Force | Age > 16
Immigrants | Zaire
100.0
/100
|
#30
Exceptional
67.2%
Ghanaians
100.0
/100
|
#31
Exceptional
67.1%
Immigrants | Congo
100.0
/100
|
#32
Exceptional
67.1%
Afghans
100.0
/100
|
#33
Exceptional
67.1%
Immigrants | Ghana
100.0
/100
|
#34
Exceptional
67.1%
Immigrants | South Central Asia
100.0
/100
|
#35
Exceptional
67.1%
Immigrants | Western Africa
100.0
/100
|
#36
Exceptional
67.1%
Immigrants | Afghanistan
100.0
/100
|
#37
Exceptional
67.0%
Immigrants | Nigeria
100.0
/100
|
#38
Exceptional
66.9%
Salvadorans
100.0
/100
|
#39
Exceptional
66.8%
Immigrants | El Salvador
100.0
/100
|
#40
Exceptional
66.8%
Immigrants | Zimbabwe
100.0
/100
|
#41
Exceptional
66.8%
Senegalese
100.0
/100
|
#42
Exceptional
66.7%
Luxembourgers
100.0
/100
|
#43
Exceptional
66.7%
Immigrants | Pakistan
100.0
/100
|
#44
Exceptional
66.7%

Demographics Similar to Germans by In Labor Force | Age > 16

In terms of in labor force | age > 16, the demographic groups most similar to Germans are British West Indian (64.4%, a difference of 0.010%), Immigrants from Barbados (64.4%, a difference of 0.030%), Portuguese (64.4%, a difference of 0.030%), Swiss (64.4%, a difference of 0.040%), and Immigrants from Caribbean (64.4%, a difference of 0.060%).
DemographicsRating | RankIn Labor Force | Age > 16
Immigrants | Netherlands
3.4
/100
|
#242
Tragic
64.5%
Immigrants | Lebanon
3.2
/100
|
#243
Tragic
64.5%
Tsimshian
3.1
/100
|
#244
Tragic
64.5%
West Indians
3.0
/100
|
#245
Tragic
64.5%
Immigrants | Caribbean
2.3
/100
|
#246
Tragic
64.4%
Swiss
2.1
/100
|
#247
Tragic
64.4%
Immigrants | Barbados
2.1
/100
|
#248
Tragic
64.4%
Germans
1.8
/100
|
#249
Tragic
64.4%
British West Indians
1.8
/100
|
#250
Tragic
64.4%
Portuguese
1.6
/100
|
#251
Tragic
64.4%
Immigrants | Dominican Republic
1.5
/100
|
#252
Tragic
64.4%
Czechoslovakians
1.4
/100
|
#253
Tragic
64.3%
Immigrants | Uzbekistan
1.4
/100
|
#254
Tragic
64.3%
Hispanics or Latinos
1.1
/100
|
#255
Tragic
64.3%
Immigrants | Mexico
1.0
/100
|
#256
Tragic
64.3%