Icelander vs Immigrants from Kuwait In Labor Force | Age > 16
COMPARE
Icelander
Immigrants from Kuwait
In Labor Force | Age > 16
In Labor Force | Age > 16 Comparison
Icelanders
Immigrants from Kuwait
65.6%
IN LABOR FORCE | AGE > 16
94.3/ 100
METRIC RATING
131st/ 347
METRIC RANK
66.5%
IN LABOR FORCE | AGE > 16
100.0/ 100
METRIC RATING
51st/ 347
METRIC RANK
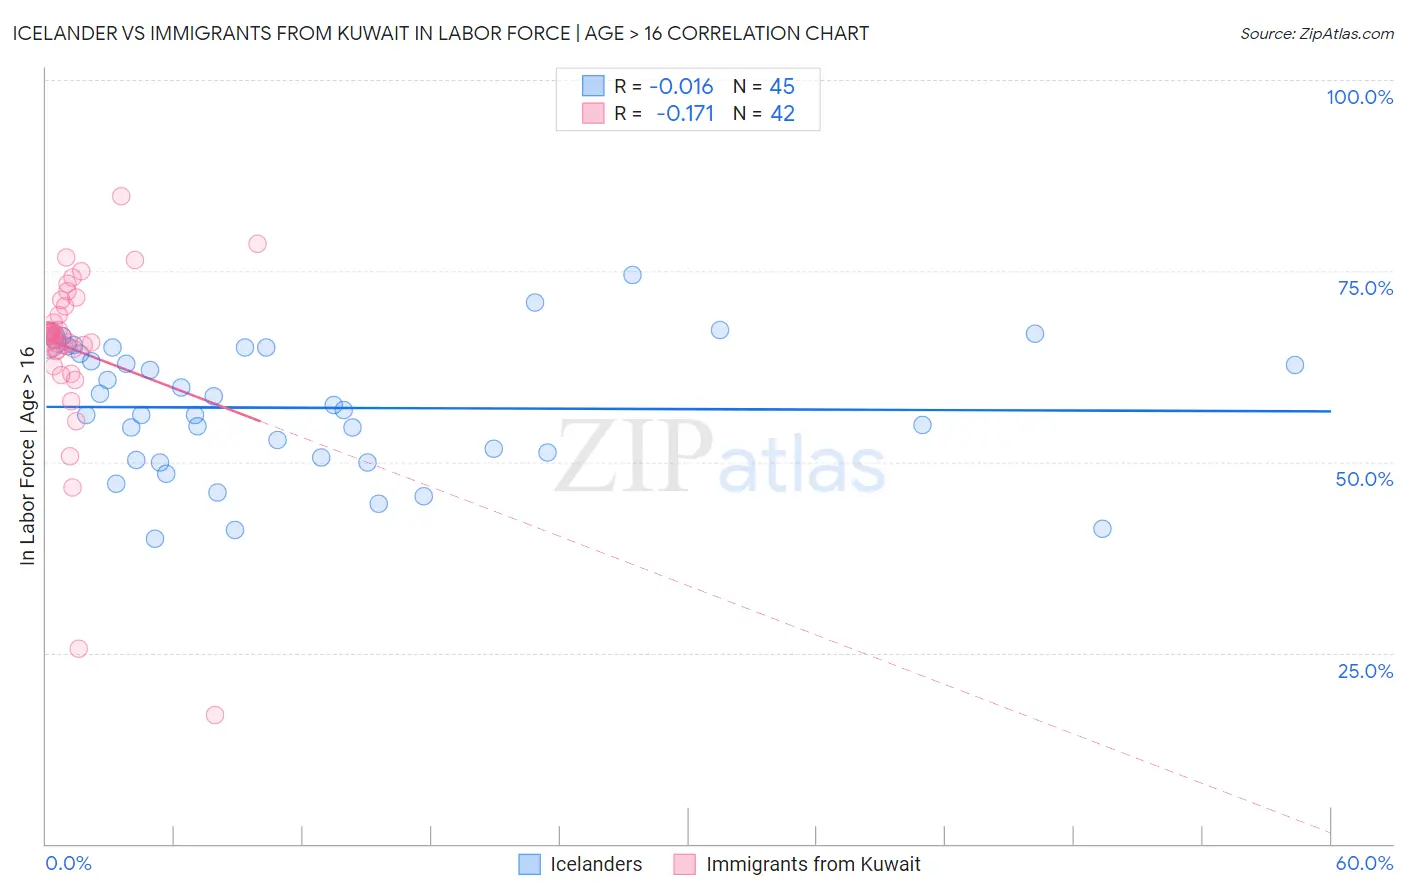
Icelander vs Immigrants from Kuwait In Labor Force | Age > 16 Correlation Chart
The statistical analysis conducted on geographies consisting of 159,668,800 people shows no correlation between the proportion of Icelanders and labor force participation rate among population ages 16 and over in the United States with a correlation coefficient (R) of -0.016 and weighted average of 65.6%. Similarly, the statistical analysis conducted on geographies consisting of 136,916,630 people shows a poor negative correlation between the proportion of Immigrants from Kuwait and labor force participation rate among population ages 16 and over in the United States with a correlation coefficient (R) of -0.171 and weighted average of 66.5%, a difference of 1.3%.
In Labor Force | Age > 16 Correlation Summary
| Measurement | Icelander | Immigrants from Kuwait |
| Minimum | 39.9% | 16.8% |
| Maximum | 74.5% | 84.7% |
| Range | 34.6% | 67.9% |
| Mean | 57.1% | 64.6% |
| Median | 56.8% | 66.5% |
| Interquartile 25% (IQ1) | 50.4% | 64.5% |
| Interquartile 75% (IQ3) | 65.0% | 70.4% |
| Interquartile Range (IQR) | 14.6% | 5.9% |
| Standard Deviation (Sample) | 8.5% | 12.0% |
| Standard Deviation (Population) | 8.4% | 11.9% |
Similar Demographics by In Labor Force | Age > 16
Demographics Similar to Icelanders by In Labor Force | Age > 16
In terms of in labor force | age > 16, the demographic groups most similar to Icelanders are Immigrants from Guatemala (65.6%, a difference of 0.0%), Immigrants from Philippines (65.6%, a difference of 0.010%), Immigrants from North Macedonia (65.6%, a difference of 0.010%), Ecuadorian (65.6%, a difference of 0.020%), and Immigrants from Eastern Asia (65.7%, a difference of 0.030%).
| Demographics | Rating | Rank | In Labor Force | Age > 16 |
| Iraqis | 95.4 /100 | #124 | Exceptional 65.7% |
| Norwegians | 95.3 /100 | #125 | Exceptional 65.7% |
| Koreans | 95.3 /100 | #126 | Exceptional 65.7% |
| Immigrants | Eastern Asia | 94.9 /100 | #127 | Exceptional 65.7% |
| Ecuadorians | 94.7 /100 | #128 | Exceptional 65.6% |
| Immigrants | Philippines | 94.5 /100 | #129 | Exceptional 65.6% |
| Immigrants | Guatemala | 94.4 /100 | #130 | Exceptional 65.6% |
| Icelanders | 94.3 /100 | #131 | Exceptional 65.6% |
| Immigrants | North Macedonia | 94.1 /100 | #132 | Exceptional 65.6% |
| Immigrants | Lithuania | 93.5 /100 | #133 | Exceptional 65.6% |
| Costa Ricans | 93.2 /100 | #134 | Exceptional 65.6% |
| Guatemalans | 92.5 /100 | #135 | Exceptional 65.6% |
| Immigrants | Argentina | 92.4 /100 | #136 | Exceptional 65.6% |
| Guamanians/Chamorros | 92.4 /100 | #137 | Exceptional 65.6% |
| Immigrants | West Indies | 92.0 /100 | #138 | Exceptional 65.6% |
Demographics Similar to Immigrants from Kuwait by In Labor Force | Age > 16
In terms of in labor force | age > 16, the demographic groups most similar to Immigrants from Kuwait are Paraguayan (66.5%, a difference of 0.030%), Immigrants from Sri Lanka (66.5%, a difference of 0.050%), Cape Verdean (66.6%, a difference of 0.070%), Immigrants from Bosnia and Herzegovina (66.5%, a difference of 0.080%), and Immigrants from Northern Africa (66.6%, a difference of 0.12%).
| Demographics | Rating | Rank | In Labor Force | Age > 16 |
| Immigrants | Pakistan | 100.0 /100 | #44 | Exceptional 66.7% |
| Immigrants | Brazil | 100.0 /100 | #45 | Exceptional 66.7% |
| Brazilians | 100.0 /100 | #46 | Exceptional 66.6% |
| Immigrants | Bulgaria | 100.0 /100 | #47 | Exceptional 66.6% |
| Nigerians | 100.0 /100 | #48 | Exceptional 66.6% |
| Immigrants | Northern Africa | 100.0 /100 | #49 | Exceptional 66.6% |
| Cape Verdeans | 100.0 /100 | #50 | Exceptional 66.6% |
| Immigrants | Kuwait | 100.0 /100 | #51 | Exceptional 66.5% |
| Paraguayans | 99.9 /100 | #52 | Exceptional 66.5% |
| Immigrants | Sri Lanka | 99.9 /100 | #53 | Exceptional 66.5% |
| Immigrants | Bosnia and Herzegovina | 99.9 /100 | #54 | Exceptional 66.5% |
| Immigrants | Venezuela | 99.9 /100 | #55 | Exceptional 66.4% |
| Immigrants | Senegal | 99.9 /100 | #56 | Exceptional 66.4% |
| Bulgarians | 99.9 /100 | #57 | Exceptional 66.4% |
| Immigrants | Saudi Arabia | 99.9 /100 | #58 | Exceptional 66.3% |