Hungarian vs Vietnamese In Labor Force | Age 30-34
COMPARE
Hungarian
Vietnamese
In Labor Force | Age 30-34
In Labor Force | Age 30-34 Comparison
Hungarians
Vietnamese
84.5%
IN LABOR FORCE | AGE 30-34
24.8/ 100
METRIC RATING
191st/ 347
METRIC RANK
83.6%
IN LABOR FORCE | AGE 30-34
0.1/ 100
METRIC RATING
269th/ 347
METRIC RANK
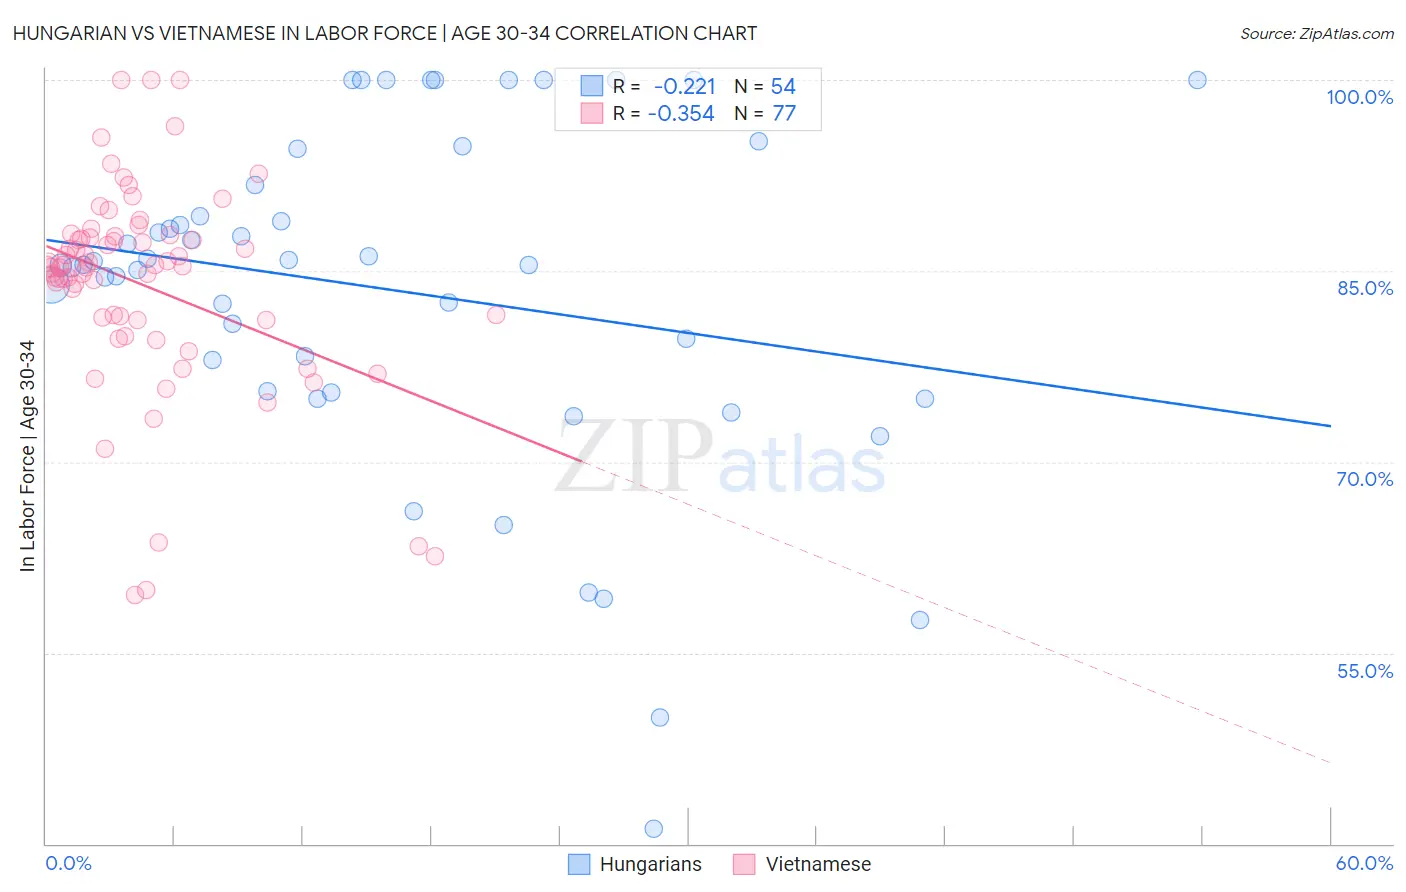
Hungarian vs Vietnamese In Labor Force | Age 30-34 Correlation Chart
The statistical analysis conducted on geographies consisting of 485,743,554 people shows a weak negative correlation between the proportion of Hungarians and labor force participation rate among population between the ages 30 and 34 in the United States with a correlation coefficient (R) of -0.221 and weighted average of 84.5%. Similarly, the statistical analysis conducted on geographies consisting of 170,686,461 people shows a mild negative correlation between the proportion of Vietnamese and labor force participation rate among population between the ages 30 and 34 in the United States with a correlation coefficient (R) of -0.354 and weighted average of 83.6%, a difference of 1.1%.
In Labor Force | Age 30-34 Correlation Summary
| Measurement | Hungarian | Vietnamese |
| Minimum | 41.2% | 59.5% |
| Maximum | 100.0% | 100.0% |
| Range | 58.8% | 40.5% |
| Mean | 83.5% | 83.9% |
| Median | 85.5% | 85.3% |
| Interquartile 25% (IQ1) | 75.6% | 81.1% |
| Interquartile 75% (IQ3) | 91.7% | 87.7% |
| Interquartile Range (IQR) | 16.1% | 6.6% |
| Standard Deviation (Sample) | 13.4% | 8.2% |
| Standard Deviation (Population) | 13.2% | 8.1% |
Similar Demographics by In Labor Force | Age 30-34
Demographics Similar to Hungarians by In Labor Force | Age 30-34
In terms of in labor force | age 30-34, the demographic groups most similar to Hungarians are Scandinavian (84.5%, a difference of 0.0%), Immigrants from Zaire (84.5%, a difference of 0.010%), Immigrants from Costa Rica (84.5%, a difference of 0.010%), Immigrants from Afghanistan (84.5%, a difference of 0.010%), and Korean (84.5%, a difference of 0.020%).
| Demographics | Rating | Rank | In Labor Force | Age 30-34 |
| Immigrants | North America | 33.3 /100 | #184 | Fair 84.6% |
| Immigrants | Philippines | 31.5 /100 | #185 | Fair 84.6% |
| Immigrants | Congo | 29.7 /100 | #186 | Fair 84.6% |
| Costa Ricans | 29.6 /100 | #187 | Fair 84.6% |
| Taiwanese | 29.4 /100 | #188 | Fair 84.6% |
| Nigerians | 28.9 /100 | #189 | Fair 84.5% |
| Immigrants | Zaire | 25.8 /100 | #190 | Fair 84.5% |
| Hungarians | 24.8 /100 | #191 | Fair 84.5% |
| Scandinavians | 24.7 /100 | #192 | Fair 84.5% |
| Immigrants | Costa Rica | 23.9 /100 | #193 | Fair 84.5% |
| Immigrants | Afghanistan | 23.5 /100 | #194 | Fair 84.5% |
| Koreans | 23.2 /100 | #195 | Fair 84.5% |
| British | 22.9 /100 | #196 | Fair 84.5% |
| Immigrants | Syria | 21.9 /100 | #197 | Fair 84.5% |
| Dutch | 20.2 /100 | #198 | Fair 84.5% |
Demographics Similar to Vietnamese by In Labor Force | Age 30-34
In terms of in labor force | age 30-34, the demographic groups most similar to Vietnamese are Immigrants from Bangladesh (83.6%, a difference of 0.010%), Spaniard (83.6%, a difference of 0.020%), Spanish American (83.5%, a difference of 0.050%), Spanish (83.5%, a difference of 0.070%), and Nonimmigrants (83.5%, a difference of 0.070%).
| Demographics | Rating | Rank | In Labor Force | Age 30-34 |
| Dominicans | 0.2 /100 | #262 | Tragic 83.8% |
| Immigrants | Guyana | 0.2 /100 | #263 | Tragic 83.8% |
| Guatemalans | 0.2 /100 | #264 | Tragic 83.7% |
| Immigrants | Honduras | 0.1 /100 | #265 | Tragic 83.7% |
| Immigrants | Guatemala | 0.1 /100 | #266 | Tragic 83.7% |
| Spaniards | 0.1 /100 | #267 | Tragic 83.6% |
| Immigrants | Bangladesh | 0.1 /100 | #268 | Tragic 83.6% |
| Vietnamese | 0.1 /100 | #269 | Tragic 83.6% |
| Spanish Americans | 0.0 /100 | #270 | Tragic 83.5% |
| Spanish | 0.0 /100 | #271 | Tragic 83.5% |
| Immigrants | Nonimmigrants | 0.0 /100 | #272 | Tragic 83.5% |
| Guamanians/Chamorros | 0.0 /100 | #273 | Tragic 83.5% |
| Belizeans | 0.0 /100 | #274 | Tragic 83.5% |
| Immigrants | Grenada | 0.0 /100 | #275 | Tragic 83.5% |
| Tongans | 0.0 /100 | #276 | Tragic 83.5% |