Hmong vs Immigrants from Eastern Africa In Labor Force | Age 45-54
COMPARE
Hmong
Immigrants from Eastern Africa
In Labor Force | Age 45-54
In Labor Force | Age 45-54 Comparison
Hmong
Immigrants from Eastern Africa
81.7%
IN LABOR FORCE | AGE 45-54
0.3/ 100
METRIC RATING
249th/ 347
METRIC RANK
83.9%
IN LABOR FORCE | AGE 45-54
99.8/ 100
METRIC RATING
20th/ 347
METRIC RANK
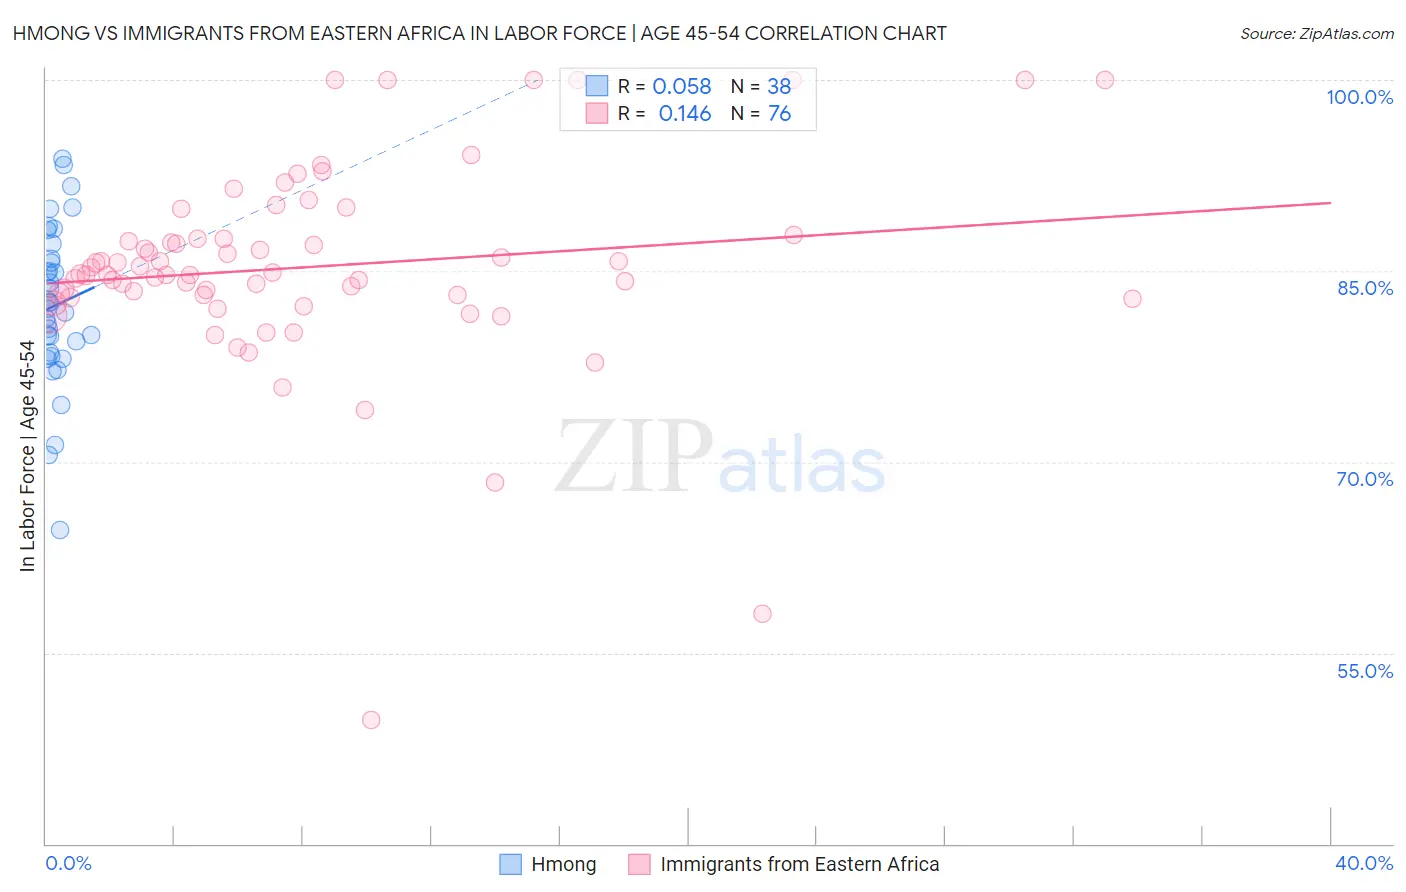
Hmong vs Immigrants from Eastern Africa In Labor Force | Age 45-54 Correlation Chart
The statistical analysis conducted on geographies consisting of 24,677,654 people shows a slight positive correlation between the proportion of Hmong and labor force participation rate among population between the ages 45 and 54 in the United States with a correlation coefficient (R) of 0.058 and weighted average of 81.7%. Similarly, the statistical analysis conducted on geographies consisting of 354,881,316 people shows a poor positive correlation between the proportion of Immigrants from Eastern Africa and labor force participation rate among population between the ages 45 and 54 in the United States with a correlation coefficient (R) of 0.146 and weighted average of 83.9%, a difference of 2.7%.
In Labor Force | Age 45-54 Correlation Summary
| Measurement | Hmong | Immigrants from Eastern Africa |
| Minimum | 64.6% | 49.7% |
| Maximum | 93.8% | 100.0% |
| Range | 29.2% | 50.3% |
| Mean | 82.3% | 85.3% |
| Median | 82.2% | 84.7% |
| Interquartile 25% (IQ1) | 78.6% | 83.0% |
| Interquartile 75% (IQ3) | 85.9% | 87.5% |
| Interquartile Range (IQR) | 7.3% | 4.5% |
| Standard Deviation (Sample) | 6.2% | 8.0% |
| Standard Deviation (Population) | 6.1% | 8.0% |
Similar Demographics by In Labor Force | Age 45-54
Demographics Similar to Hmong by In Labor Force | Age 45-54
In terms of in labor force | age 45-54, the demographic groups most similar to Hmong are Puget Sound Salish (81.7%, a difference of 0.020%), Central American (81.7%, a difference of 0.040%), Immigrants from Armenia (81.7%, a difference of 0.050%), Alaskan Athabascan (81.8%, a difference of 0.060%), and Alaska Native (81.8%, a difference of 0.070%).
| Demographics | Rating | Rank | In Labor Force | Age 45-54 |
| Whites/Caucasians | 0.7 /100 | #242 | Tragic 81.9% |
| Samoans | 0.6 /100 | #243 | Tragic 81.8% |
| Celtics | 0.4 /100 | #244 | Tragic 81.8% |
| Alaska Natives | 0.4 /100 | #245 | Tragic 81.8% |
| Alaskan Athabascans | 0.4 /100 | #246 | Tragic 81.8% |
| Central Americans | 0.4 /100 | #247 | Tragic 81.7% |
| Puget Sound Salish | 0.3 /100 | #248 | Tragic 81.7% |
| Hmong | 0.3 /100 | #249 | Tragic 81.7% |
| Immigrants | Armenia | 0.2 /100 | #250 | Tragic 81.7% |
| Guamanians/Chamorros | 0.2 /100 | #251 | Tragic 81.6% |
| Pennsylvania Germans | 0.2 /100 | #252 | Tragic 81.6% |
| Japanese | 0.2 /100 | #253 | Tragic 81.6% |
| Immigrants | Laos | 0.2 /100 | #254 | Tragic 81.6% |
| Scotch-Irish | 0.2 /100 | #255 | Tragic 81.6% |
| Barbadians | 0.1 /100 | #256 | Tragic 81.6% |
Demographics Similar to Immigrants from Eastern Africa by In Labor Force | Age 45-54
In terms of in labor force | age 45-54, the demographic groups most similar to Immigrants from Eastern Africa are Immigrants from Sri Lanka (83.9%, a difference of 0.0%), Immigrants from Ireland (83.9%, a difference of 0.0%), Czech (83.9%, a difference of 0.010%), Tlingit-Haida (83.9%, a difference of 0.010%), and Slovene (83.9%, a difference of 0.010%).
| Demographics | Rating | Rank | In Labor Force | Age 45-54 |
| Chinese | 99.9 /100 | #13 | Exceptional 84.1% |
| Cambodians | 99.9 /100 | #14 | Exceptional 84.1% |
| Cypriots | 99.9 /100 | #15 | Exceptional 84.1% |
| Immigrants | Nepal | 99.9 /100 | #16 | Exceptional 84.0% |
| Zimbabweans | 99.9 /100 | #17 | Exceptional 84.0% |
| Immigrants | South Central Asia | 99.9 /100 | #18 | Exceptional 84.0% |
| Czechs | 99.8 /100 | #19 | Exceptional 83.9% |
| Immigrants | Eastern Africa | 99.8 /100 | #20 | Exceptional 83.9% |
| Immigrants | Sri Lanka | 99.8 /100 | #21 | Exceptional 83.9% |
| Immigrants | Ireland | 99.8 /100 | #22 | Exceptional 83.9% |
| Tlingit-Haida | 99.8 /100 | #23 | Exceptional 83.9% |
| Slovenes | 99.8 /100 | #24 | Exceptional 83.9% |
| Immigrants | North Macedonia | 99.8 /100 | #25 | Exceptional 83.9% |
| Immigrants | Serbia | 99.8 /100 | #26 | Exceptional 83.9% |
| Immigrants | Brazil | 99.8 /100 | #27 | Exceptional 83.9% |