Hispanic or Latino vs Immigrants from St. Vincent and the Grenadines In Labor Force | Age > 16
COMPARE
Hispanic or Latino
Immigrants from St. Vincent and the Grenadines
In Labor Force | Age > 16
In Labor Force | Age > 16 Comparison
Hispanics or Latinos
Immigrants from St. Vincent and the Grenadines
64.3%
IN LABOR FORCE | AGE > 16
1.1/ 100
METRIC RATING
255th/ 347
METRIC RANK
64.0%
IN LABOR FORCE | AGE > 16
0.2/ 100
METRIC RATING
280th/ 347
METRIC RANK
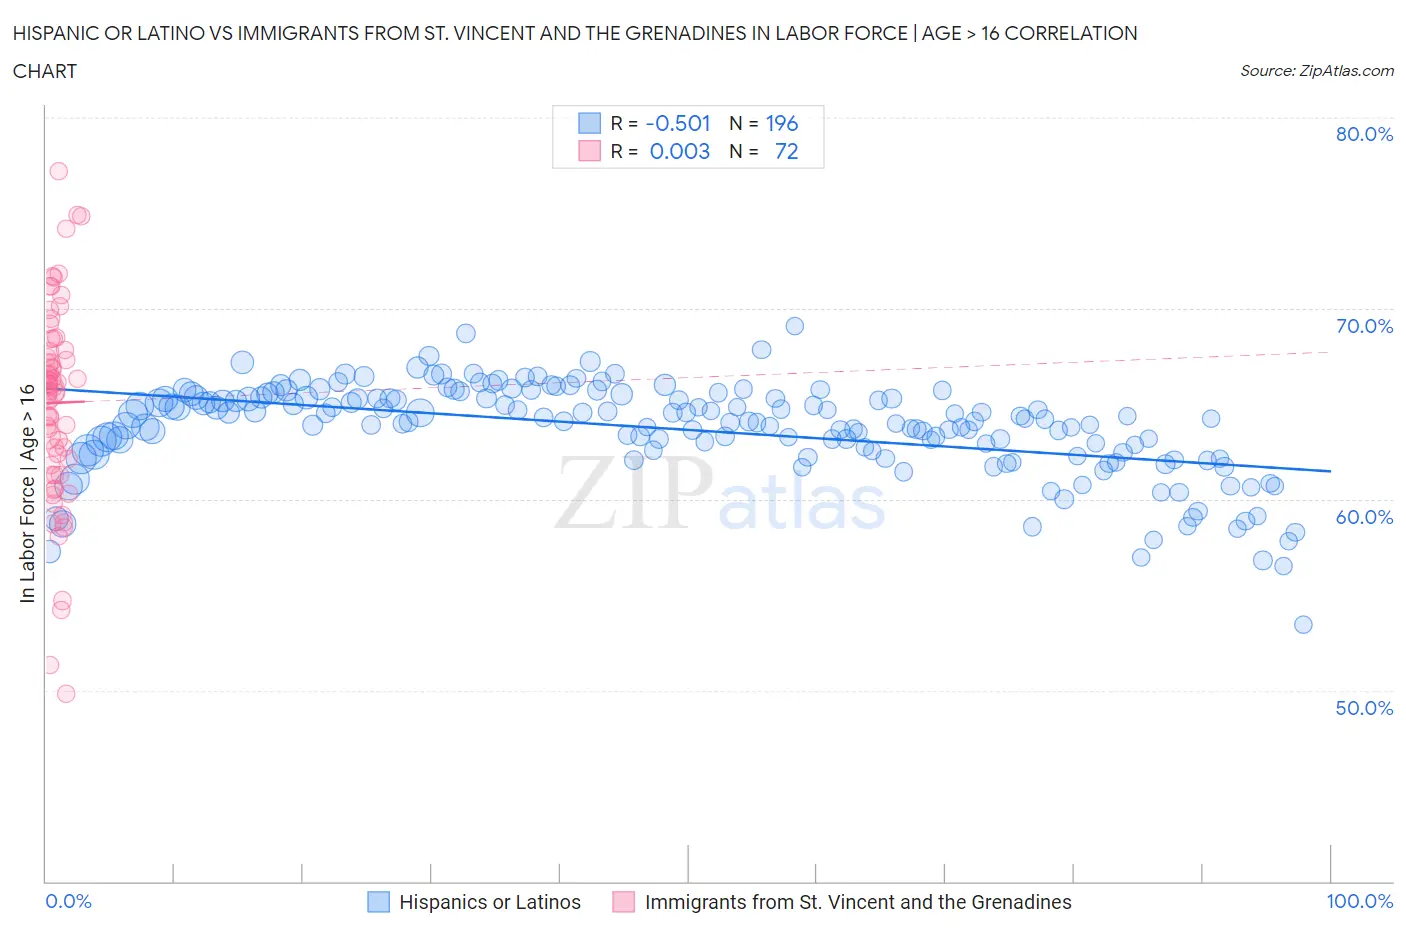
Hispanic or Latino vs Immigrants from St. Vincent and the Grenadines In Labor Force | Age > 16 Correlation Chart
The statistical analysis conducted on geographies consisting of 574,025,710 people shows a substantial negative correlation between the proportion of Hispanics or Latinos and labor force participation rate among population ages 16 and over in the United States with a correlation coefficient (R) of -0.501 and weighted average of 64.3%. Similarly, the statistical analysis conducted on geographies consisting of 56,194,380 people shows no correlation between the proportion of Immigrants from St. Vincent and the Grenadines and labor force participation rate among population ages 16 and over in the United States with a correlation coefficient (R) of 0.003 and weighted average of 64.0%, a difference of 0.46%.
In Labor Force | Age > 16 Correlation Summary
| Measurement | Hispanic or Latino | Immigrants from St. Vincent and the Grenadines |
| Minimum | 53.4% | 49.8% |
| Maximum | 69.1% | 77.2% |
| Range | 15.7% | 27.4% |
| Mean | 63.7% | 65.1% |
| Median | 64.1% | 65.8% |
| Interquartile 25% (IQ1) | 62.5% | 62.0% |
| Interquartile 75% (IQ3) | 65.3% | 67.8% |
| Interquartile Range (IQR) | 2.8% | 5.8% |
| Standard Deviation (Sample) | 2.5% | 5.2% |
| Standard Deviation (Population) | 2.5% | 5.1% |
Similar Demographics by In Labor Force | Age > 16
Demographics Similar to Hispanics or Latinos by In Labor Force | Age > 16
In terms of in labor force | age > 16, the demographic groups most similar to Hispanics or Latinos are Immigrants from Mexico (64.3%, a difference of 0.040%), Immigrants from Uzbekistan (64.3%, a difference of 0.070%), Immigrants from Dominican Republic (64.4%, a difference of 0.080%), Czechoslovakian (64.3%, a difference of 0.080%), and Inupiat (64.3%, a difference of 0.080%).
| Demographics | Rating | Rank | In Labor Force | Age > 16 |
| Immigrants | Barbados | 2.1 /100 | #248 | Tragic 64.4% |
| Germans | 1.8 /100 | #249 | Tragic 64.4% |
| British West Indians | 1.8 /100 | #250 | Tragic 64.4% |
| Portuguese | 1.6 /100 | #251 | Tragic 64.4% |
| Immigrants | Dominican Republic | 1.5 /100 | #252 | Tragic 64.4% |
| Czechoslovakians | 1.4 /100 | #253 | Tragic 64.3% |
| Immigrants | Uzbekistan | 1.4 /100 | #254 | Tragic 64.3% |
| Hispanics or Latinos | 1.1 /100 | #255 | Tragic 64.3% |
| Immigrants | Mexico | 1.0 /100 | #256 | Tragic 64.3% |
| Inupiat | 0.8 /100 | #257 | Tragic 64.3% |
| Immigrants | Scotland | 0.8 /100 | #258 | Tragic 64.2% |
| Immigrants | Western Europe | 0.7 /100 | #259 | Tragic 64.2% |
| Marshallese | 0.7 /100 | #260 | Tragic 64.2% |
| Basques | 0.7 /100 | #261 | Tragic 64.2% |
| Finns | 0.7 /100 | #262 | Tragic 64.2% |
Demographics Similar to Immigrants from St. Vincent and the Grenadines by In Labor Force | Age > 16
In terms of in labor force | age > 16, the demographic groups most similar to Immigrants from St. Vincent and the Grenadines are French Canadian (64.0%, a difference of 0.0%), Welsh (64.0%, a difference of 0.010%), Assyrian/Chaldean/Syriac (64.0%, a difference of 0.040%), Immigrants from Bahamas (64.0%, a difference of 0.060%), and Immigrants from Guyana (64.0%, a difference of 0.080%).
| Demographics | Rating | Rank | In Labor Force | Age > 16 |
| Hmong | 0.3 /100 | #273 | Tragic 64.1% |
| Immigrants | Cuba | 0.3 /100 | #274 | Tragic 64.1% |
| Mexicans | 0.3 /100 | #275 | Tragic 64.1% |
| French American Indians | 0.3 /100 | #276 | Tragic 64.1% |
| Immigrants | Bahamas | 0.3 /100 | #277 | Tragic 64.0% |
| Assyrians/Chaldeans/Syriacs | 0.3 /100 | #278 | Tragic 64.0% |
| Welsh | 0.2 /100 | #279 | Tragic 64.0% |
| Immigrants | St. Vincent and the Grenadines | 0.2 /100 | #280 | Tragic 64.0% |
| French Canadians | 0.2 /100 | #281 | Tragic 64.0% |
| Immigrants | Guyana | 0.2 /100 | #282 | Tragic 64.0% |
| Immigrants | Germany | 0.1 /100 | #283 | Tragic 63.9% |
| French | 0.1 /100 | #284 | Tragic 63.9% |
| Slovaks | 0.1 /100 | #285 | Tragic 63.9% |
| Immigrants | Austria | 0.1 /100 | #286 | Tragic 63.9% |
| Scottish | 0.1 /100 | #287 | Tragic 63.9% |