Hispanic or Latino vs Czech In Labor Force | Age 45-54
COMPARE
Hispanic or Latino
Czech
In Labor Force | Age 45-54
In Labor Force | Age 45-54 Comparison
Hispanics or Latinos
Czechs
80.1%
IN LABOR FORCE | AGE 45-54
0.0/ 100
METRIC RATING
304th/ 347
METRIC RANK
83.9%
IN LABOR FORCE | AGE 45-54
99.8/ 100
METRIC RATING
19th/ 347
METRIC RANK
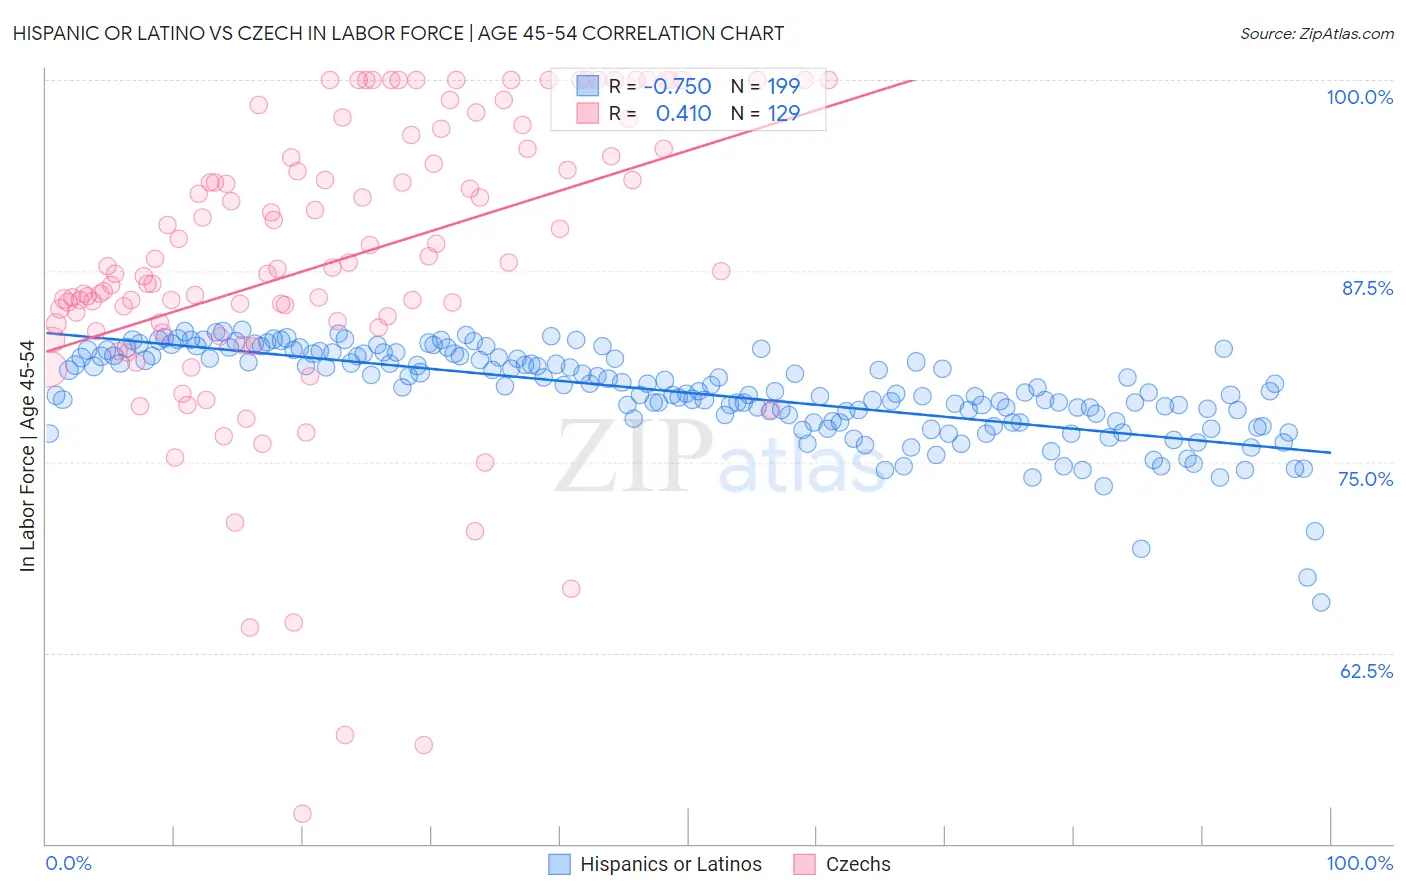
Hispanic or Latino vs Czech In Labor Force | Age 45-54 Correlation Chart
The statistical analysis conducted on geographies consisting of 576,352,392 people shows a strong negative correlation between the proportion of Hispanics or Latinos and labor force participation rate among population between the ages 45 and 54 in the United States with a correlation coefficient (R) of -0.750 and weighted average of 80.1%. Similarly, the statistical analysis conducted on geographies consisting of 484,423,200 people shows a moderate positive correlation between the proportion of Czechs and labor force participation rate among population between the ages 45 and 54 in the United States with a correlation coefficient (R) of 0.410 and weighted average of 83.9%, a difference of 4.8%.
In Labor Force | Age 45-54 Correlation Summary
| Measurement | Hispanic or Latino | Czech |
| Minimum | 65.8% | 51.9% |
| Maximum | 83.7% | 100.0% |
| Range | 17.9% | 48.1% |
| Mean | 79.5% | 88.1% |
| Median | 79.8% | 87.6% |
| Interquartile 25% (IQ1) | 77.8% | 83.9% |
| Interquartile 75% (IQ3) | 81.9% | 95.5% |
| Interquartile Range (IQR) | 4.1% | 11.6% |
| Standard Deviation (Sample) | 3.0% | 9.7% |
| Standard Deviation (Population) | 3.0% | 9.6% |
Similar Demographics by In Labor Force | Age 45-54
Demographics Similar to Hispanics or Latinos by In Labor Force | Age 45-54
In terms of in labor force | age 45-54, the demographic groups most similar to Hispanics or Latinos are Immigrants from Dominican Republic (80.1%, a difference of 0.010%), Immigrants from the Azores (80.1%, a difference of 0.020%), Spanish American (80.1%, a difference of 0.050%), Immigrants from Central America (80.2%, a difference of 0.090%), and Blackfeet (80.0%, a difference of 0.12%).
| Demographics | Rating | Rank | In Labor Force | Age 45-54 |
| Americans | 0.0 /100 | #297 | Tragic 80.4% |
| Marshallese | 0.0 /100 | #298 | Tragic 80.3% |
| Dominicans | 0.0 /100 | #299 | Tragic 80.3% |
| Fijians | 0.0 /100 | #300 | Tragic 80.2% |
| Spanish American Indians | 0.0 /100 | #301 | Tragic 80.2% |
| Immigrants | Central America | 0.0 /100 | #302 | Tragic 80.2% |
| Immigrants | Azores | 0.0 /100 | #303 | Tragic 80.1% |
| Hispanics or Latinos | 0.0 /100 | #304 | Tragic 80.1% |
| Immigrants | Dominican Republic | 0.0 /100 | #305 | Tragic 80.1% |
| Spanish Americans | 0.0 /100 | #306 | Tragic 80.1% |
| Blackfeet | 0.0 /100 | #307 | Tragic 80.0% |
| Central American Indians | 0.0 /100 | #308 | Tragic 80.0% |
| Potawatomi | 0.0 /100 | #309 | Tragic 80.0% |
| Inupiat | 0.0 /100 | #310 | Tragic 79.9% |
| Mexicans | 0.0 /100 | #311 | Tragic 79.8% |
Demographics Similar to Czechs by In Labor Force | Age 45-54
In terms of in labor force | age 45-54, the demographic groups most similar to Czechs are Immigrants from Eastern Africa (83.9%, a difference of 0.010%), Immigrants from Sri Lanka (83.9%, a difference of 0.010%), Immigrants from Ireland (83.9%, a difference of 0.010%), Tlingit-Haida (83.9%, a difference of 0.020%), and Slovene (83.9%, a difference of 0.030%).
| Demographics | Rating | Rank | In Labor Force | Age 45-54 |
| Bulgarians | 100.0 /100 | #12 | Exceptional 84.2% |
| Chinese | 99.9 /100 | #13 | Exceptional 84.1% |
| Cambodians | 99.9 /100 | #14 | Exceptional 84.1% |
| Cypriots | 99.9 /100 | #15 | Exceptional 84.1% |
| Immigrants | Nepal | 99.9 /100 | #16 | Exceptional 84.0% |
| Zimbabweans | 99.9 /100 | #17 | Exceptional 84.0% |
| Immigrants | South Central Asia | 99.9 /100 | #18 | Exceptional 84.0% |
| Czechs | 99.8 /100 | #19 | Exceptional 83.9% |
| Immigrants | Eastern Africa | 99.8 /100 | #20 | Exceptional 83.9% |
| Immigrants | Sri Lanka | 99.8 /100 | #21 | Exceptional 83.9% |
| Immigrants | Ireland | 99.8 /100 | #22 | Exceptional 83.9% |
| Tlingit-Haida | 99.8 /100 | #23 | Exceptional 83.9% |
| Slovenes | 99.8 /100 | #24 | Exceptional 83.9% |
| Immigrants | North Macedonia | 99.8 /100 | #25 | Exceptional 83.9% |
| Immigrants | Serbia | 99.8 /100 | #26 | Exceptional 83.9% |