Hawaiian vs Yaqui In Labor Force | Age 25-29
COMPARE
Hawaiian
Yaqui
In Labor Force | Age 25-29
In Labor Force | Age 25-29 Comparison
Hawaiians
Yaqui
83.0%
IN LABOR FORCE | AGE 25-29
0.0/ 100
METRIC RATING
291st/ 347
METRIC RANK
82.2%
IN LABOR FORCE | AGE 25-29
0.0/ 100
METRIC RATING
313th/ 347
METRIC RANK
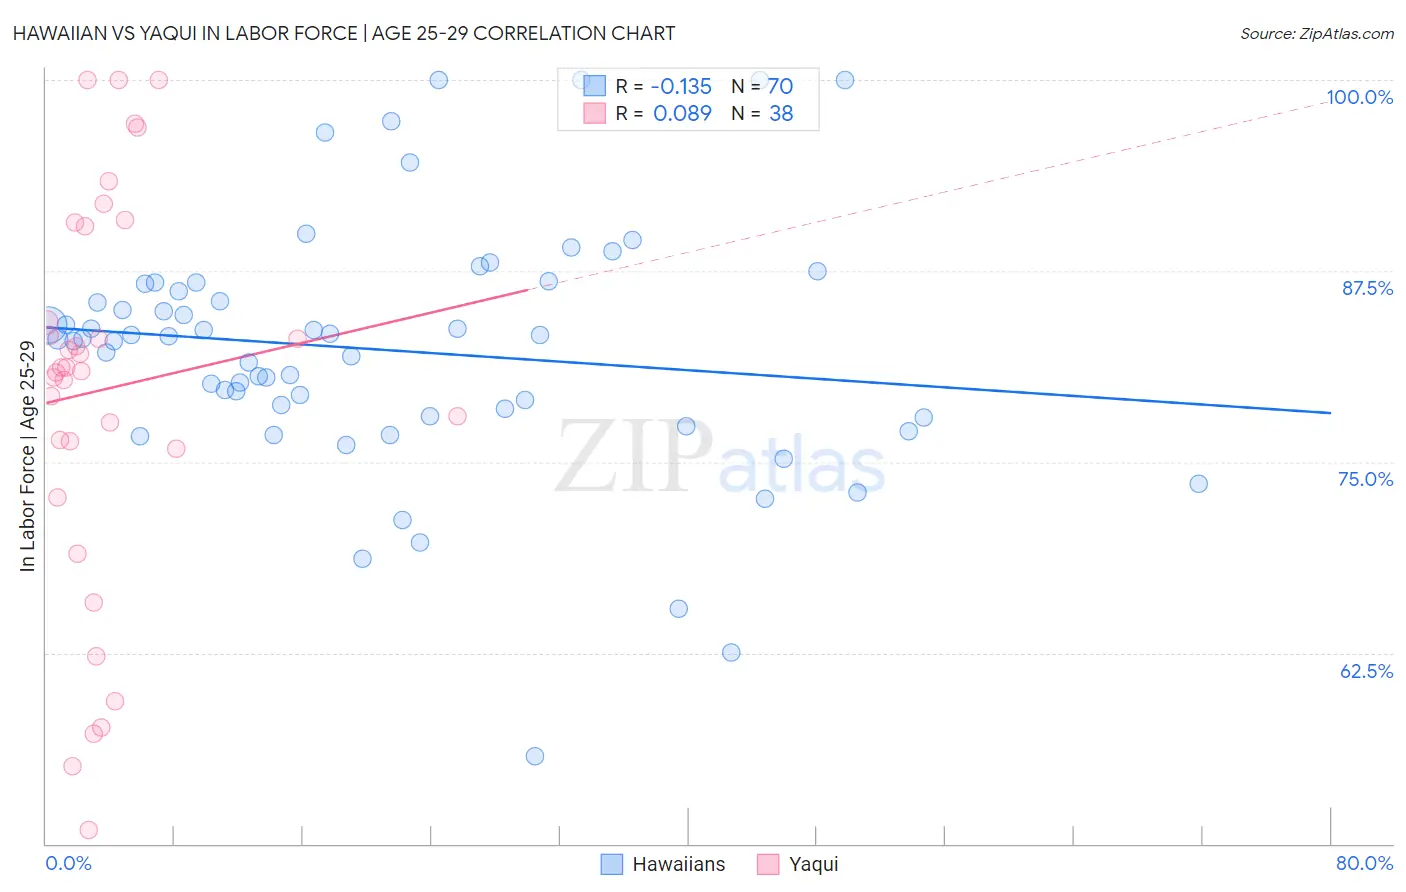
Hawaiian vs Yaqui In Labor Force | Age 25-29 Correlation Chart
The statistical analysis conducted on geographies consisting of 327,514,664 people shows a poor negative correlation between the proportion of Hawaiians and labor force participation rate among population between the ages 25 and 29 in the United States with a correlation coefficient (R) of -0.135 and weighted average of 83.0%. Similarly, the statistical analysis conducted on geographies consisting of 107,713,986 people shows a slight positive correlation between the proportion of Yaqui and labor force participation rate among population between the ages 25 and 29 in the United States with a correlation coefficient (R) of 0.089 and weighted average of 82.2%, a difference of 0.99%.
In Labor Force | Age 25-29 Correlation Summary
| Measurement | Hawaiian | Yaqui |
| Minimum | 55.7% | 50.9% |
| Maximum | 100.0% | 100.0% |
| Range | 44.3% | 49.1% |
| Mean | 82.3% | 79.7% |
| Median | 83.0% | 81.1% |
| Interquartile 25% (IQ1) | 78.0% | 75.9% |
| Interquartile 75% (IQ3) | 86.7% | 90.5% |
| Interquartile Range (IQR) | 8.7% | 14.6% |
| Standard Deviation (Sample) | 8.3% | 12.9% |
| Standard Deviation (Population) | 8.2% | 12.7% |
Similar Demographics by In Labor Force | Age 25-29
Demographics Similar to Hawaiians by In Labor Force | Age 25-29
In terms of in labor force | age 25-29, the demographic groups most similar to Hawaiians are Immigrants from Bangladesh (83.0%, a difference of 0.0%), Immigrants from Guyana (83.0%, a difference of 0.020%), Immigrants from Micronesia (83.0%, a difference of 0.030%), Immigrants from Latin America (82.9%, a difference of 0.050%), and Nepalese (82.9%, a difference of 0.050%).
| Demographics | Rating | Rank | In Labor Force | Age 25-29 |
| Nicaraguans | 0.0 /100 | #284 | Tragic 83.1% |
| Belizeans | 0.0 /100 | #285 | Tragic 83.1% |
| Mexican American Indians | 0.0 /100 | #286 | Tragic 83.0% |
| Guyanese | 0.0 /100 | #287 | Tragic 83.0% |
| Ottawa | 0.0 /100 | #288 | Tragic 83.0% |
| Immigrants | Micronesia | 0.0 /100 | #289 | Tragic 83.0% |
| Immigrants | Bangladesh | 0.0 /100 | #290 | Tragic 83.0% |
| Hawaiians | 0.0 /100 | #291 | Tragic 83.0% |
| Immigrants | Guyana | 0.0 /100 | #292 | Tragic 83.0% |
| Immigrants | Latin America | 0.0 /100 | #293 | Tragic 82.9% |
| Nepalese | 0.0 /100 | #294 | Tragic 82.9% |
| Chippewa | 0.0 /100 | #295 | Tragic 82.9% |
| Immigrants | Nicaragua | 0.0 /100 | #296 | Tragic 82.9% |
| Potawatomi | 0.0 /100 | #297 | Tragic 82.9% |
| Native Hawaiians | 0.0 /100 | #298 | Tragic 82.9% |
Demographics Similar to Yaqui by In Labor Force | Age 25-29
In terms of in labor force | age 25-29, the demographic groups most similar to Yaqui are Cherokee (82.1%, a difference of 0.050%), Hispanic or Latino (82.2%, a difference of 0.10%), Osage (82.3%, a difference of 0.17%), Alaskan Athabascan (82.3%, a difference of 0.17%), and Immigrants from Mexico (82.0%, a difference of 0.18%).
| Demographics | Rating | Rank | In Labor Force | Age 25-29 |
| Blackfeet | 0.0 /100 | #306 | Tragic 82.6% |
| Cajuns | 0.0 /100 | #307 | Tragic 82.5% |
| Central American Indians | 0.0 /100 | #308 | Tragic 82.4% |
| Immigrants | Central America | 0.0 /100 | #309 | Tragic 82.4% |
| Osage | 0.0 /100 | #310 | Tragic 82.3% |
| Alaskan Athabascans | 0.0 /100 | #311 | Tragic 82.3% |
| Hispanics or Latinos | 0.0 /100 | #312 | Tragic 82.2% |
| Yaqui | 0.0 /100 | #313 | Tragic 82.2% |
| Cherokee | 0.0 /100 | #314 | Tragic 82.1% |
| Immigrants | Mexico | 0.0 /100 | #315 | Tragic 82.0% |
| Mexicans | 0.0 /100 | #316 | Tragic 81.9% |
| Chickasaw | 0.0 /100 | #317 | Tragic 81.9% |
| Comanche | 0.0 /100 | #318 | Tragic 81.9% |
| Seminole | 0.0 /100 | #319 | Tragic 81.7% |
| Colville | 0.0 /100 | #320 | Tragic 81.6% |