Hawaiian vs Hmong In Labor Force | Age 16-19
COMPARE
Hawaiian
Hmong
In Labor Force | Age 16-19
In Labor Force | Age 16-19 Comparison
Hawaiians
Hmong
38.4%
IN LABOR FORCE | AGE 16-19
98.2/ 100
METRIC RATING
114th/ 347
METRIC RANK
38.7%
IN LABOR FORCE | AGE 16-19
99.1/ 100
METRIC RATING
101st/ 347
METRIC RANK
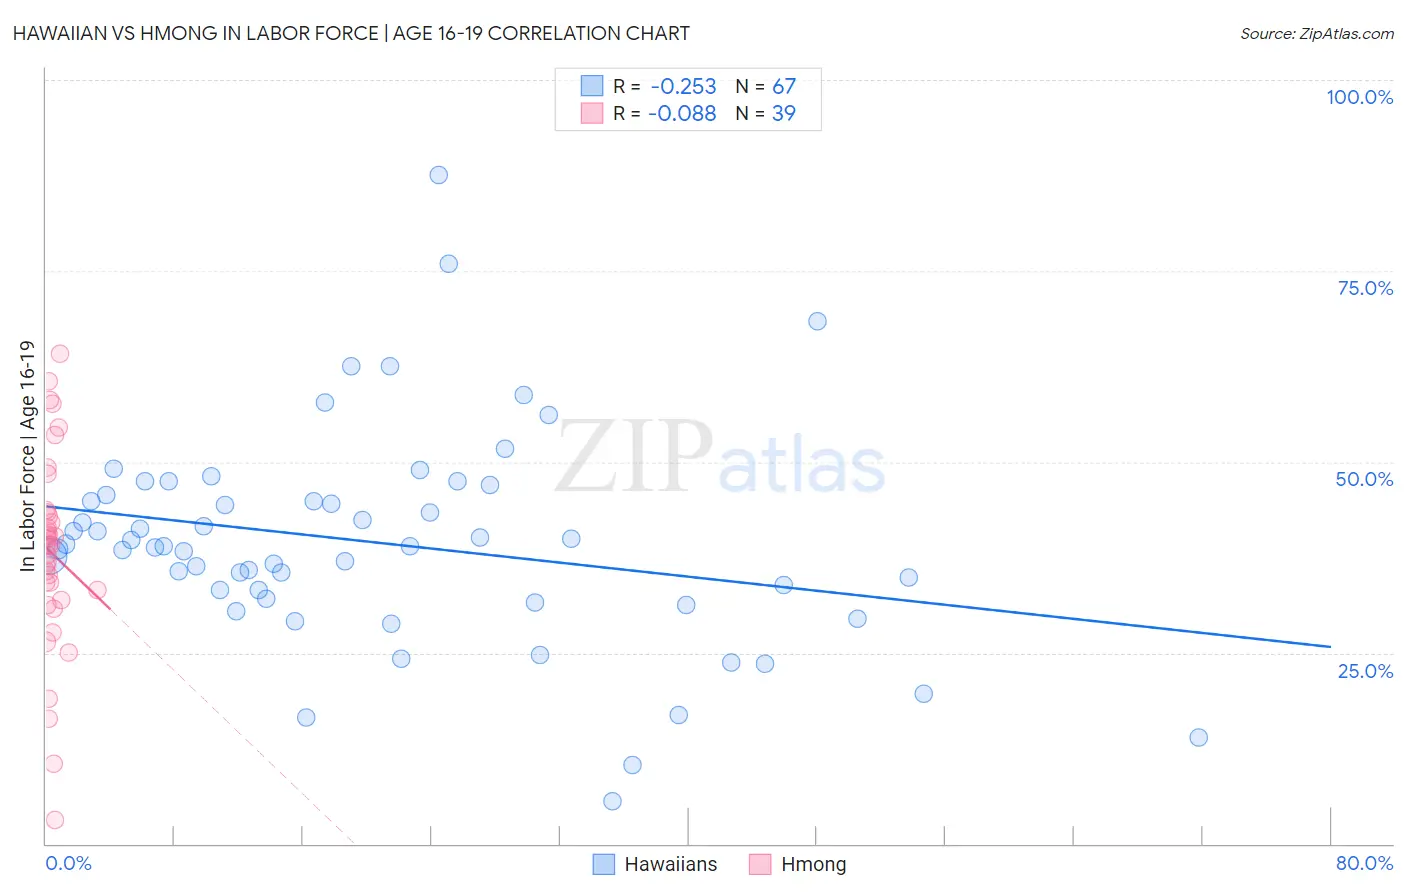
Hawaiian vs Hmong In Labor Force | Age 16-19 Correlation Chart
The statistical analysis conducted on geographies consisting of 327,147,423 people shows a weak negative correlation between the proportion of Hawaiians and labor force participation rate among population between the ages 16 and 19 in the United States with a correlation coefficient (R) of -0.253 and weighted average of 38.4%. Similarly, the statistical analysis conducted on geographies consisting of 24,681,034 people shows a slight negative correlation between the proportion of Hmong and labor force participation rate among population between the ages 16 and 19 in the United States with a correlation coefficient (R) of -0.088 and weighted average of 38.7%, a difference of 0.82%.
In Labor Force | Age 16-19 Correlation Summary
| Measurement | Hawaiian | Hmong |
| Minimum | 5.6% | 3.1% |
| Maximum | 87.5% | 64.2% |
| Range | 81.9% | 61.1% |
| Mean | 39.4% | 38.1% |
| Median | 38.9% | 39.1% |
| Interquartile 25% (IQ1) | 32.1% | 31.9% |
| Interquartile 75% (IQ3) | 45.6% | 43.4% |
| Interquartile Range (IQR) | 13.5% | 11.5% |
| Standard Deviation (Sample) | 14.1% | 12.9% |
| Standard Deviation (Population) | 14.0% | 12.7% |
Demographics Similar to Hawaiians and Hmong by In Labor Force | Age 16-19
In terms of in labor force | age 16-19, the demographic groups most similar to Hawaiians are Subsaharan African (38.4%, a difference of 0.10%), Bulgarian (38.3%, a difference of 0.15%), Colville (38.3%, a difference of 0.15%), Chickasaw (38.3%, a difference of 0.20%), and Immigrants from Scotland (38.5%, a difference of 0.23%). Similarly, the demographic groups most similar to Hmong are Zimbabwean (38.7%, a difference of 0.010%), Immigrants from Cameroon (38.7%, a difference of 0.040%), Immigrants from Thailand (38.7%, a difference of 0.070%), Immigrants from Eritrea (38.7%, a difference of 0.090%), and Iraqi (38.6%, a difference of 0.25%).
| Demographics | Rating | Rank | In Labor Force | Age 16-19 |
| Greeks | 99.3 /100 | #97 | Exceptional 38.9% |
| Ugandans | 99.3 /100 | #98 | Exceptional 38.9% |
| Immigrants | North Macedonia | 99.3 /100 | #99 | Exceptional 38.9% |
| Immigrants | Thailand | 99.1 /100 | #100 | Exceptional 38.7% |
| Hmong | 99.1 /100 | #101 | Exceptional 38.7% |
| Zimbabweans | 99.1 /100 | #102 | Exceptional 38.7% |
| Immigrants | Cameroon | 99.0 /100 | #103 | Exceptional 38.7% |
| Immigrants | Eritrea | 99.0 /100 | #104 | Exceptional 38.7% |
| Iraqis | 98.9 /100 | #105 | Exceptional 38.6% |
| Delaware | 98.8 /100 | #106 | Exceptional 38.6% |
| Chinese | 98.8 /100 | #107 | Exceptional 38.6% |
| Immigrants | Ethiopia | 98.7 /100 | #108 | Exceptional 38.6% |
| Lebanese | 98.7 /100 | #109 | Exceptional 38.6% |
| Maltese | 98.6 /100 | #110 | Exceptional 38.5% |
| Crow | 98.5 /100 | #111 | Exceptional 38.5% |
| Immigrants | Scotland | 98.5 /100 | #112 | Exceptional 38.5% |
| Sub-Saharan Africans | 98.3 /100 | #113 | Exceptional 38.4% |
| Hawaiians | 98.2 /100 | #114 | Exceptional 38.4% |
| Bulgarians | 97.9 /100 | #115 | Exceptional 38.3% |
| Colville | 97.9 /100 | #116 | Exceptional 38.3% |
| Chickasaw | 97.8 /100 | #117 | Exceptional 38.3% |