Haitian vs Immigrants from El Salvador In Labor Force | Age 20-64
COMPARE
Haitian
Immigrants from El Salvador
In Labor Force | Age 20-64
In Labor Force | Age 20-64 Comparison
Haitians
Immigrants from El Salvador
79.3%
IN LABOR FORCE | AGE 20-64
16.1/ 100
METRIC RATING
210th/ 347
METRIC RANK
79.4%
IN LABOR FORCE | AGE 20-64
30.9/ 100
METRIC RATING
189th/ 347
METRIC RANK
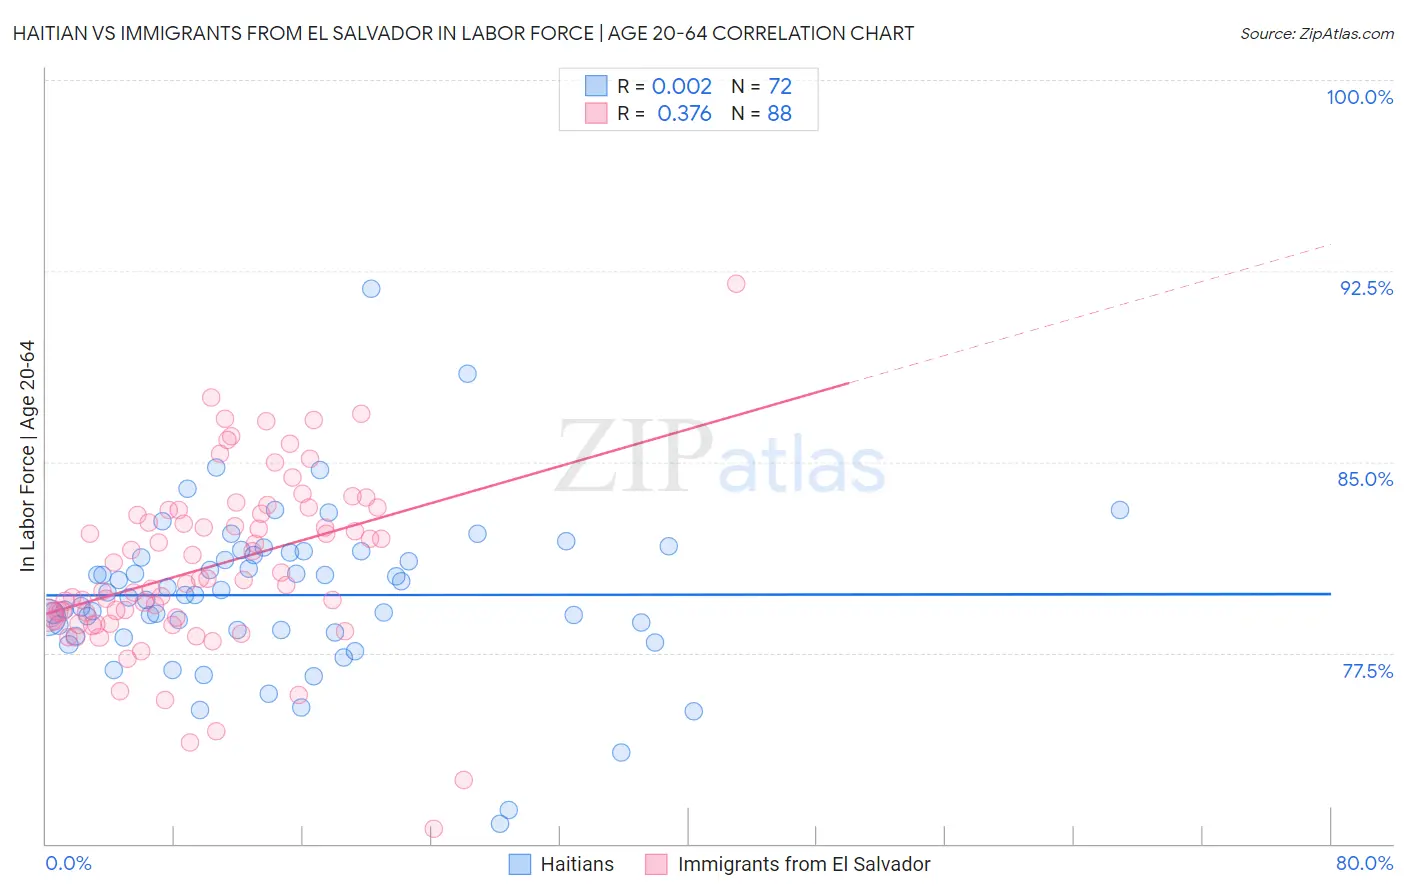
Haitian vs Immigrants from El Salvador In Labor Force | Age 20-64 Correlation Chart
The statistical analysis conducted on geographies consisting of 288,005,599 people shows no correlation between the proportion of Haitians and labor force participation rate among population between the ages 20 and 64 in the United States with a correlation coefficient (R) of 0.002 and weighted average of 79.3%. Similarly, the statistical analysis conducted on geographies consisting of 357,792,299 people shows a mild positive correlation between the proportion of Immigrants from El Salvador and labor force participation rate among population between the ages 20 and 64 in the United States with a correlation coefficient (R) of 0.376 and weighted average of 79.4%, a difference of 0.17%.
In Labor Force | Age 20-64 Correlation Summary
| Measurement | Haitian | Immigrants from El Salvador |
| Minimum | 70.8% | 70.6% |
| Maximum | 91.8% | 92.0% |
| Range | 21.0% | 21.4% |
| Mean | 79.8% | 80.9% |
| Median | 79.8% | 80.4% |
| Interquartile 25% (IQ1) | 78.3% | 78.8% |
| Interquartile 75% (IQ3) | 81.4% | 83.0% |
| Interquartile Range (IQR) | 3.1% | 4.2% |
| Standard Deviation (Sample) | 3.2% | 3.4% |
| Standard Deviation (Population) | 3.2% | 3.4% |
Similar Demographics by In Labor Force | Age 20-64
Demographics Similar to Haitians by In Labor Force | Age 20-64
In terms of in labor force | age 20-64, the demographic groups most similar to Haitians are Bangladeshi (79.3%, a difference of 0.0%), Immigrants from Ecuador (79.3%, a difference of 0.010%), Subsaharan African (79.3%, a difference of 0.010%), British (79.3%, a difference of 0.010%), and European (79.3%, a difference of 0.010%).
| Demographics | Rating | Rank | In Labor Force | Age 20-64 |
| Iraqis | 17.7 /100 | #203 | Poor 79.3% |
| Immigrants | Cambodia | 17.6 /100 | #204 | Poor 79.3% |
| Immigrants | Congo | 17.5 /100 | #205 | Poor 79.3% |
| Immigrants | Ecuador | 16.9 /100 | #206 | Poor 79.3% |
| Sub-Saharan Africans | 16.5 /100 | #207 | Poor 79.3% |
| British | 16.5 /100 | #208 | Poor 79.3% |
| Bangladeshis | 16.4 /100 | #209 | Poor 79.3% |
| Haitians | 16.1 /100 | #210 | Poor 79.3% |
| Europeans | 15.3 /100 | #211 | Poor 79.3% |
| Irish | 13.2 /100 | #212 | Poor 79.3% |
| Immigrants | Portugal | 12.8 /100 | #213 | Poor 79.3% |
| Immigrants | Armenia | 12.2 /100 | #214 | Poor 79.2% |
| Immigrants | Norway | 12.0 /100 | #215 | Poor 79.2% |
| Arabs | 11.4 /100 | #216 | Poor 79.2% |
| Immigrants | Western Asia | 11.0 /100 | #217 | Poor 79.2% |
Demographics Similar to Immigrants from El Salvador by In Labor Force | Age 20-64
In terms of in labor force | age 20-64, the demographic groups most similar to Immigrants from El Salvador are Immigrants from Syria (79.4%, a difference of 0.0%), Immigrants from Haiti (79.4%, a difference of 0.010%), Assyrian/Chaldean/Syriac (79.4%, a difference of 0.020%), Swiss (79.4%, a difference of 0.020%), and Northern European (79.5%, a difference of 0.030%).
| Demographics | Rating | Rank | In Labor Force | Age 20-64 |
| Malaysians | 37.1 /100 | #182 | Fair 79.5% |
| Immigrants | Hungary | 36.8 /100 | #183 | Fair 79.5% |
| Finns | 35.9 /100 | #184 | Fair 79.5% |
| Israelis | 34.7 /100 | #185 | Fair 79.5% |
| Northern Europeans | 34.5 /100 | #186 | Fair 79.5% |
| Assyrians/Chaldeans/Syriacs | 33.3 /100 | #187 | Fair 79.4% |
| Immigrants | Haiti | 32.1 /100 | #188 | Fair 79.4% |
| Immigrants | El Salvador | 30.9 /100 | #189 | Fair 79.4% |
| Immigrants | Syria | 30.8 /100 | #190 | Fair 79.4% |
| Swiss | 28.9 /100 | #191 | Fair 79.4% |
| Immigrants | Denmark | 26.9 /100 | #192 | Fair 79.4% |
| Indonesians | 26.1 /100 | #193 | Fair 79.4% |
| Immigrants | Thailand | 24.8 /100 | #194 | Fair 79.4% |
| Immigrants | Austria | 23.7 /100 | #195 | Fair 79.4% |
| Ecuadorians | 23.1 /100 | #196 | Fair 79.4% |