Guyanese vs Immigrants from Spain In Labor Force | Age > 16

COMPARE

Guyanese
Race
Ancestry
AfghanAfricanAlaska NativeAlaskan AthabascanAlbanianAleutAlsatianAmericanApacheArabArapahoArgentineanArmenianAssyrian/Chaldean/SyriacAustralianAustrianBahamianBangladeshiBarbadianBasqueBelgianBelizeanBermudanBhutaneseBlackfeetBolivianBrazilianBritishBritish West IndianBulgarianBurmeseCajunCambodianCanadianCape VerdeanCarpatho RusynCelticCentral AmericanCentral American IndianCherokeeCheyenneChickasawChileanChineseChippewaChoctawColombianColvilleComancheCosta RicanCreeCreekCroatianCrowCubanCypriotCzechCzechoslovakianDanishDelawareDominicanDutchDutch West IndianEastern EuropeanEcuadorianEgyptianEnglishEstonianEthiopianEuropeanFijianFilipinoFinnishFrenchFrench American IndianFrench CanadianGermanGerman RussianGhanaianGreekGuamanian/ChamorroGuatemalanGuyaneseHaitianHmongHonduranHopiHoumaHungarianIcelanderIndian (Asian)IndonesianInupiatIranianIraqiIrishIroquoisIsraeliItalianJamaicanJapaneseJordanianKenyanKiowaKoreanLaotianLatvianLebaneseLiberianLithuanianLumbeeLuxembourgerMacedonianMalaysianMalteseMarshalleseMenomineeMexicanMexican American IndianMongolianMoroccanNative HawaiianNavajoNepaleseNew ZealanderNicaraguanNigerianNorthern EuropeanNorwegianOkinawanOsageOttawaPaiutePakistaniPalestinianPanamanianParaguayanPennsylvania GermanPeruvianPimaPolishPortuguesePotawatomiPuebloPuerto RicanPuget Sound SalishRomanianRussianSalvadoranSamoanScandinavianScotch-IrishScottishSeminoleSenegaleseSerbianShoshoneSierra LeoneanSiouxSlavicSlovakSloveneSomaliSouth AfricanSouth AmericanSouth American IndianSoviet UnionSpaniardSpanishSpanish AmericanSpanish American IndianSri LankanSubsaharan AfricanSudaneseSwedishSwissSyrianTaiwaneseThaiTlingit-HaidaTohono O'OdhamTonganTrinidadian and TobagonianTsimshianTurkishU.S. Virgin IslanderUgandanUkrainianUruguayanUteVenezuelanVietnameseWelshWest IndianYakamaYaquiYugoslavianYumanYup'ikZimbabwean
Immigration
NonimmigrantsImmigrantsAfghanistanAfricaAlbaniaArgentinaArmeniaAsiaAustraliaAustriaBahamasBangladeshBarbadosBelarusBelgiumBelizeBoliviaBosnia and HerzegovinaBrazilBulgariaBurma/MyanmarCabo VerdeCambodiaCameroonCanadaCaribbeanCentral AmericaChileChinaColombiaCongoCosta RicaCroatiaCubaCzechoslovakiaDenmarkDominicaDominican RepublicEastern AfricaEastern AsiaEastern EuropeEcuadorEgyptEl SalvadorEnglandEritreaEthiopiaEuropeFijiFranceGermanyGhanaGreeceGrenadaGuatemalaGuyanaHaitiHondurasHong KongHungaryIndiaIndonesiaIranIraqIrelandIsraelItalyJamaicaJapanJordanKazakhstanKenyaKoreaKuwaitLaosLatin AmericaLatviaLebanonLiberiaLithuaniaMalaysiaMexicoMicronesiaMiddle AfricaMoldovaMoroccoNepalNetherlandsNicaraguaNigeriaNorth AmericaNorth MacedoniaNorthern AfricaNorthern EuropeNorwayOceaniaPakistanPanamaPeruPhilippinesPolandPortugalRomaniaRussiaSaudi ArabiaScotlandSenegalSerbiaSierra LeoneSingaporeSomaliaSouth AfricaSouth AmericaSouth Central AsiaSouth Eastern AsiaSouthern EuropeSri LankaSt. Vincent and the GrenadinesSudanSwedenSwitzerlandSyriaTaiwanThailandTrinidad and TobagoTurkeyUgandaUkraineUruguayUzbekistanVenezuelaVietnamWest IndiesWestern AfricaWestern AsiaWestern EuropeYemenZaireZimbabweAzores
Immigrants from Spain
Race
Ancestry
AfghanAfricanAlaska NativeAlaskan AthabascanAlbanianAleutAlsatianAmericanApacheArabArapahoArgentineanArmenianAssyrian/Chaldean/SyriacAustralianAustrianBahamianBangladeshiBarbadianBasqueBelgianBelizeanBermudanBhutaneseBlackfeetBolivianBrazilianBritishBritish West IndianBulgarianBurmeseCajunCambodianCanadianCape VerdeanCarpatho RusynCelticCentral AmericanCentral American IndianCherokeeCheyenneChickasawChileanChineseChippewaChoctawColombianColvilleComancheCosta RicanCreeCreekCroatianCrowCubanCypriotCzechCzechoslovakianDanishDelawareDominicanDutchDutch West IndianEastern EuropeanEcuadorianEgyptianEnglishEstonianEthiopianEuropeanFijianFilipinoFinnishFrenchFrench American IndianFrench CanadianGermanGerman RussianGhanaianGreekGuamanian/ChamorroGuatemalanHaitianHmongHonduranHopiHoumaHungarianIcelanderIndian (Asian)IndonesianInupiatIranianIraqiIrishIroquoisIsraeliItalianJamaicanJapaneseJordanianKenyanKiowaKoreanLaotianLatvianLebaneseLiberianLithuanianLumbeeLuxembourgerMacedonianMalaysianMalteseMarshalleseMenomineeMexicanMexican American IndianMongolianMoroccanNative HawaiianNavajoNepaleseNew ZealanderNicaraguanNigerianNorthern EuropeanNorwegianOkinawanOsageOttawaPaiutePakistaniPalestinianPanamanianParaguayanPennsylvania GermanPeruvianPimaPolishPortuguesePotawatomiPuebloPuerto RicanPuget Sound SalishRomanianRussianSalvadoranSamoanScandinavianScotch-IrishScottishSeminoleSenegaleseSerbianShoshoneSierra LeoneanSiouxSlavicSlovakSloveneSomaliSouth AfricanSouth AmericanSouth American IndianSoviet UnionSpaniardSpanishSpanish AmericanSpanish American IndianSri LankanSubsaharan AfricanSudaneseSwedishSwissSyrianTaiwaneseThaiTlingit-HaidaTohono O'OdhamTonganTrinidadian and TobagonianTsimshianTurkishU.S. Virgin IslanderUgandanUkrainianUruguayanUteVenezuelanVietnameseWelshWest IndianYakamaYaquiYugoslavianYumanYup'ikZimbabwean
Immigration
NonimmigrantsImmigrantsAfghanistanAfricaAlbaniaArgentinaArmeniaAsiaAustraliaAustriaBahamasBangladeshBarbadosBelarusBelgiumBelizeBoliviaBosnia and HerzegovinaBrazilBulgariaBurma/MyanmarCabo VerdeCambodiaCameroonCanadaCaribbeanCentral AmericaChileChinaColombiaCongoCosta RicaCroatiaCubaCzechoslovakiaDenmarkDominicaDominican RepublicEastern AfricaEastern AsiaEastern EuropeEcuadorEgyptEl SalvadorEnglandEritreaEthiopiaEuropeFijiFranceGermanyGhanaGreeceGrenadaGuatemalaGuyanaHaitiHondurasHong KongHungaryIndiaIndonesiaIranIraqIrelandIsraelItalyJamaicaJapanJordanKazakhstanKenyaKoreaKuwaitLaosLatin AmericaLatviaLebanonLiberiaLithuaniaMalaysiaMexicoMicronesiaMiddle AfricaMoldovaMoroccoNepalNetherlandsNicaraguaNigeriaNorth AmericaNorth MacedoniaNorthern AfricaNorthern EuropeNorwayOceaniaPakistanPanamaPeruPhilippinesPolandPortugalRomaniaRussiaSaudi ArabiaScotlandSenegalSerbiaSierra LeoneSingaporeSomaliaSouth AfricaSouth AmericaSouth Central AsiaSouth Eastern AsiaSouthern EuropeSpainSri LankaSt. Vincent and the GrenadinesSudanSwedenSwitzerlandSyriaTaiwanThailandTrinidad and TobagoTurkeyUgandaUkraineUruguayUzbekistanVenezuelaVietnamWest IndiesWestern AfricaWestern AsiaWestern EuropeYemenZaireZimbabweAzores
In Labor Force | Age > 16
Income
Poverty
Unemployment
Labor Participation
Family Structure
Vehicle Availability
Education Level
Disability

In Labor Force | Age > 16 Comparison

Guyanese

Immigrants from Spain

Tragic
Exceptional
64.1%
IN LABOR FORCE | AGE > 16
0.4/ 100
METRIC RATING
270th/ 347
METRIC RANK
65.8%
IN LABOR FORCE | AGE > 16
98.0/ 100
METRIC RATING
108th/ 347
METRIC RANK

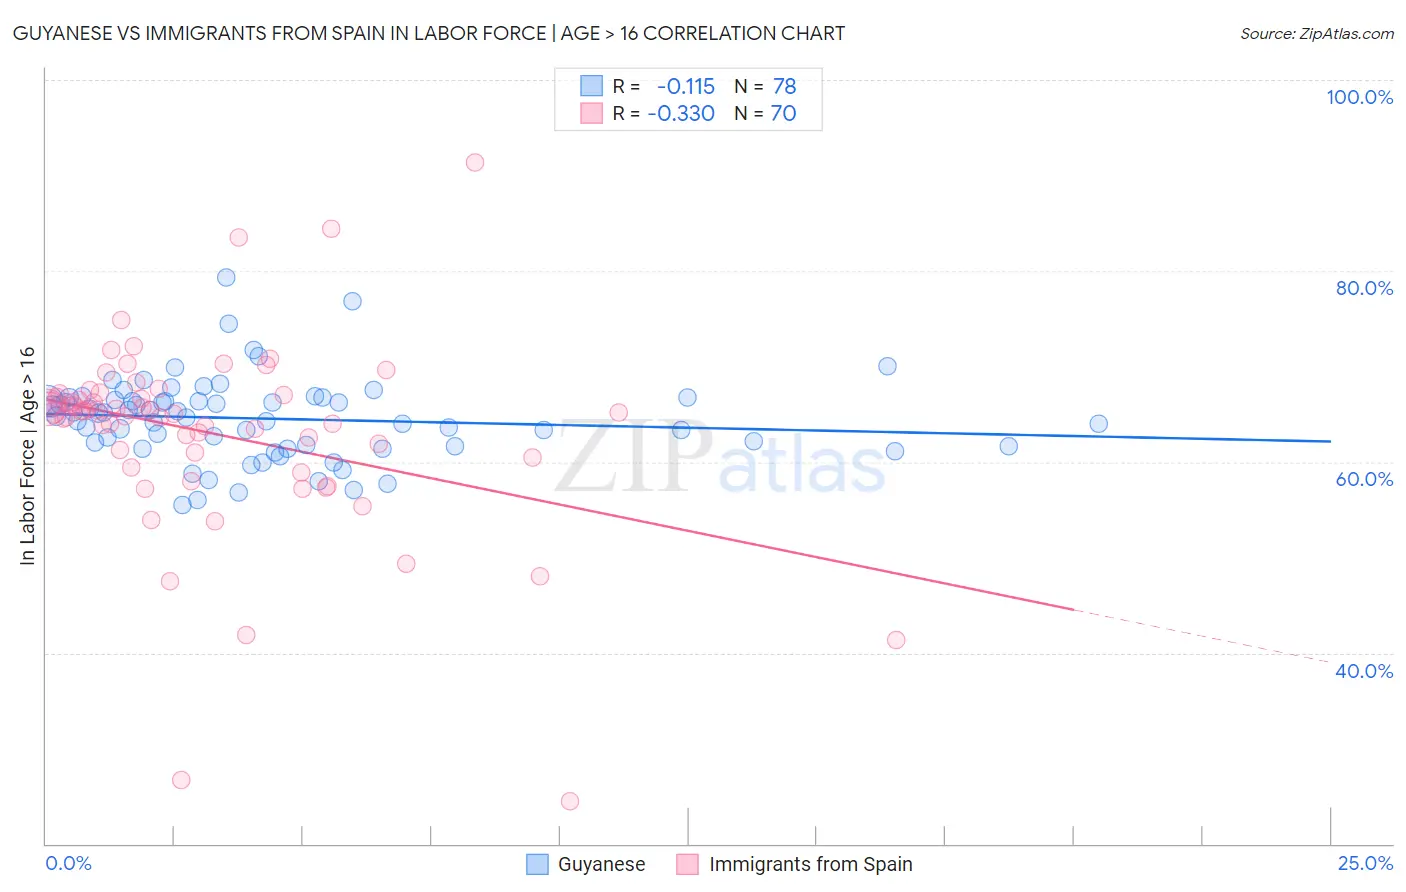
Guyanese vs Immigrants from Spain In Labor Force | Age > 16 Correlation Chart

The statistical analysis conducted on geographies consisting of 176,935,808 people shows a poor negative correlation between the proportion of Guyanese and labor force participation rate among population ages 16 and over in the United States with a correlation coefficient (R) of -0.115 and weighted average of 64.1%. Similarly, the statistical analysis conducted on geographies consisting of 239,685,016 people shows a mild negative correlation between the proportion of Immigrants from Spain and labor force participation rate among population ages 16 and over in the United States with a correlation coefficient (R) of -0.330 and weighted average of 65.8%, a difference of 2.7%.
Guyanese vs Immigrants from Spain In Labor Force | Age > 16

In Labor Force | Age > 16 Correlation Summary

MeasurementGuyaneseImmigrants from Spain
Minimum55.5%24.5%
Maximum79.3%91.3%
Range23.8%66.8%
Mean64.5%63.0%
Median64.9%65.2%
Interquartile 25% (IQ1)61.7%60.5%
Interquartile 75% (IQ3)66.5%67.0%
Interquartile Range (IQR)4.8%6.5%
Standard Deviation (Sample)4.3%10.3%
Standard Deviation (Population)4.3%10.3%

Similar Demographics by In Labor Force | Age > 16

Demographics Similar to Guyanese by In Labor Force | Age > 16

In terms of in labor force | age > 16, the demographic groups most similar to Guyanese are Dominican (64.1%, a difference of 0.0%), Irish (64.1%, a difference of 0.030%), Native Hawaiian (64.1%, a difference of 0.030%), Hmong (64.1%, a difference of 0.030%), and Immigrants from Cuba (64.1%, a difference of 0.050%).
DemographicsRating | RankIn Labor Force | Age > 16
Bahamians
0.6
/100
|
#263
Tragic
64.2%
Dutch
0.6
/100
|
#264
Tragic
64.2%
Cubans
0.5
/100
|
#265
Tragic
64.2%
Immigrants | England
0.5
/100
|
#266
Tragic
64.2%
Canadians
0.5
/100
|
#267
Tragic
64.1%
Spaniards
0.5
/100
|
#268
Tragic
64.1%
Irish
0.4
/100
|
#269
Tragic
64.1%
Guyanese
0.4
/100
|
#270
Tragic
64.1%
Dominicans
0.4
/100
|
#271
Tragic
64.1%
Native Hawaiians
0.3
/100
|
#272
Tragic
64.1%
Hmong
0.3
/100
|
#273
Tragic
64.1%
Immigrants | Cuba
0.3
/100
|
#274
Tragic
64.1%
Mexicans
0.3
/100
|
#275
Tragic
64.1%
French American Indians
0.3
/100
|
#276
Tragic
64.1%
Immigrants | Bahamas
0.3
/100
|
#277
Tragic
64.0%

Demographics Similar to Immigrants from Spain by In Labor Force | Age > 16

In terms of in labor force | age > 16, the demographic groups most similar to Immigrants from Spain are Immigrants from Japan (65.8%, a difference of 0.0%), Immigrants from Poland (65.8%, a difference of 0.010%), Immigrants from Serbia (65.8%, a difference of 0.020%), Japanese (65.8%, a difference of 0.040%), and Colombian (65.9%, a difference of 0.060%).
DemographicsRating | RankIn Labor Force | Age > 16
Immigrants | Colombia
98.6
/100
|
#101
Exceptional
65.9%
Uruguayans
98.6
/100
|
#102
Exceptional
65.9%
Immigrants | South Eastern Asia
98.5
/100
|
#103
Exceptional
65.9%
Palestinians
98.5
/100
|
#104
Exceptional
65.9%
Colombians
98.4
/100
|
#105
Exceptional
65.9%
Immigrants | Serbia
98.1
/100
|
#106
Exceptional
65.8%
Immigrants | Poland
98.1
/100
|
#107
Exceptional
65.8%
Immigrants | Spain
98.0
/100
|
#108
Exceptional
65.8%
Immigrants | Japan
98.0
/100
|
#109
Exceptional
65.8%
Japanese
97.7
/100
|
#110
Exceptional
65.8%
Immigrants | Honduras
97.5
/100
|
#111
Exceptional
65.8%
Laotians
97.4
/100
|
#112
Exceptional
65.8%
Pakistanis
97.1
/100
|
#113
Exceptional
65.8%
Hondurans
97.1
/100
|
#114
Exceptional
65.8%
Immigrants | Indonesia
96.8
/100
|
#115
Exceptional
65.7%