Guyanese vs Cajun In Labor Force | Age 20-64
COMPARE
Guyanese
Cajun
In Labor Force | Age 20-64
In Labor Force | Age 20-64 Comparison
Guyanese
Cajuns
78.1%
IN LABOR FORCE | AGE 20-64
0.0/ 100
METRIC RATING
281st/ 347
METRIC RANK
75.5%
IN LABOR FORCE | AGE 20-64
0.0/ 100
METRIC RATING
323rd/ 347
METRIC RANK
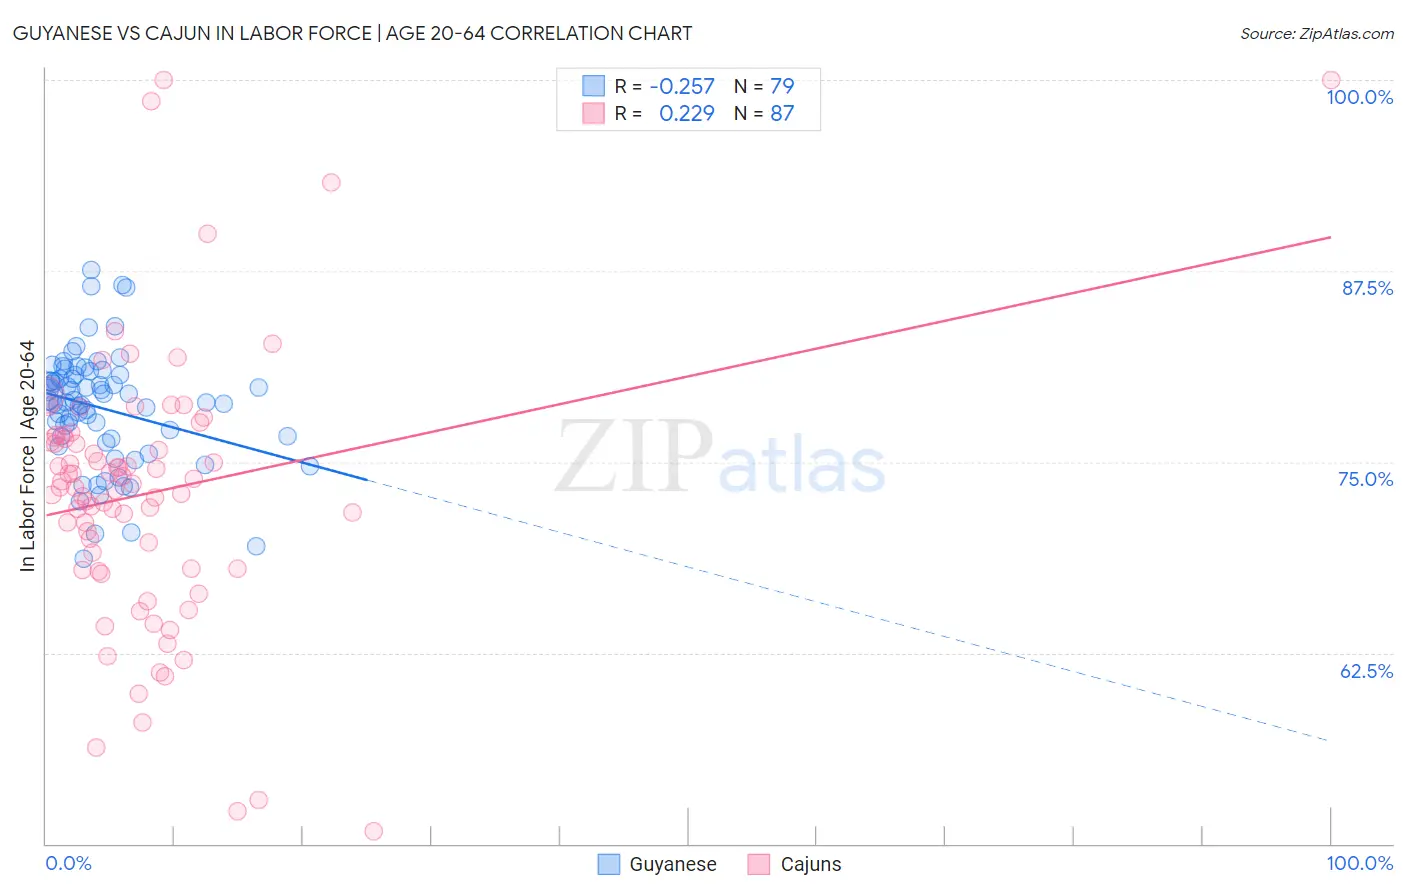
Guyanese vs Cajun In Labor Force | Age 20-64 Correlation Chart
The statistical analysis conducted on geographies consisting of 176,938,027 people shows a weak negative correlation between the proportion of Guyanese and labor force participation rate among population between the ages 20 and 64 in the United States with a correlation coefficient (R) of -0.257 and weighted average of 78.1%. Similarly, the statistical analysis conducted on geographies consisting of 149,713,173 people shows a weak positive correlation between the proportion of Cajuns and labor force participation rate among population between the ages 20 and 64 in the United States with a correlation coefficient (R) of 0.229 and weighted average of 75.5%, a difference of 3.5%.
In Labor Force | Age 20-64 Correlation Summary
| Measurement | Guyanese | Cajun |
| Minimum | 68.6% | 50.8% |
| Maximum | 87.6% | 100.0% |
| Range | 19.0% | 49.2% |
| Mean | 78.5% | 72.9% |
| Median | 78.9% | 73.4% |
| Interquartile 25% (IQ1) | 76.5% | 68.0% |
| Interquartile 75% (IQ3) | 80.7% | 76.6% |
| Interquartile Range (IQR) | 4.1% | 8.6% |
| Standard Deviation (Sample) | 3.8% | 9.0% |
| Standard Deviation (Population) | 3.7% | 8.9% |
Similar Demographics by In Labor Force | Age 20-64
Demographics Similar to Guyanese by In Labor Force | Age 20-64
In terms of in labor force | age 20-64, the demographic groups most similar to Guyanese are Immigrants from St. Vincent and the Grenadines (78.1%, a difference of 0.020%), Immigrants from Dominica (78.1%, a difference of 0.030%), Nonimmigrants (78.1%, a difference of 0.030%), Immigrants from Guyana (78.1%, a difference of 0.050%), and Belizean (78.2%, a difference of 0.070%).
| Demographics | Rating | Rank | In Labor Force | Age 20-64 |
| Aleuts | 0.0 /100 | #274 | Tragic 78.2% |
| Spanish | 0.0 /100 | #275 | Tragic 78.2% |
| Puget Sound Salish | 0.0 /100 | #276 | Tragic 78.2% |
| Immigrants | Bahamas | 0.0 /100 | #277 | Tragic 78.2% |
| Mexican American Indians | 0.0 /100 | #278 | Tragic 78.2% |
| Belizeans | 0.0 /100 | #279 | Tragic 78.2% |
| Immigrants | Dominica | 0.0 /100 | #280 | Tragic 78.1% |
| Guyanese | 0.0 /100 | #281 | Tragic 78.1% |
| Immigrants | St. Vincent and the Grenadines | 0.0 /100 | #282 | Tragic 78.1% |
| Immigrants | Nonimmigrants | 0.0 /100 | #283 | Tragic 78.1% |
| Immigrants | Guyana | 0.0 /100 | #284 | Tragic 78.1% |
| Osage | 0.0 /100 | #285 | Tragic 78.0% |
| Immigrants | Belize | 0.0 /100 | #286 | Tragic 78.0% |
| Vietnamese | 0.0 /100 | #287 | Tragic 78.0% |
| Hmong | 0.0 /100 | #288 | Tragic 77.9% |
Demographics Similar to Cajuns by In Labor Force | Age 20-64
In terms of in labor force | age 20-64, the demographic groups most similar to Cajuns are Dutch West Indian (75.5%, a difference of 0.040%), Choctaw (75.4%, a difference of 0.060%), Seminole (75.5%, a difference of 0.090%), Menominee (75.3%, a difference of 0.19%), and Creek (75.1%, a difference of 0.42%).
| Demographics | Rating | Rank | In Labor Force | Age 20-64 |
| Yaqui | 0.0 /100 | #316 | Tragic 76.5% |
| Cherokee | 0.0 /100 | #317 | Tragic 76.2% |
| Chickasaw | 0.0 /100 | #318 | Tragic 76.2% |
| Inupiat | 0.0 /100 | #319 | Tragic 76.1% |
| Yakama | 0.0 /100 | #320 | Tragic 75.8% |
| Seminole | 0.0 /100 | #321 | Tragic 75.5% |
| Dutch West Indians | 0.0 /100 | #322 | Tragic 75.5% |
| Cajuns | 0.0 /100 | #323 | Tragic 75.5% |
| Choctaw | 0.0 /100 | #324 | Tragic 75.4% |
| Menominee | 0.0 /100 | #325 | Tragic 75.3% |
| Creek | 0.0 /100 | #326 | Tragic 75.1% |
| Sioux | 0.0 /100 | #327 | Tragic 75.0% |
| Kiowa | 0.0 /100 | #328 | Tragic 75.0% |
| Cheyenne | 0.0 /100 | #329 | Tragic 74.8% |
| Colville | 0.0 /100 | #330 | Tragic 74.8% |