Guamanian/Chamorro vs Finnish In Labor Force | Age 45-54
COMPARE
Guamanian/Chamorro
Finnish
In Labor Force | Age 45-54
In Labor Force | Age 45-54 Comparison
Guamanians/Chamorros
Finns
81.6%
IN LABOR FORCE | AGE 45-54
0.2/ 100
METRIC RATING
251st/ 347
METRIC RANK
83.1%
IN LABOR FORCE | AGE 45-54
83.3/ 100
METRIC RATING
131st/ 347
METRIC RANK
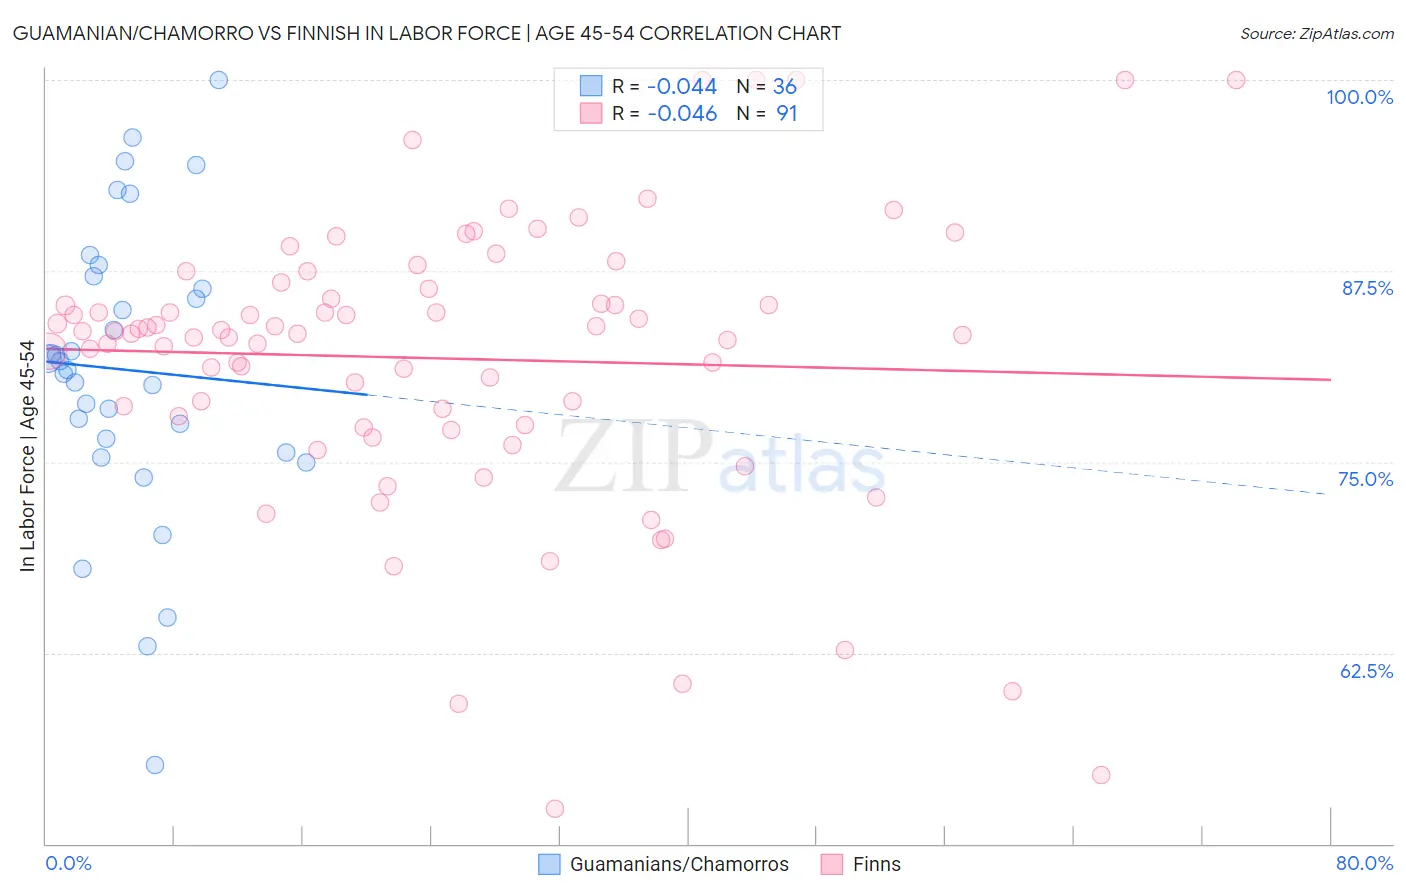
Guamanian/Chamorro vs Finnish In Labor Force | Age 45-54 Correlation Chart
The statistical analysis conducted on geographies consisting of 221,888,798 people shows no correlation between the proportion of Guamanians/Chamorros and labor force participation rate among population between the ages 45 and 54 in the United States with a correlation coefficient (R) of -0.044 and weighted average of 81.6%. Similarly, the statistical analysis conducted on geographies consisting of 404,469,956 people shows no correlation between the proportion of Finns and labor force participation rate among population between the ages 45 and 54 in the United States with a correlation coefficient (R) of -0.046 and weighted average of 83.1%, a difference of 1.7%.
In Labor Force | Age 45-54 Correlation Summary
| Measurement | Guamanian/Chamorro | Finnish |
| Minimum | 55.2% | 52.3% |
| Maximum | 100.0% | 100.0% |
| Range | 44.8% | 47.7% |
| Mean | 81.0% | 81.8% |
| Median | 81.3% | 83.4% |
| Interquartile 25% (IQ1) | 76.0% | 77.4% |
| Interquartile 75% (IQ3) | 86.7% | 86.4% |
| Interquartile Range (IQR) | 10.7% | 8.9% |
| Standard Deviation (Sample) | 9.6% | 9.4% |
| Standard Deviation (Population) | 9.4% | 9.3% |
Similar Demographics by In Labor Force | Age 45-54
Demographics Similar to Guamanians/Chamorros by In Labor Force | Age 45-54
In terms of in labor force | age 45-54, the demographic groups most similar to Guamanians/Chamorros are Immigrants from Armenia (81.7%, a difference of 0.020%), Pennsylvania German (81.6%, a difference of 0.020%), Japanese (81.6%, a difference of 0.040%), Immigrants from Laos (81.6%, a difference of 0.050%), and Scotch-Irish (81.6%, a difference of 0.060%).
| Demographics | Rating | Rank | In Labor Force | Age 45-54 |
| Celtics | 0.4 /100 | #244 | Tragic 81.8% |
| Alaska Natives | 0.4 /100 | #245 | Tragic 81.8% |
| Alaskan Athabascans | 0.4 /100 | #246 | Tragic 81.8% |
| Central Americans | 0.4 /100 | #247 | Tragic 81.7% |
| Puget Sound Salish | 0.3 /100 | #248 | Tragic 81.7% |
| Hmong | 0.3 /100 | #249 | Tragic 81.7% |
| Immigrants | Armenia | 0.2 /100 | #250 | Tragic 81.7% |
| Guamanians/Chamorros | 0.2 /100 | #251 | Tragic 81.6% |
| Pennsylvania Germans | 0.2 /100 | #252 | Tragic 81.6% |
| Japanese | 0.2 /100 | #253 | Tragic 81.6% |
| Immigrants | Laos | 0.2 /100 | #254 | Tragic 81.6% |
| Scotch-Irish | 0.2 /100 | #255 | Tragic 81.6% |
| Barbadians | 0.1 /100 | #256 | Tragic 81.6% |
| Immigrants | Congo | 0.1 /100 | #257 | Tragic 81.6% |
| Immigrants | Fiji | 0.1 /100 | #258 | Tragic 81.5% |
Demographics Similar to Finns by In Labor Force | Age 45-54
In terms of in labor force | age 45-54, the demographic groups most similar to Finns are Immigrants from Ukraine (83.0%, a difference of 0.010%), Liberian (83.0%, a difference of 0.010%), Immigrants from Israel (83.1%, a difference of 0.020%), Sudanese (83.0%, a difference of 0.020%), and Immigrants from Jordan (83.1%, a difference of 0.030%).
| Demographics | Rating | Rank | In Labor Force | Age 45-54 |
| Bermudans | 88.0 /100 | #124 | Excellent 83.1% |
| Immigrants | Iran | 87.2 /100 | #125 | Excellent 83.1% |
| Immigrants | Belgium | 86.4 /100 | #126 | Excellent 83.1% |
| Immigrants | Jordan | 85.2 /100 | #127 | Excellent 83.1% |
| Germans | 85.1 /100 | #128 | Excellent 83.1% |
| Immigrants | Northern Europe | 85.1 /100 | #129 | Excellent 83.1% |
| Immigrants | Israel | 84.7 /100 | #130 | Excellent 83.1% |
| Finns | 83.3 /100 | #131 | Excellent 83.1% |
| Immigrants | Ukraine | 82.9 /100 | #132 | Excellent 83.0% |
| Liberians | 82.7 /100 | #133 | Excellent 83.0% |
| Sudanese | 82.0 /100 | #134 | Excellent 83.0% |
| Austrians | 81.3 /100 | #135 | Excellent 83.0% |
| Immigrants | Kazakhstan | 81.0 /100 | #136 | Excellent 83.0% |
| Immigrants | Spain | 80.4 /100 | #137 | Excellent 83.0% |
| Ghanaians | 79.5 /100 | #138 | Good 83.0% |