German vs Potawatomi In Labor Force | Age 45-54

COMPARE

German
Race
Ancestry
AfghanAfricanAlaska NativeAlaskan AthabascanAlbanianAleutAlsatianAmericanApacheArabArapahoArgentineanArmenianAssyrian/Chaldean/SyriacAustralianAustrianBahamianBangladeshiBarbadianBasqueBelgianBelizeanBermudanBhutaneseBlackfeetBolivianBrazilianBritishBritish West IndianBulgarianBurmeseCajunCambodianCanadianCape VerdeanCarpatho RusynCelticCentral AmericanCentral American IndianCherokeeCheyenneChickasawChileanChineseChippewaChoctawColombianColvilleComancheCosta RicanCreeCreekCroatianCrowCubanCypriotCzechCzechoslovakianDanishDelawareDominicanDutchDutch West IndianEastern EuropeanEcuadorianEgyptianEnglishEstonianEthiopianEuropeanFijianFilipinoFinnishFrenchFrench American IndianFrench CanadianGermanGerman RussianGhanaianGreekGuamanian/ChamorroGuatemalanGuyaneseHaitianHmongHonduranHopiHoumaHungarianIcelanderIndian (Asian)IndonesianInupiatIranianIraqiIrishIroquoisIsraeliItalianJamaicanJapaneseJordanianKenyanKiowaKoreanLaotianLatvianLebaneseLiberianLithuanianLumbeeLuxembourgerMacedonianMalaysianMalteseMarshalleseMenomineeMexicanMexican American IndianMongolianMoroccanNative HawaiianNavajoNepaleseNew ZealanderNicaraguanNigerianNorthern EuropeanNorwegianOkinawanOsageOttawaPaiutePakistaniPalestinianPanamanianParaguayanPennsylvania GermanPeruvianPimaPolishPortuguesePuebloPuerto RicanPuget Sound SalishRomanianRussianSalvadoranSamoanScandinavianScotch-IrishScottishSeminoleSenegaleseSerbianShoshoneSierra LeoneanSiouxSlavicSlovakSloveneSomaliSouth AfricanSouth AmericanSouth American IndianSoviet UnionSpaniardSpanishSpanish AmericanSpanish American IndianSri LankanSubsaharan AfricanSudaneseSwedishSwissSyrianTaiwaneseThaiTlingit-HaidaTohono O'OdhamTonganTrinidadian and TobagonianTsimshianTurkishU.S. Virgin IslanderUgandanUkrainianUruguayanUteVenezuelanVietnameseWelshWest IndianYakamaYaquiYugoslavianYumanYup'ikZimbabwean
Immigration
NonimmigrantsImmigrantsAfghanistanAfricaAlbaniaArgentinaArmeniaAsiaAustraliaAustriaBahamasBangladeshBarbadosBelarusBelgiumBelizeBoliviaBosnia and HerzegovinaBrazilBulgariaBurma/MyanmarCabo VerdeCambodiaCameroonCanadaCaribbeanCentral AmericaChileChinaColombiaCongoCosta RicaCroatiaCubaCzechoslovakiaDenmarkDominicaDominican RepublicEastern AfricaEastern AsiaEastern EuropeEcuadorEgyptEl SalvadorEnglandEritreaEthiopiaEuropeFijiFranceGermanyGhanaGreeceGrenadaGuatemalaGuyanaHaitiHondurasHong KongHungaryIndiaIndonesiaIranIraqIrelandIsraelItalyJamaicaJapanJordanKazakhstanKenyaKoreaKuwaitLaosLatin AmericaLatviaLebanonLiberiaLithuaniaMalaysiaMexicoMicronesiaMiddle AfricaMoldovaMoroccoNepalNetherlandsNicaraguaNigeriaNorth AmericaNorth MacedoniaNorthern AfricaNorthern EuropeNorwayOceaniaPakistanPanamaPeruPhilippinesPolandPortugalRomaniaRussiaSaudi ArabiaScotlandSenegalSerbiaSierra LeoneSingaporeSomaliaSouth AfricaSouth AmericaSouth Central AsiaSouth Eastern AsiaSouthern EuropeSpainSri LankaSt. Vincent and the GrenadinesSudanSwedenSwitzerlandSyriaTaiwanThailandTrinidad and TobagoTurkeyUgandaUkraineUruguayUzbekistanVenezuelaVietnamWest IndiesWestern AfricaWestern AsiaWestern EuropeYemenZaireZimbabweAzores
Potawatomi
Race
Ancestry
AfghanAfricanAlaska NativeAlaskan AthabascanAlbanianAleutAlsatianAmericanApacheArabArapahoArgentineanArmenianAssyrian/Chaldean/SyriacAustralianAustrianBahamianBangladeshiBarbadianBasqueBelgianBelizeanBermudanBhutaneseBlackfeetBolivianBrazilianBritishBritish West IndianBulgarianBurmeseCajunCambodianCanadianCape VerdeanCarpatho RusynCelticCentral AmericanCentral American IndianCherokeeCheyenneChickasawChileanChineseChippewaChoctawColombianColvilleComancheCosta RicanCreeCreekCroatianCrowCubanCypriotCzechCzechoslovakianDanishDelawareDominicanDutchDutch West IndianEastern EuropeanEcuadorianEgyptianEnglishEstonianEthiopianEuropeanFijianFilipinoFinnishFrenchFrench American IndianFrench CanadianGerman RussianGhanaianGreekGuamanian/ChamorroGuatemalanGuyaneseHaitianHmongHonduranHopiHoumaHungarianIcelanderIndian (Asian)IndonesianInupiatIranianIraqiIrishIroquoisIsraeliItalianJamaicanJapaneseJordanianKenyanKiowaKoreanLaotianLatvianLebaneseLiberianLithuanianLumbeeLuxembourgerMacedonianMalaysianMalteseMarshalleseMenomineeMexicanMexican American IndianMongolianMoroccanNative HawaiianNavajoNepaleseNew ZealanderNicaraguanNigerianNorthern EuropeanNorwegianOkinawanOsageOttawaPaiutePakistaniPalestinianPanamanianParaguayanPennsylvania GermanPeruvianPimaPolishPortuguesePotawatomiPuebloPuerto RicanPuget Sound SalishRomanianRussianSalvadoranSamoanScandinavianScotch-IrishScottishSeminoleSenegaleseSerbianShoshoneSierra LeoneanSiouxSlavicSlovakSloveneSomaliSouth AfricanSouth AmericanSouth American IndianSoviet UnionSpaniardSpanishSpanish AmericanSpanish American IndianSri LankanSubsaharan AfricanSudaneseSwedishSwissSyrianTaiwaneseThaiTlingit-HaidaTohono O'OdhamTonganTrinidadian and TobagonianTsimshianTurkishU.S. Virgin IslanderUgandanUkrainianUruguayanUteVenezuelanVietnameseWelshWest IndianYakamaYaquiYugoslavianYumanYup'ikZimbabwean
Immigration
NonimmigrantsImmigrantsAfghanistanAfricaAlbaniaArgentinaArmeniaAsiaAustraliaAustriaBahamasBangladeshBarbadosBelarusBelgiumBelizeBoliviaBosnia and HerzegovinaBrazilBulgariaBurma/MyanmarCabo VerdeCambodiaCameroonCanadaCaribbeanCentral AmericaChileChinaColombiaCongoCosta RicaCroatiaCubaCzechoslovakiaDenmarkDominicaDominican RepublicEastern AfricaEastern AsiaEastern EuropeEcuadorEgyptEl SalvadorEnglandEritreaEthiopiaEuropeFijiFranceGermanyGhanaGreeceGrenadaGuatemalaGuyanaHaitiHondurasHong KongHungaryIndiaIndonesiaIranIraqIrelandIsraelItalyJamaicaJapanJordanKazakhstanKenyaKoreaKuwaitLaosLatin AmericaLatviaLebanonLiberiaLithuaniaMalaysiaMexicoMicronesiaMiddle AfricaMoldovaMoroccoNepalNetherlandsNicaraguaNigeriaNorth AmericaNorth MacedoniaNorthern AfricaNorthern EuropeNorwayOceaniaPakistanPanamaPeruPhilippinesPolandPortugalRomaniaRussiaSaudi ArabiaScotlandSenegalSerbiaSierra LeoneSingaporeSomaliaSouth AfricaSouth AmericaSouth Central AsiaSouth Eastern AsiaSouthern EuropeSpainSri LankaSt. Vincent and the GrenadinesSudanSwedenSwitzerlandSyriaTaiwanThailandTrinidad and TobagoTurkeyUgandaUkraineUruguayUzbekistanVenezuelaVietnamWest IndiesWestern AfricaWestern AsiaWestern EuropeYemenZaireZimbabweAzores
In Labor Force | Age 45-54
Income
Poverty
Unemployment
Labor Participation
Family Structure
Vehicle Availability
Education Level
Disability

In Labor Force | Age 45-54 Comparison

Germans

Potawatomi

Excellent
Tragic
83.1%
IN LABOR FORCE | AGE 45-54
85.1/ 100
METRIC RATING
128th/ 347
METRIC RANK
80.0%
IN LABOR FORCE | AGE 45-54
0.0/ 100
METRIC RATING
309th/ 347
METRIC RANK

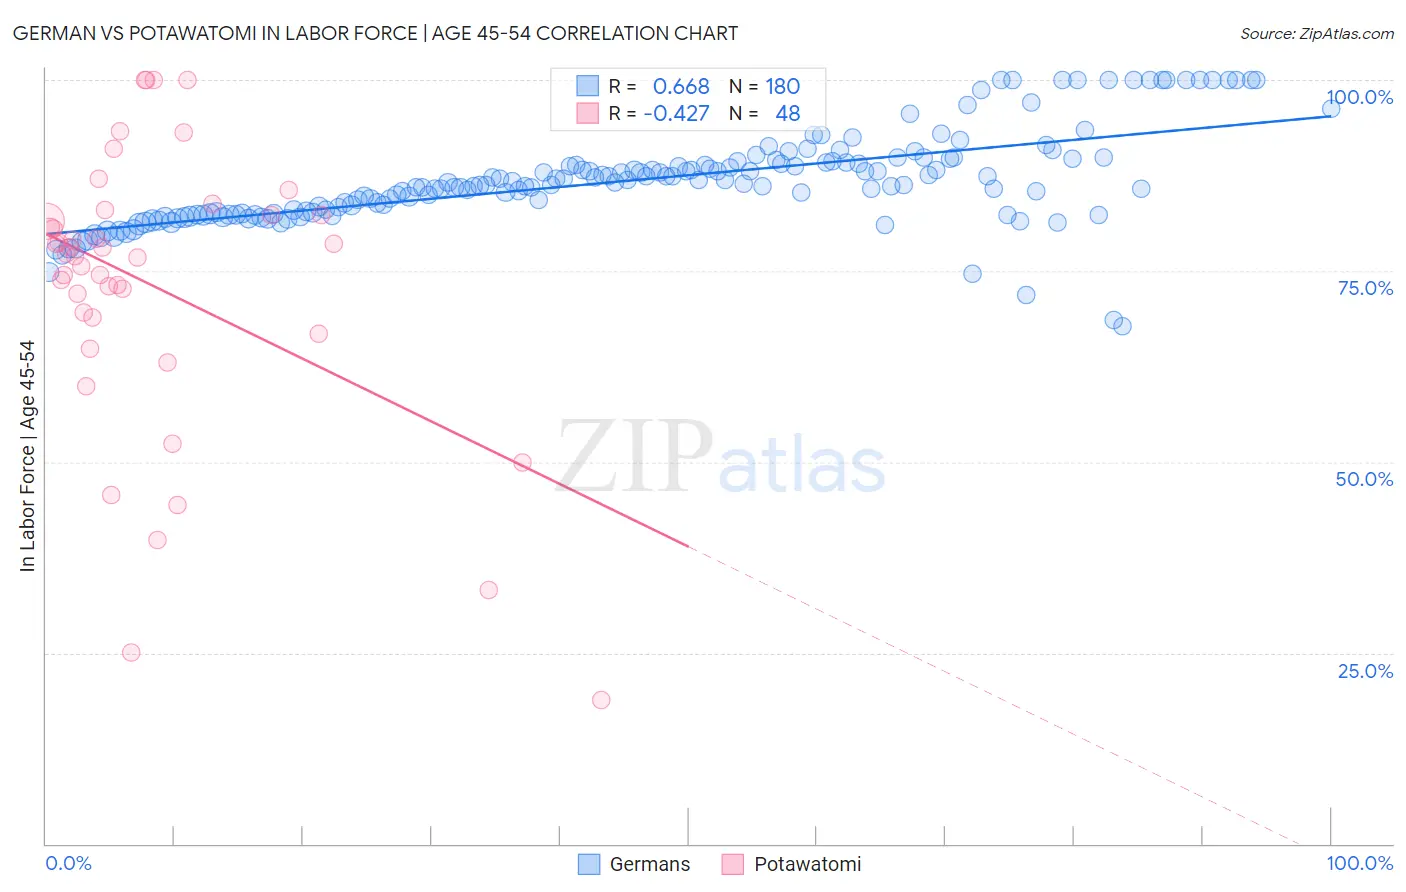
German vs Potawatomi In Labor Force | Age 45-54 Correlation Chart

The statistical analysis conducted on geographies consisting of 580,196,129 people shows a significant positive correlation between the proportion of Germans and labor force participation rate among population between the ages 45 and 54 in the United States with a correlation coefficient (R) of 0.668 and weighted average of 83.1%. Similarly, the statistical analysis conducted on geographies consisting of 117,759,317 people shows a moderate negative correlation between the proportion of Potawatomi and labor force participation rate among population between the ages 45 and 54 in the United States with a correlation coefficient (R) of -0.427 and weighted average of 80.0%, a difference of 3.9%.
German vs Potawatomi In Labor Force | Age 45-54

In Labor Force | Age 45-54 Correlation Summary

MeasurementGermanPotawatomi
Minimum67.7%18.8%
Maximum100.0%100.0%
Range32.3%81.2%
Mean86.8%72.9%
Median86.3%77.1%
Interquartile 25% (IQ1)82.4%67.9%
Interquartile 75% (IQ3)89.2%82.4%
Interquartile Range (IQR)6.7%14.5%
Standard Deviation (Sample)6.1%18.5%
Standard Deviation (Population)6.1%18.3%

Similar Demographics by In Labor Force | Age 45-54

Demographics Similar to Germans by In Labor Force | Age 45-54

In terms of in labor force | age 45-54, the demographic groups most similar to Germans are Immigrants from Jordan (83.1%, a difference of 0.0%), Immigrants from Northern Europe (83.1%, a difference of 0.0%), Immigrants from Israel (83.1%, a difference of 0.010%), Immigrants from Belgium (83.1%, a difference of 0.020%), and Finnish (83.1%, a difference of 0.030%).
DemographicsRating | RankIn Labor Force | Age 45-54
Uruguayans
89.4
/100
|
#121
Excellent
83.1%
Immigrants | Vietnam
88.9
/100
|
#122
Excellent
83.1%
Tongans
88.2
/100
|
#123
Excellent
83.1%
Bermudans
88.0
/100
|
#124
Excellent
83.1%
Immigrants | Iran
87.2
/100
|
#125
Excellent
83.1%
Immigrants | Belgium
86.4
/100
|
#126
Excellent
83.1%
Immigrants | Jordan
85.2
/100
|
#127
Excellent
83.1%
Germans
85.1
/100
|
#128
Excellent
83.1%
Immigrants | Northern Europe
85.1
/100
|
#129
Excellent
83.1%
Immigrants | Israel
84.7
/100
|
#130
Excellent
83.1%
Finns
83.3
/100
|
#131
Excellent
83.1%
Immigrants | Ukraine
82.9
/100
|
#132
Excellent
83.0%
Liberians
82.7
/100
|
#133
Excellent
83.0%
Sudanese
82.0
/100
|
#134
Excellent
83.0%
Austrians
81.3
/100
|
#135
Excellent
83.0%

Demographics Similar to Potawatomi by In Labor Force | Age 45-54

In terms of in labor force | age 45-54, the demographic groups most similar to Potawatomi are Central American Indian (80.0%, a difference of 0.030%), Blackfeet (80.0%, a difference of 0.070%), Inupiat (79.9%, a difference of 0.090%), Spanish American (80.1%, a difference of 0.14%), and Immigrants from Dominican Republic (80.1%, a difference of 0.18%).
DemographicsRating | RankIn Labor Force | Age 45-54
Immigrants | Central America
0.0
/100
|
#302
Tragic
80.2%
Immigrants | Azores
0.0
/100
|
#303
Tragic
80.1%
Hispanics or Latinos
0.0
/100
|
#304
Tragic
80.1%
Immigrants | Dominican Republic
0.0
/100
|
#305
Tragic
80.1%
Spanish Americans
0.0
/100
|
#306
Tragic
80.1%
Blackfeet
0.0
/100
|
#307
Tragic
80.0%
Central American Indians
0.0
/100
|
#308
Tragic
80.0%
Potawatomi
0.0
/100
|
#309
Tragic
80.0%
Inupiat
0.0
/100
|
#310
Tragic
79.9%
Mexicans
0.0
/100
|
#311
Tragic
79.8%
Immigrants | Mexico
0.0
/100
|
#312
Tragic
79.7%
Colville
0.0
/100
|
#313
Tragic
79.5%
Ottawa
0.0
/100
|
#314
Tragic
79.5%
Blacks/African Americans
0.0
/100
|
#315
Tragic
79.3%
Shoshone
0.0
/100
|
#316
Tragic
79.3%