German Russian vs Nepalese In Labor Force | Age 45-54
COMPARE
German Russian
Nepalese
In Labor Force | Age 45-54
In Labor Force | Age 45-54 Comparison
German Russians
Nepalese
82.8%
IN LABOR FORCE | AGE 45-54
61.3/ 100
METRIC RATING
164th/ 347
METRIC RANK
80.5%
IN LABOR FORCE | AGE 45-54
0.0/ 100
METRIC RATING
295th/ 347
METRIC RANK
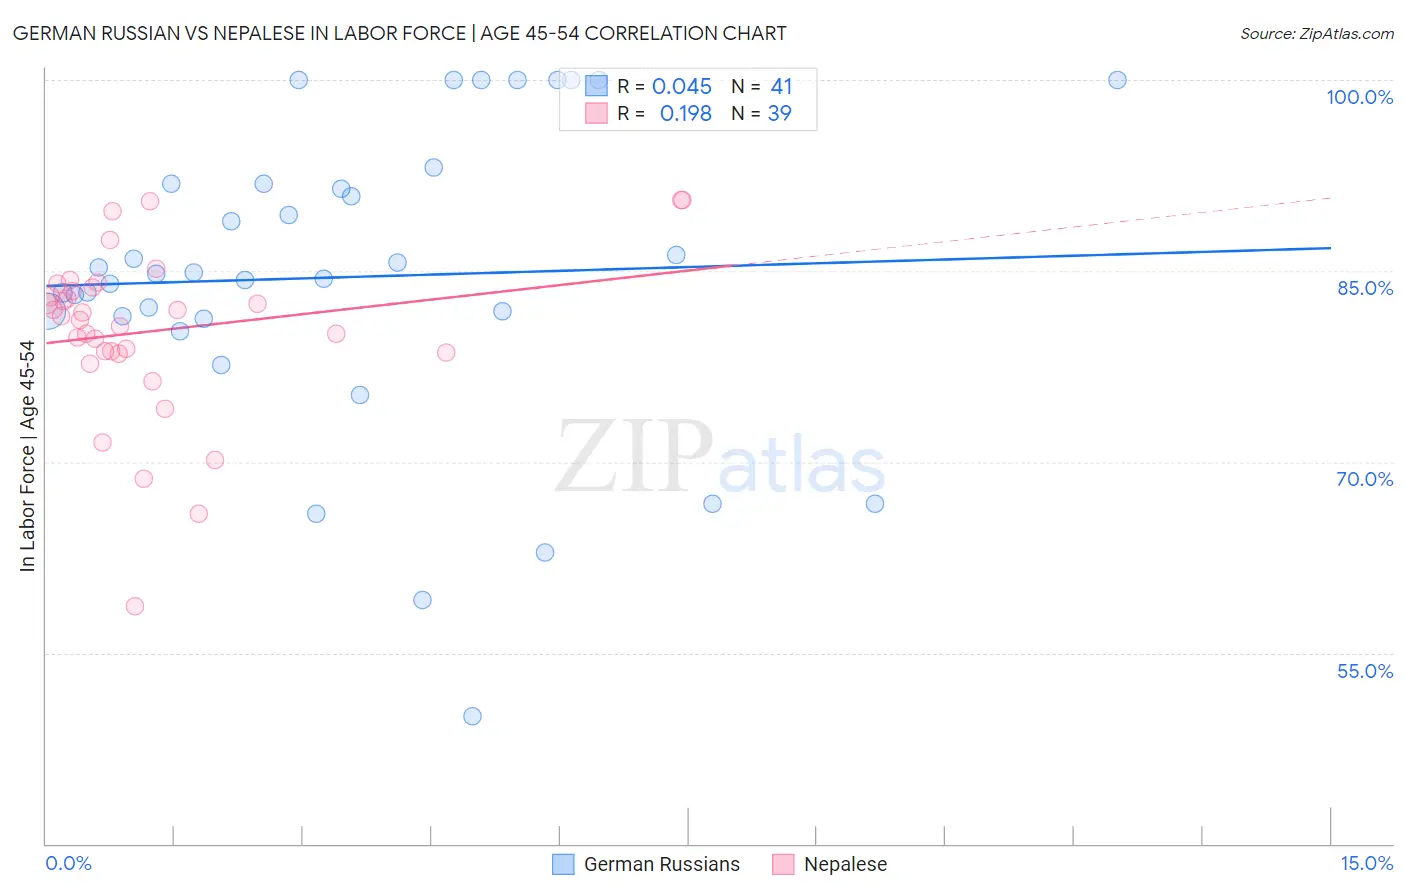
German Russian vs Nepalese In Labor Force | Age 45-54 Correlation Chart
The statistical analysis conducted on geographies consisting of 96,442,548 people shows no correlation between the proportion of German Russians and labor force participation rate among population between the ages 45 and 54 in the United States with a correlation coefficient (R) of 0.045 and weighted average of 82.8%. Similarly, the statistical analysis conducted on geographies consisting of 24,500,920 people shows a poor positive correlation between the proportion of Nepalese and labor force participation rate among population between the ages 45 and 54 in the United States with a correlation coefficient (R) of 0.198 and weighted average of 80.5%, a difference of 2.9%.
In Labor Force | Age 45-54 Correlation Summary
| Measurement | German Russian | Nepalese |
| Minimum | 50.0% | 58.7% |
| Maximum | 100.0% | 90.6% |
| Range | 50.0% | 31.9% |
| Mean | 84.5% | 80.3% |
| Median | 84.8% | 81.4% |
| Interquartile 25% (IQ1) | 81.4% | 78.6% |
| Interquartile 75% (IQ3) | 91.9% | 83.7% |
| Interquartile Range (IQR) | 10.5% | 5.1% |
| Standard Deviation (Sample) | 12.0% | 6.6% |
| Standard Deviation (Population) | 11.8% | 6.5% |
Similar Demographics by In Labor Force | Age 45-54
Demographics Similar to German Russians by In Labor Force | Age 45-54
In terms of in labor force | age 45-54, the demographic groups most similar to German Russians are Haitian (82.8%, a difference of 0.0%), Dutch (82.8%, a difference of 0.0%), Laotian (82.9%, a difference of 0.010%), South American Indian (82.9%, a difference of 0.010%), and Immigrants from Sudan (82.8%, a difference of 0.010%).
| Demographics | Rating | Rank | In Labor Force | Age 45-54 |
| Immigrants | Australia | 68.2 /100 | #157 | Good 82.9% |
| Immigrants | Southern Europe | 67.8 /100 | #158 | Good 82.9% |
| Immigrants | Austria | 64.6 /100 | #159 | Good 82.9% |
| Laotians | 62.8 /100 | #160 | Good 82.9% |
| South American Indians | 62.2 /100 | #161 | Good 82.9% |
| Haitians | 61.8 /100 | #162 | Good 82.8% |
| Dutch | 61.7 /100 | #163 | Good 82.8% |
| German Russians | 61.3 /100 | #164 | Good 82.8% |
| Immigrants | Sudan | 59.9 /100 | #165 | Average 82.8% |
| Immigrants | South Eastern Asia | 57.4 /100 | #166 | Average 82.8% |
| Swiss | 56.5 /100 | #167 | Average 82.8% |
| Immigrants | South Africa | 55.8 /100 | #168 | Average 82.8% |
| Immigrants | Western Africa | 54.1 /100 | #169 | Average 82.8% |
| Pakistanis | 53.2 /100 | #170 | Average 82.8% |
| Immigrants | Zaire | 52.9 /100 | #171 | Average 82.8% |
Demographics Similar to Nepalese by In Labor Force | Age 45-54
In terms of in labor force | age 45-54, the demographic groups most similar to Nepalese are African (80.5%, a difference of 0.040%), Osage (80.6%, a difference of 0.070%), Yakama (80.6%, a difference of 0.070%), Iroquois (80.6%, a difference of 0.090%), and Immigrants from Belize (80.6%, a difference of 0.12%).
| Demographics | Rating | Rank | In Labor Force | Age 45-54 |
| Cree | 0.0 /100 | #288 | Tragic 80.8% |
| Immigrants | Bangladesh | 0.0 /100 | #289 | Tragic 80.7% |
| Mexican American Indians | 0.0 /100 | #290 | Tragic 80.7% |
| Immigrants | Belize | 0.0 /100 | #291 | Tragic 80.6% |
| Iroquois | 0.0 /100 | #292 | Tragic 80.6% |
| Osage | 0.0 /100 | #293 | Tragic 80.6% |
| Yakama | 0.0 /100 | #294 | Tragic 80.6% |
| Nepalese | 0.0 /100 | #295 | Tragic 80.5% |
| Africans | 0.0 /100 | #296 | Tragic 80.5% |
| Americans | 0.0 /100 | #297 | Tragic 80.4% |
| Marshallese | 0.0 /100 | #298 | Tragic 80.3% |
| Dominicans | 0.0 /100 | #299 | Tragic 80.3% |
| Fijians | 0.0 /100 | #300 | Tragic 80.2% |
| Spanish American Indians | 0.0 /100 | #301 | Tragic 80.2% |
| Immigrants | Central America | 0.0 /100 | #302 | Tragic 80.2% |