French vs Immigrants from Jamaica In Labor Force | Age 20-24

COMPARE

French
Race
Ancestry
AfghanAfricanAlaska NativeAlaskan AthabascanAlbanianAleutAlsatianAmericanApacheArabArapahoArgentineanArmenianAssyrian/Chaldean/SyriacAustralianAustrianBahamianBangladeshiBarbadianBasqueBelgianBelizeanBermudanBhutaneseBlackfeetBolivianBrazilianBritishBritish West IndianBulgarianBurmeseCajunCambodianCanadianCape VerdeanCarpatho RusynCelticCentral AmericanCentral American IndianCherokeeCheyenneChickasawChileanChineseChippewaChoctawColombianColvilleComancheCosta RicanCreeCreekCroatianCrowCubanCypriotCzechCzechoslovakianDanishDelawareDominicanDutchDutch West IndianEastern EuropeanEcuadorianEgyptianEnglishEstonianEthiopianEuropeanFijianFilipinoFinnishFrenchFrench American IndianFrench CanadianGermanGerman RussianGhanaianGreekGuamanian/ChamorroGuatemalanGuyaneseHaitianHmongHonduranHopiHoumaHungarianIcelanderIndian (Asian)IndonesianInupiatIranianIraqiIrishIroquoisIsraeliItalianJamaicanJapaneseJordanianKenyanKiowaKoreanLaotianLatvianLebaneseLiberianLithuanianLumbeeLuxembourgerMacedonianMalaysianMalteseMarshalleseMenomineeMexicanMexican American IndianMongolianMoroccanNative HawaiianNavajoNepaleseNew ZealanderNicaraguanNigerianNorthern EuropeanNorwegianOkinawanOsageOttawaPaiutePakistaniPalestinianPanamanianParaguayanPennsylvania GermanPeruvianPimaPolishPortuguesePotawatomiPuebloPuerto RicanPuget Sound SalishRomanianRussianSalvadoranSamoanScandinavianScotch-IrishScottishSeminoleSenegaleseSerbianShoshoneSierra LeoneanSiouxSlavicSlovakSloveneSomaliSouth AfricanSouth AmericanSouth American IndianSoviet UnionSpaniardSpanishSpanish AmericanSpanish American IndianSri LankanSubsaharan AfricanSudaneseSwedishSwissSyrianTaiwaneseThaiTlingit-HaidaTohono O'OdhamTonganTrinidadian and TobagonianTsimshianTurkishU.S. Virgin IslanderUgandanUkrainianUruguayanUteVenezuelanVietnameseWelshWest IndianYakamaYaquiYugoslavianYumanYup'ikZimbabwean
Immigration
NonimmigrantsImmigrantsAfghanistanAfricaAlbaniaArgentinaArmeniaAsiaAustraliaAustriaBahamasBangladeshBarbadosBelarusBelgiumBelizeBoliviaBosnia and HerzegovinaBrazilBulgariaBurma/MyanmarCabo VerdeCambodiaCameroonCanadaCaribbeanCentral AmericaChileChinaColombiaCongoCosta RicaCroatiaCubaCzechoslovakiaDenmarkDominicaDominican RepublicEastern AfricaEastern AsiaEastern EuropeEcuadorEgyptEl SalvadorEnglandEritreaEthiopiaEuropeFijiFranceGermanyGhanaGreeceGrenadaGuatemalaGuyanaHaitiHondurasHong KongHungaryIndiaIndonesiaIranIraqIrelandIsraelItalyJapanJordanKazakhstanKenyaKoreaKuwaitLaosLatin AmericaLatviaLebanonLiberiaLithuaniaMalaysiaMexicoMicronesiaMiddle AfricaMoldovaMoroccoNepalNetherlandsNicaraguaNigeriaNorth AmericaNorth MacedoniaNorthern AfricaNorthern EuropeNorwayOceaniaPakistanPanamaPeruPhilippinesPolandPortugalRomaniaRussiaSaudi ArabiaScotlandSenegalSerbiaSierra LeoneSingaporeSomaliaSouth AfricaSouth AmericaSouth Central AsiaSouth Eastern AsiaSouthern EuropeSpainSri LankaSt. Vincent and the GrenadinesSudanSwedenSwitzerlandSyriaTaiwanThailandTrinidad and TobagoTurkeyUgandaUkraineUruguayUzbekistanVenezuelaVietnamWest IndiesWestern AfricaWestern AsiaWestern EuropeYemenZaireZimbabweAzores
Immigrants from Jamaica
Race
Ancestry
AfghanAfricanAlaska NativeAlaskan AthabascanAlbanianAleutAlsatianAmericanApacheArabArapahoArgentineanArmenianAssyrian/Chaldean/SyriacAustralianAustrianBahamianBangladeshiBarbadianBasqueBelgianBelizeanBermudanBhutaneseBlackfeetBolivianBrazilianBritishBritish West IndianBulgarianBurmeseCajunCambodianCanadianCape VerdeanCarpatho RusynCelticCentral AmericanCentral American IndianCherokeeCheyenneChickasawChileanChineseChippewaChoctawColombianColvilleComancheCosta RicanCreeCreekCroatianCrowCubanCypriotCzechCzechoslovakianDanishDelawareDominicanDutchDutch West IndianEastern EuropeanEcuadorianEgyptianEnglishEstonianEthiopianEuropeanFijianFilipinoFinnishFrench American IndianFrench CanadianGermanGerman RussianGhanaianGreekGuamanian/ChamorroGuatemalanGuyaneseHaitianHmongHonduranHopiHoumaHungarianIcelanderIndian (Asian)IndonesianInupiatIranianIraqiIrishIroquoisIsraeliItalianJamaicanJapaneseJordanianKenyanKiowaKoreanLaotianLatvianLebaneseLiberianLithuanianLumbeeLuxembourgerMacedonianMalaysianMalteseMarshalleseMenomineeMexicanMexican American IndianMongolianMoroccanNative HawaiianNavajoNepaleseNew ZealanderNicaraguanNigerianNorthern EuropeanNorwegianOkinawanOsageOttawaPaiutePakistaniPalestinianPanamanianParaguayanPennsylvania GermanPeruvianPimaPolishPortuguesePotawatomiPuebloPuerto RicanPuget Sound SalishRomanianRussianSalvadoranSamoanScandinavianScotch-IrishScottishSeminoleSenegaleseSerbianShoshoneSierra LeoneanSiouxSlavicSlovakSloveneSomaliSouth AfricanSouth AmericanSouth American IndianSoviet UnionSpaniardSpanishSpanish AmericanSpanish American IndianSri LankanSubsaharan AfricanSudaneseSwedishSwissSyrianTaiwaneseThaiTlingit-HaidaTohono O'OdhamTonganTrinidadian and TobagonianTsimshianTurkishU.S. Virgin IslanderUgandanUkrainianUruguayanUteVenezuelanVietnameseWelshWest IndianYakamaYaquiYugoslavianYumanYup'ikZimbabwean
Immigration
NonimmigrantsImmigrantsAfghanistanAfricaAlbaniaArgentinaArmeniaAsiaAustraliaAustriaBahamasBangladeshBarbadosBelarusBelgiumBelizeBoliviaBosnia and HerzegovinaBrazilBulgariaBurma/MyanmarCabo VerdeCambodiaCameroonCanadaCaribbeanCentral AmericaChileChinaColombiaCongoCosta RicaCroatiaCubaCzechoslovakiaDenmarkDominicaDominican RepublicEastern AfricaEastern AsiaEastern EuropeEcuadorEgyptEl SalvadorEnglandEritreaEthiopiaEuropeFijiFranceGermanyGhanaGreeceGrenadaGuatemalaGuyanaHaitiHondurasHong KongHungaryIndiaIndonesiaIranIraqIrelandIsraelItalyJamaicaJapanJordanKazakhstanKenyaKoreaKuwaitLaosLatin AmericaLatviaLebanonLiberiaLithuaniaMalaysiaMexicoMicronesiaMiddle AfricaMoldovaMoroccoNepalNetherlandsNicaraguaNigeriaNorth AmericaNorth MacedoniaNorthern AfricaNorthern EuropeNorwayOceaniaPakistanPanamaPeruPhilippinesPolandPortugalRomaniaRussiaSaudi ArabiaScotlandSenegalSerbiaSierra LeoneSingaporeSomaliaSouth AfricaSouth AmericaSouth Central AsiaSouth Eastern AsiaSouthern EuropeSpainSri LankaSt. Vincent and the GrenadinesSudanSwedenSwitzerlandSyriaTaiwanThailandTrinidad and TobagoTurkeyUgandaUkraineUruguayUzbekistanVenezuelaVietnamWest IndiesWestern AfricaWestern AsiaWestern EuropeYemenZaireZimbabweAzores
In Labor Force | Age 20-24
Income
Poverty
Unemployment
Labor Participation
Family Structure
Vehicle Availability
Education Level
Disability

In Labor Force | Age 20-24 Comparison

French

Immigrants from Jamaica

Exceptional
Tragic
77.4%
IN LABOR FORCE | AGE 20-24
100.0/ 100
METRIC RATING
42nd/ 347
METRIC RANK
72.4%
IN LABOR FORCE | AGE 20-24
0.0/ 100
METRIC RATING
306th/ 347
METRIC RANK

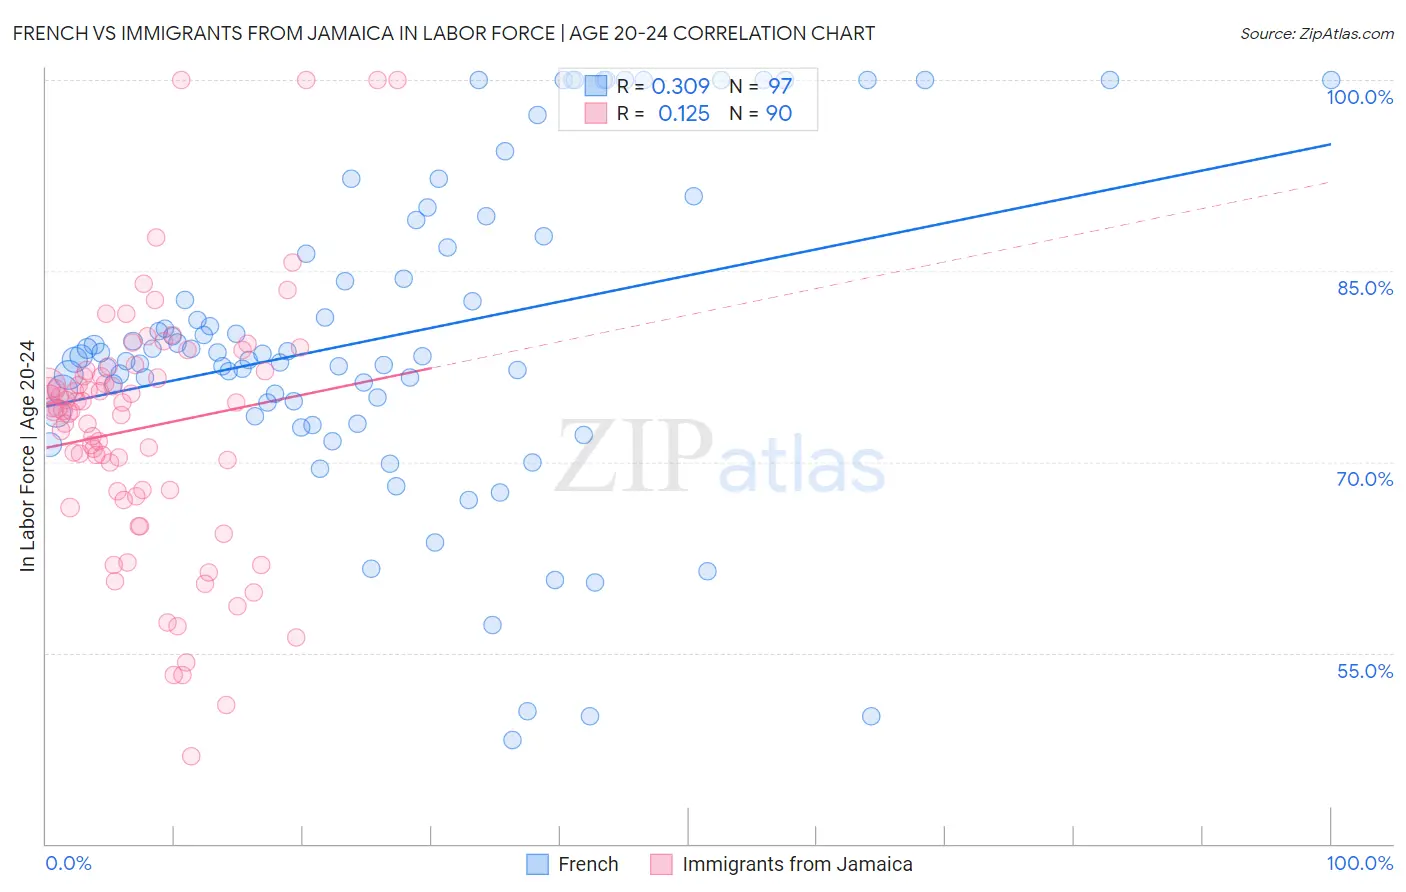
French vs Immigrants from Jamaica In Labor Force | Age 20-24 Correlation Chart

The statistical analysis conducted on geographies consisting of 570,874,940 people shows a mild positive correlation between the proportion of French and labor force participation rate among population between the ages 20 and 24 in the United States with a correlation coefficient (R) of 0.309 and weighted average of 77.4%. Similarly, the statistical analysis conducted on geographies consisting of 301,749,902 people shows a poor positive correlation between the proportion of Immigrants from Jamaica and labor force participation rate among population between the ages 20 and 24 in the United States with a correlation coefficient (R) of 0.125 and weighted average of 72.4%, a difference of 6.9%.
French vs Immigrants from Jamaica In Labor Force | Age 20-24

In Labor Force | Age 20-24 Correlation Summary

MeasurementFrenchImmigrants from Jamaica
Minimum48.2%46.9%
Maximum100.0%100.0%
Range51.8%53.1%
Mean79.8%72.7%
Median78.3%74.1%
Interquartile 25% (IQ1)74.2%67.7%
Interquartile 75% (IQ3)87.3%77.1%
Interquartile Range (IQR)13.0%9.4%
Standard Deviation (Sample)12.4%10.1%
Standard Deviation (Population)12.4%10.0%

Similar Demographics by In Labor Force | Age 20-24

Demographics Similar to French by In Labor Force | Age 20-24

In terms of in labor force | age 20-24, the demographic groups most similar to French are Immigrants from Laos (77.4%, a difference of 0.0%), Immigrants from Congo (77.4%, a difference of 0.010%), Fijian (77.4%, a difference of 0.020%), Scottish (77.4%, a difference of 0.030%), and Native Hawaiian (77.4%, a difference of 0.030%).
DemographicsRating | RankIn Labor Force | Age 20-24
Immigrants | Eastern Africa
100.0
/100
|
#35
Exceptional
77.5%
Welsh
100.0
/100
|
#36
Exceptional
77.5%
Czechoslovakians
100.0
/100
|
#37
Exceptional
77.5%
Marshallese
100.0
/100
|
#38
Exceptional
77.4%
Irish
100.0
/100
|
#39
Exceptional
77.4%
Scottish
100.0
/100
|
#40
Exceptional
77.4%
Immigrants | Congo
100.0
/100
|
#41
Exceptional
77.4%
French
100.0
/100
|
#42
Exceptional
77.4%
Immigrants | Laos
100.0
/100
|
#43
Exceptional
77.4%
Fijians
100.0
/100
|
#44
Exceptional
77.4%
Native Hawaiians
100.0
/100
|
#45
Exceptional
77.4%
Samoans
100.0
/100
|
#46
Exceptional
77.4%
Ethiopians
100.0
/100
|
#47
Exceptional
77.3%
Serbians
100.0
/100
|
#48
Exceptional
77.3%
Chinese
100.0
/100
|
#49
Exceptional
77.3%

Demographics Similar to Immigrants from Jamaica by In Labor Force | Age 20-24

In terms of in labor force | age 20-24, the demographic groups most similar to Immigrants from Jamaica are Immigrants from Singapore (72.4%, a difference of 0.020%), Immigrants from West Indies (72.4%, a difference of 0.050%), Ecuadorian (72.4%, a difference of 0.060%), Native/Alaskan (72.4%, a difference of 0.070%), and Immigrants from Ecuador (72.3%, a difference of 0.15%).
DemographicsRating | RankIn Labor Force | Age 20-24
Iranians
0.0
/100
|
#299
Tragic
72.6%
Armenians
0.0
/100
|
#300
Tragic
72.5%
Cubans
0.0
/100
|
#301
Tragic
72.5%
Natives/Alaskans
0.0
/100
|
#302
Tragic
72.4%
Ecuadorians
0.0
/100
|
#303
Tragic
72.4%
Immigrants | West Indies
0.0
/100
|
#304
Tragic
72.4%
Immigrants | Singapore
0.0
/100
|
#305
Tragic
72.4%
Immigrants | Jamaica
0.0
/100
|
#306
Tragic
72.4%
Immigrants | Ecuador
0.0
/100
|
#307
Tragic
72.3%
Soviet Union
0.0
/100
|
#308
Tragic
72.3%
Tsimshian
0.0
/100
|
#309
Tragic
72.3%
Immigrants | Cuba
0.0
/100
|
#310
Tragic
72.0%
Apache
0.0
/100
|
#311
Tragic
72.0%
Immigrants | Caribbean
0.0
/100
|
#312
Tragic
71.9%
Immigrants | Dominica
0.0
/100
|
#313
Tragic
71.9%