French American Indian vs Immigrants from Australia In Labor Force | Age 45-54
COMPARE
French American Indian
Immigrants from Australia
In Labor Force | Age 45-54
In Labor Force | Age 45-54 Comparison
French American Indians
Immigrants from Australia
80.8%
IN LABOR FORCE | AGE 45-54
0.0/ 100
METRIC RATING
283rd/ 347
METRIC RANK
82.9%
IN LABOR FORCE | AGE 45-54
68.2/ 100
METRIC RATING
157th/ 347
METRIC RANK
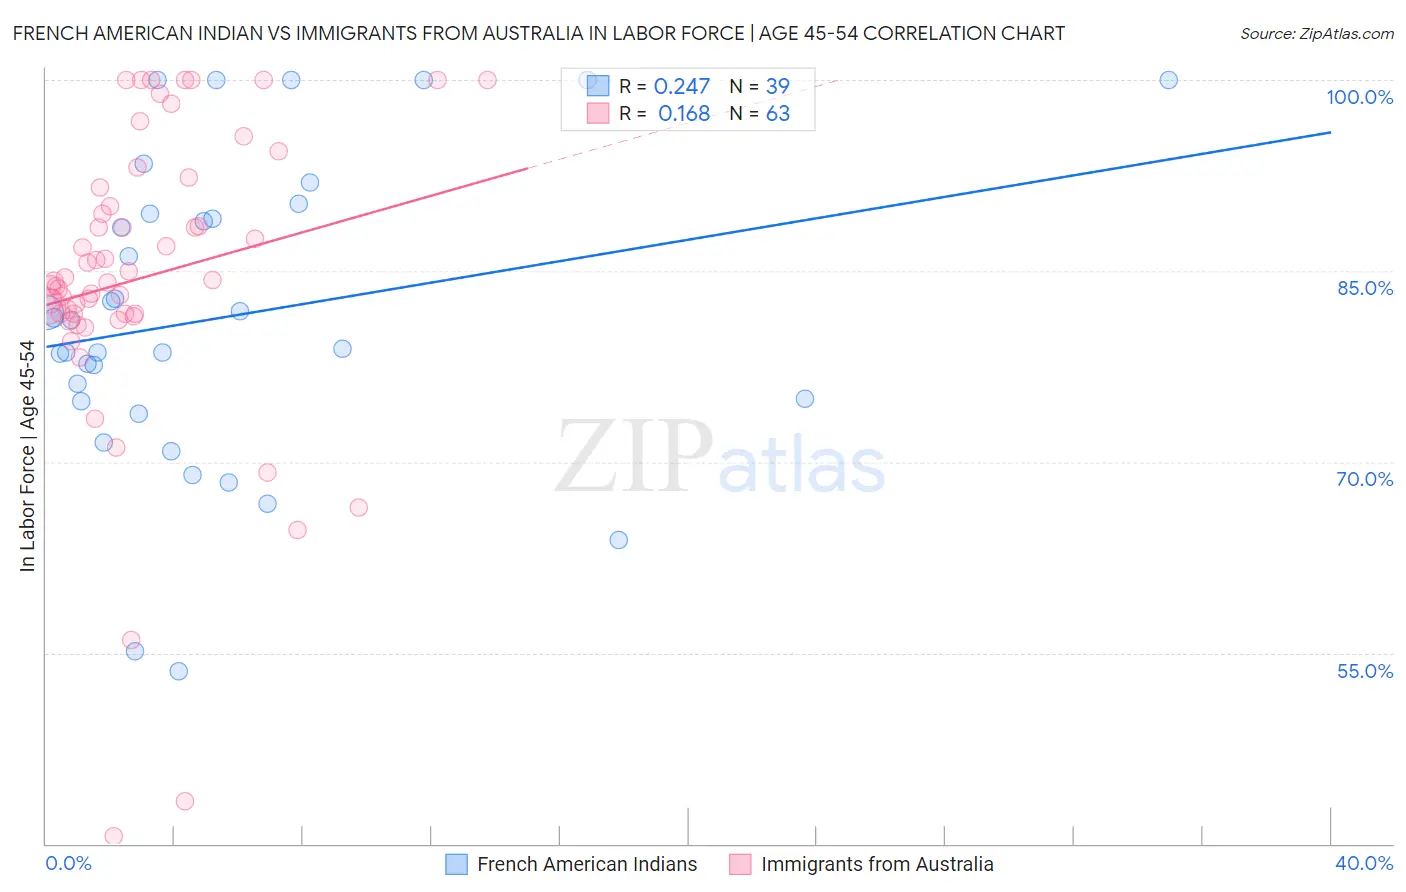
French American Indian vs Immigrants from Australia In Labor Force | Age 45-54 Correlation Chart
The statistical analysis conducted on geographies consisting of 131,958,652 people shows a weak positive correlation between the proportion of French American Indians and labor force participation rate among population between the ages 45 and 54 in the United States with a correlation coefficient (R) of 0.247 and weighted average of 80.8%. Similarly, the statistical analysis conducted on geographies consisting of 227,126,379 people shows a poor positive correlation between the proportion of Immigrants from Australia and labor force participation rate among population between the ages 45 and 54 in the United States with a correlation coefficient (R) of 0.168 and weighted average of 82.9%, a difference of 2.6%.
In Labor Force | Age 45-54 Correlation Summary
| Measurement | French American Indian | Immigrants from Australia |
| Minimum | 53.6% | 40.6% |
| Maximum | 100.0% | 100.0% |
| Range | 46.4% | 59.4% |
| Mean | 81.4% | 84.5% |
| Median | 81.1% | 84.2% |
| Interquartile 25% (IQ1) | 74.7% | 81.6% |
| Interquartile 75% (IQ3) | 89.5% | 91.5% |
| Interquartile Range (IQR) | 14.8% | 9.9% |
| Standard Deviation (Sample) | 11.9% | 12.0% |
| Standard Deviation (Population) | 11.8% | 11.9% |
Similar Demographics by In Labor Force | Age 45-54
Demographics Similar to French American Indians by In Labor Force | Age 45-54
In terms of in labor force | age 45-54, the demographic groups most similar to French American Indians are Belizean (80.8%, a difference of 0.050%), Delaware (80.8%, a difference of 0.060%), Immigrants from Dominica (80.8%, a difference of 0.060%), Vietnamese (80.8%, a difference of 0.070%), and Cree (80.8%, a difference of 0.070%).
| Demographics | Rating | Rank | In Labor Force | Age 45-54 |
| U.S. Virgin Islanders | 0.0 /100 | #276 | Tragic 81.2% |
| Guatemalans | 0.0 /100 | #277 | Tragic 81.2% |
| Immigrants | Guatemala | 0.0 /100 | #278 | Tragic 81.1% |
| Immigrants | Micronesia | 0.0 /100 | #279 | Tragic 81.1% |
| Immigrants | Latin America | 0.0 /100 | #280 | Tragic 81.0% |
| Immigrants | Grenada | 0.0 /100 | #281 | Tragic 81.0% |
| Aleuts | 0.0 /100 | #282 | Tragic 81.0% |
| French American Indians | 0.0 /100 | #283 | Tragic 80.8% |
| Belizeans | 0.0 /100 | #284 | Tragic 80.8% |
| Delaware | 0.0 /100 | #285 | Tragic 80.8% |
| Immigrants | Dominica | 0.0 /100 | #286 | Tragic 80.8% |
| Vietnamese | 0.0 /100 | #287 | Tragic 80.8% |
| Cree | 0.0 /100 | #288 | Tragic 80.8% |
| Immigrants | Bangladesh | 0.0 /100 | #289 | Tragic 80.7% |
| Mexican American Indians | 0.0 /100 | #290 | Tragic 80.7% |
Demographics Similar to Immigrants from Australia by In Labor Force | Age 45-54
In terms of in labor force | age 45-54, the demographic groups most similar to Immigrants from Australia are Immigrants from Southern Europe (82.9%, a difference of 0.0%), Immigrants from Philippines (82.9%, a difference of 0.010%), Immigrants from Saudi Arabia (82.9%, a difference of 0.010%), Immigrants from Indonesia (82.9%, a difference of 0.020%), and Immigrants from Ghana (82.9%, a difference of 0.020%).
| Demographics | Rating | Rank | In Labor Force | Age 45-54 |
| Immigrants | Netherlands | 72.6 /100 | #150 | Good 82.9% |
| Koreans | 71.9 /100 | #151 | Good 82.9% |
| Slavs | 71.5 /100 | #152 | Good 82.9% |
| Immigrants | Indonesia | 70.6 /100 | #153 | Good 82.9% |
| Immigrants | Ghana | 70.3 /100 | #154 | Good 82.9% |
| Immigrants | Philippines | 69.0 /100 | #155 | Good 82.9% |
| Immigrants | Saudi Arabia | 68.8 /100 | #156 | Good 82.9% |
| Immigrants | Australia | 68.2 /100 | #157 | Good 82.9% |
| Immigrants | Southern Europe | 67.8 /100 | #158 | Good 82.9% |
| Immigrants | Austria | 64.6 /100 | #159 | Good 82.9% |
| Laotians | 62.8 /100 | #160 | Good 82.9% |
| South American Indians | 62.2 /100 | #161 | Good 82.9% |
| Haitians | 61.8 /100 | #162 | Good 82.8% |
| Dutch | 61.7 /100 | #163 | Good 82.8% |
| German Russians | 61.3 /100 | #164 | Good 82.8% |