Eastern European vs U.S. Virgin Islander In Labor Force | Age 25-29
COMPARE
Eastern European
U.S. Virgin Islander
In Labor Force | Age 25-29
In Labor Force | Age 25-29 Comparison
Eastern Europeans
U.S. Virgin Islanders
85.5%
IN LABOR FORCE | AGE 25-29
99.6/ 100
METRIC RATING
56th/ 347
METRIC RANK
83.8%
IN LABOR FORCE | AGE 25-29
0.6/ 100
METRIC RATING
242nd/ 347
METRIC RANK
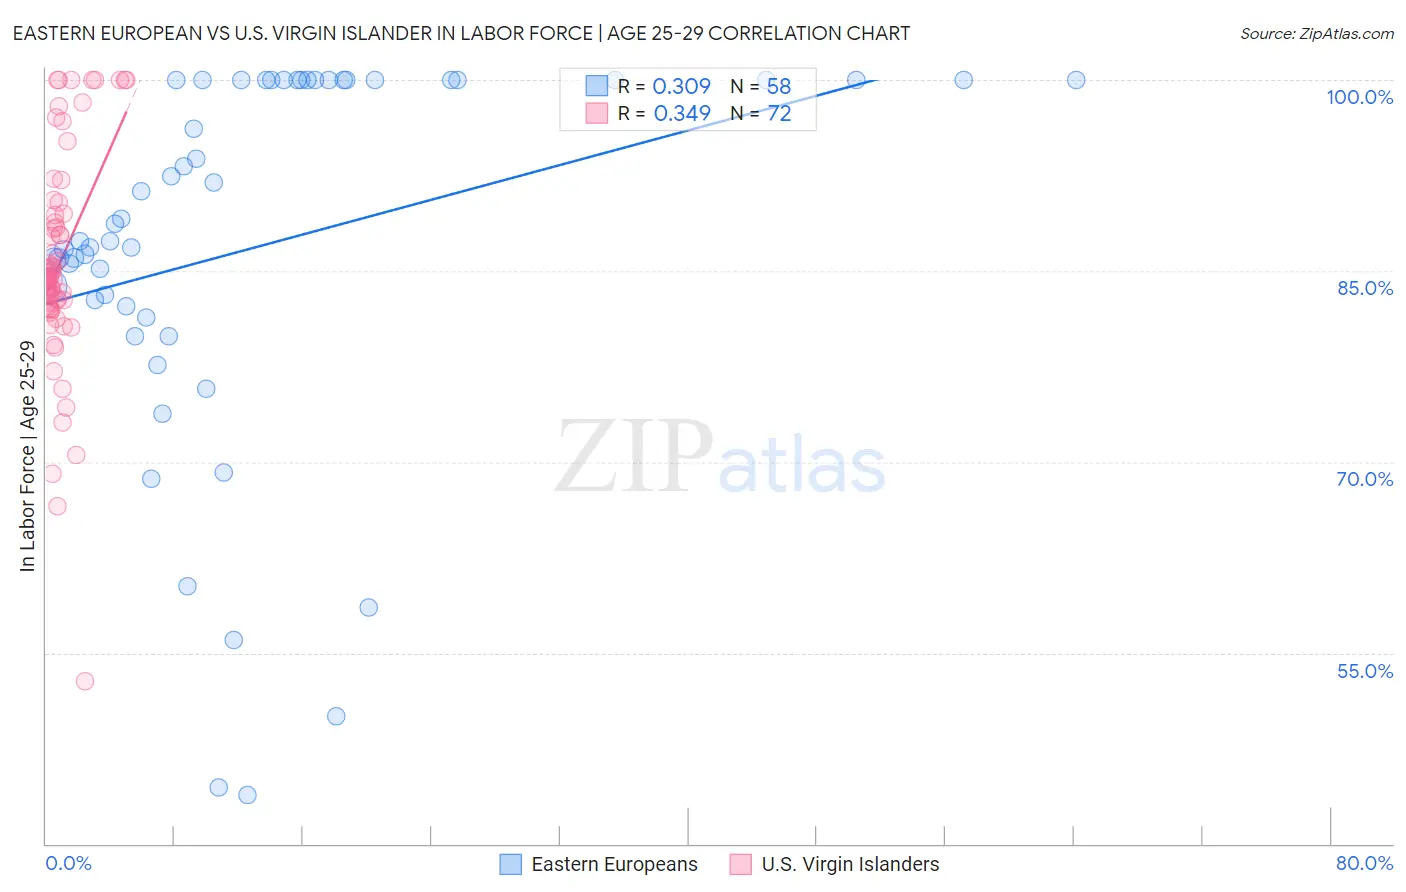
Eastern European vs U.S. Virgin Islander In Labor Force | Age 25-29 Correlation Chart
The statistical analysis conducted on geographies consisting of 460,900,054 people shows a mild positive correlation between the proportion of Eastern Europeans and labor force participation rate among population between the ages 25 and 29 in the United States with a correlation coefficient (R) of 0.309 and weighted average of 85.5%. Similarly, the statistical analysis conducted on geographies consisting of 87,522,048 people shows a mild positive correlation between the proportion of U.S. Virgin Islanders and labor force participation rate among population between the ages 25 and 29 in the United States with a correlation coefficient (R) of 0.349 and weighted average of 83.8%, a difference of 2.0%.
In Labor Force | Age 25-29 Correlation Summary
| Measurement | Eastern European | U.S. Virgin Islander |
| Minimum | 43.8% | 52.8% |
| Maximum | 100.0% | 100.0% |
| Range | 56.2% | 47.2% |
| Mean | 86.9% | 85.6% |
| Median | 88.0% | 84.5% |
| Interquartile 25% (IQ1) | 82.2% | 82.2% |
| Interquartile 75% (IQ3) | 100.0% | 89.4% |
| Interquartile Range (IQR) | 17.8% | 7.3% |
| Standard Deviation (Sample) | 14.9% | 8.6% |
| Standard Deviation (Population) | 14.7% | 8.5% |
Similar Demographics by In Labor Force | Age 25-29
Demographics Similar to Eastern Europeans by In Labor Force | Age 25-29
In terms of in labor force | age 25-29, the demographic groups most similar to Eastern Europeans are Estonian (85.5%, a difference of 0.010%), Greek (85.5%, a difference of 0.010%), Immigrants from Morocco (85.5%, a difference of 0.020%), Immigrants from Brazil (85.5%, a difference of 0.030%), and Belgian (85.5%, a difference of 0.040%).
| Demographics | Rating | Rank | In Labor Force | Age 25-29 |
| Swedes | 99.8 /100 | #49 | Exceptional 85.6% |
| Yugoslavians | 99.8 /100 | #50 | Exceptional 85.6% |
| Immigrants | Latvia | 99.8 /100 | #51 | Exceptional 85.6% |
| Immigrants | Poland | 99.7 /100 | #52 | Exceptional 85.6% |
| Belgians | 99.7 /100 | #53 | Exceptional 85.5% |
| Albanians | 99.7 /100 | #54 | Exceptional 85.5% |
| Immigrants | Brazil | 99.7 /100 | #55 | Exceptional 85.5% |
| Eastern Europeans | 99.6 /100 | #56 | Exceptional 85.5% |
| Estonians | 99.6 /100 | #57 | Exceptional 85.5% |
| Greeks | 99.6 /100 | #58 | Exceptional 85.5% |
| Immigrants | Morocco | 99.5 /100 | #59 | Exceptional 85.5% |
| Thais | 99.5 /100 | #60 | Exceptional 85.5% |
| Serbians | 99.5 /100 | #61 | Exceptional 85.5% |
| Taiwanese | 99.4 /100 | #62 | Exceptional 85.4% |
| Immigrants | Kenya | 99.4 /100 | #63 | Exceptional 85.4% |
Demographics Similar to U.S. Virgin Islanders by In Labor Force | Age 25-29
In terms of in labor force | age 25-29, the demographic groups most similar to U.S. Virgin Islanders are Salvadoran (83.8%, a difference of 0.010%), Alsatian (83.9%, a difference of 0.030%), Immigrants from Jamaica (83.8%, a difference of 0.050%), Iroquois (83.8%, a difference of 0.050%), and Immigrants from Uzbekistan (83.9%, a difference of 0.060%).
| Demographics | Rating | Rank | In Labor Force | Age 25-29 |
| Iraqis | 0.9 /100 | #235 | Tragic 83.9% |
| Guamanians/Chamorros | 0.9 /100 | #236 | Tragic 83.9% |
| Immigrants | Immigrants | 0.9 /100 | #237 | Tragic 83.9% |
| Immigrants | Uzbekistan | 0.8 /100 | #238 | Tragic 83.9% |
| Jamaicans | 0.8 /100 | #239 | Tragic 83.9% |
| Trinidadians and Tobagonians | 0.7 /100 | #240 | Tragic 83.9% |
| Alsatians | 0.7 /100 | #241 | Tragic 83.9% |
| U.S. Virgin Islanders | 0.6 /100 | #242 | Tragic 83.8% |
| Salvadorans | 0.5 /100 | #243 | Tragic 83.8% |
| Immigrants | Jamaica | 0.4 /100 | #244 | Tragic 83.8% |
| Iroquois | 0.4 /100 | #245 | Tragic 83.8% |
| Cree | 0.3 /100 | #246 | Tragic 83.8% |
| Immigrants | El Salvador | 0.3 /100 | #247 | Tragic 83.7% |
| Immigrants | Nonimmigrants | 0.3 /100 | #248 | Tragic 83.7% |
| Hmong | 0.3 /100 | #249 | Tragic 83.7% |