Eastern European vs Cuban In Labor Force | Age 20-64
COMPARE
Eastern European
Cuban
In Labor Force | Age 20-64
In Labor Force | Age 20-64 Comparison
Eastern Europeans
Cubans
80.2%
IN LABOR FORCE | AGE 20-64
98.4/ 100
METRIC RATING
72nd/ 347
METRIC RANK
79.5%
IN LABOR FORCE | AGE 20-64
46.1/ 100
METRIC RATING
175th/ 347
METRIC RANK
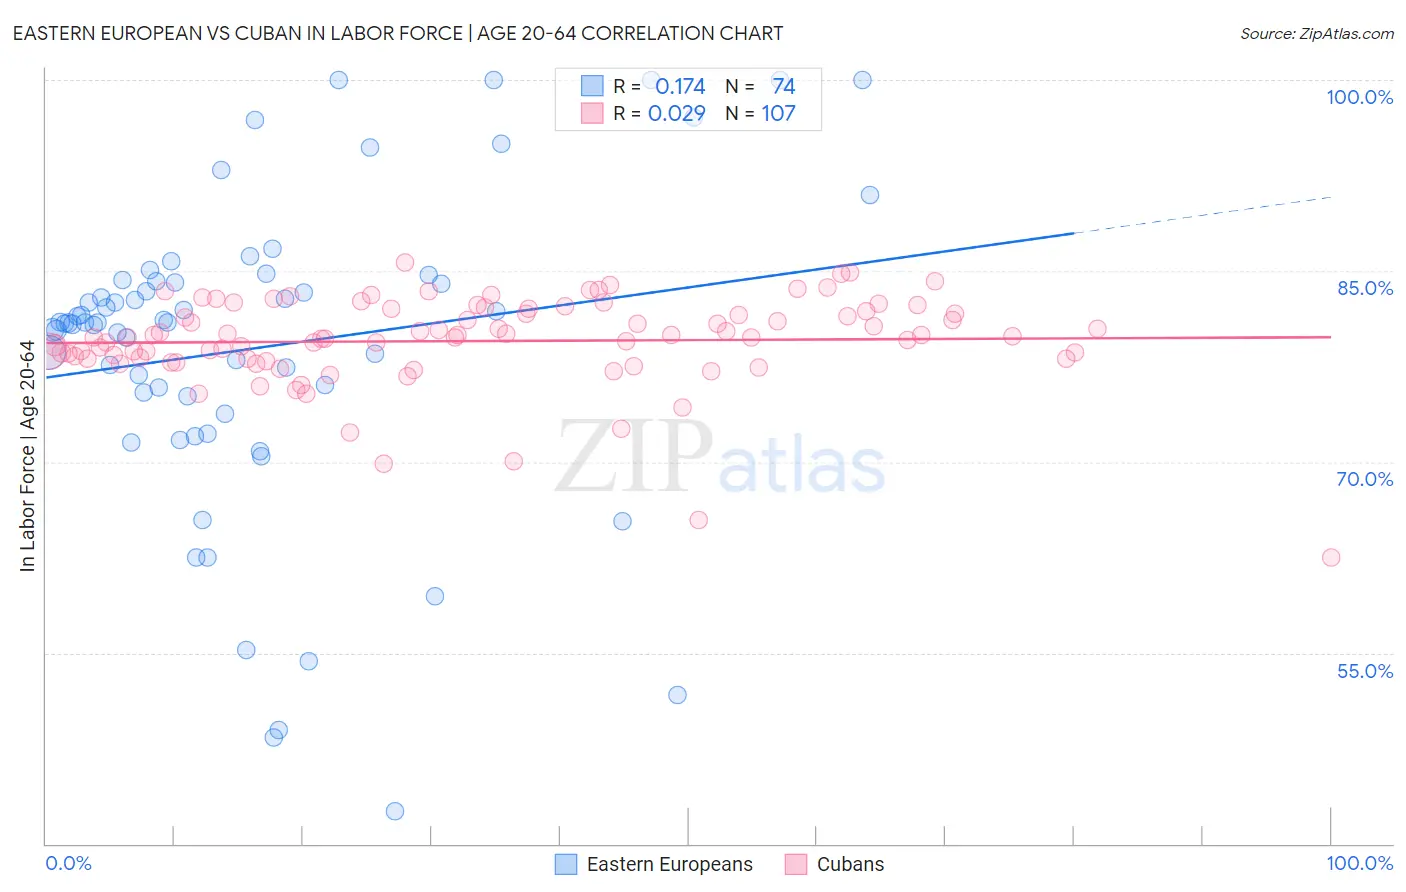
Eastern European vs Cuban In Labor Force | Age 20-64 Correlation Chart
The statistical analysis conducted on geographies consisting of 461,260,494 people shows a poor positive correlation between the proportion of Eastern Europeans and labor force participation rate among population between the ages 20 and 64 in the United States with a correlation coefficient (R) of 0.174 and weighted average of 80.2%. Similarly, the statistical analysis conducted on geographies consisting of 449,374,603 people shows no correlation between the proportion of Cubans and labor force participation rate among population between the ages 20 and 64 in the United States with a correlation coefficient (R) of 0.029 and weighted average of 79.5%, a difference of 0.86%.
In Labor Force | Age 20-64 Correlation Summary
| Measurement | Eastern European | Cuban |
| Minimum | 42.6% | 62.5% |
| Maximum | 100.0% | 85.7% |
| Range | 57.4% | 23.2% |
| Mean | 79.0% | 79.5% |
| Median | 80.9% | 79.8% |
| Interquartile 25% (IQ1) | 75.2% | 78.1% |
| Interquartile 75% (IQ3) | 84.2% | 82.0% |
| Interquartile Range (IQR) | 9.0% | 3.9% |
| Standard Deviation (Sample) | 12.3% | 3.6% |
| Standard Deviation (Population) | 12.2% | 3.6% |
Similar Demographics by In Labor Force | Age 20-64
Demographics Similar to Eastern Europeans by In Labor Force | Age 20-64
In terms of in labor force | age 20-64, the demographic groups most similar to Eastern Europeans are Soviet Union (80.2%, a difference of 0.010%), Bhutanese (80.2%, a difference of 0.020%), Albanian (80.2%, a difference of 0.020%), Immigrants from Turkey (80.2%, a difference of 0.020%), and Macedonian (80.2%, a difference of 0.030%).
| Demographics | Rating | Rank | In Labor Force | Age 20-64 |
| Lithuanians | 98.7 /100 | #65 | Exceptional 80.2% |
| Macedonians | 98.7 /100 | #66 | Exceptional 80.2% |
| Taiwanese | 98.6 /100 | #67 | Exceptional 80.2% |
| Bhutanese | 98.6 /100 | #68 | Exceptional 80.2% |
| Albanians | 98.6 /100 | #69 | Exceptional 80.2% |
| Immigrants | Turkey | 98.5 /100 | #70 | Exceptional 80.2% |
| Soviet Union | 98.5 /100 | #71 | Exceptional 80.2% |
| Eastern Europeans | 98.4 /100 | #72 | Exceptional 80.2% |
| Cypriots | 98.2 /100 | #73 | Exceptional 80.2% |
| Immigrants | Eastern Europe | 98.1 /100 | #74 | Exceptional 80.2% |
| Immigrants | Afghanistan | 97.9 /100 | #75 | Exceptional 80.2% |
| Egyptians | 97.8 /100 | #76 | Exceptional 80.2% |
| Immigrants | Colombia | 97.8 /100 | #77 | Exceptional 80.2% |
| Immigrants | Romania | 97.8 /100 | #78 | Exceptional 80.2% |
| Asians | 97.7 /100 | #79 | Exceptional 80.2% |
Demographics Similar to Cubans by In Labor Force | Age 20-64
In terms of in labor force | age 20-64, the demographic groups most similar to Cubans are Australian (79.5%, a difference of 0.0%), Immigrants from Netherlands (79.5%, a difference of 0.010%), Czechoslovakian (79.5%, a difference of 0.010%), Syrian (79.6%, a difference of 0.030%), and Armenian (79.5%, a difference of 0.040%).
| Demographics | Rating | Rank | In Labor Force | Age 20-64 |
| Immigrants | Indonesia | 61.8 /100 | #168 | Good 79.6% |
| Laotians | 58.4 /100 | #169 | Average 79.6% |
| Slavs | 54.0 /100 | #170 | Average 79.6% |
| Immigrants | Switzerland | 53.3 /100 | #171 | Average 79.6% |
| Immigrants | Belgium | 53.1 /100 | #172 | Average 79.6% |
| Immigrants | Scotland | 52.4 /100 | #173 | Average 79.6% |
| Syrians | 50.0 /100 | #174 | Average 79.6% |
| Cubans | 46.1 /100 | #175 | Average 79.5% |
| Australians | 46.0 /100 | #176 | Average 79.5% |
| Immigrants | Netherlands | 45.2 /100 | #177 | Average 79.5% |
| Czechoslovakians | 44.3 /100 | #178 | Average 79.5% |
| Armenians | 41.4 /100 | #179 | Average 79.5% |
| Salvadorans | 41.0 /100 | #180 | Average 79.5% |
| Immigrants | Saudi Arabia | 37.7 /100 | #181 | Fair 79.5% |
| Malaysians | 37.1 /100 | #182 | Fair 79.5% |