Dutch West Indian vs American In Labor Force | Age 20-24
COMPARE
Dutch West Indian
American
In Labor Force | Age 20-24
In Labor Force | Age 20-24 Comparison
Dutch West Indians
Americans
73.7%
IN LABOR FORCE | AGE 20-24
0.7/ 100
METRIC RATING
259th/ 347
METRIC RANK
76.1%
IN LABOR FORCE | AGE 20-24
97.8/ 100
METRIC RATING
99th/ 347
METRIC RANK
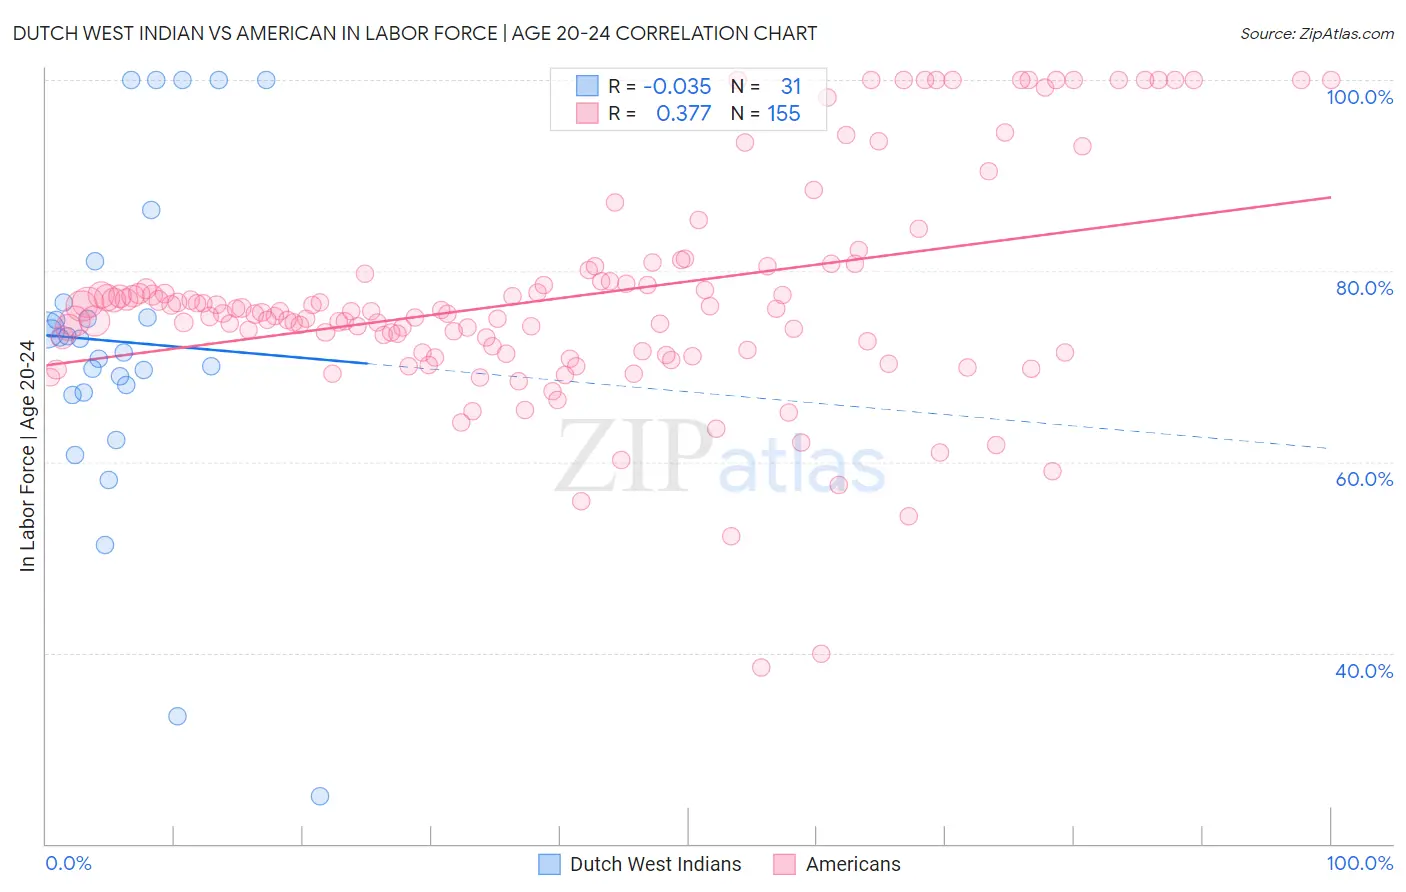
Dutch West Indian vs American In Labor Force | Age 20-24 Correlation Chart
The statistical analysis conducted on geographies consisting of 85,756,423 people shows no correlation between the proportion of Dutch West Indians and labor force participation rate among population between the ages 20 and 24 in the United States with a correlation coefficient (R) of -0.035 and weighted average of 73.7%. Similarly, the statistical analysis conducted on geographies consisting of 579,768,276 people shows a mild positive correlation between the proportion of Americans and labor force participation rate among population between the ages 20 and 24 in the United States with a correlation coefficient (R) of 0.377 and weighted average of 76.1%, a difference of 3.3%.
In Labor Force | Age 20-24 Correlation Summary
| Measurement | Dutch West Indian | American |
| Minimum | 25.0% | 38.4% |
| Maximum | 100.0% | 100.0% |
| Range | 75.0% | 61.6% |
| Mean | 72.6% | 77.2% |
| Median | 72.9% | 75.7% |
| Interquartile 25% (IQ1) | 67.3% | 71.5% |
| Interquartile 75% (IQ3) | 76.7% | 79.7% |
| Interquartile Range (IQR) | 9.4% | 8.3% |
| Standard Deviation (Sample) | 17.2% | 11.5% |
| Standard Deviation (Population) | 16.9% | 11.5% |
Similar Demographics by In Labor Force | Age 20-24
Demographics Similar to Dutch West Indians by In Labor Force | Age 20-24
In terms of in labor force | age 20-24, the demographic groups most similar to Dutch West Indians are Egyptian (73.7%, a difference of 0.0%), Immigrants from Turkey (73.7%, a difference of 0.030%), Paraguayan (73.7%, a difference of 0.040%), Houma (73.7%, a difference of 0.040%), and Asian (73.7%, a difference of 0.050%).
| Demographics | Rating | Rank | In Labor Force | Age 20-24 |
| Immigrants | Kazakhstan | 1.1 /100 | #252 | Tragic 73.8% |
| Arapaho | 1.0 /100 | #253 | Tragic 73.8% |
| Ute | 1.0 /100 | #254 | Tragic 73.8% |
| Immigrants | Pakistan | 0.9 /100 | #255 | Tragic 73.8% |
| Spanish American Indians | 0.8 /100 | #256 | Tragic 73.7% |
| Paraguayans | 0.8 /100 | #257 | Tragic 73.7% |
| Egyptians | 0.7 /100 | #258 | Tragic 73.7% |
| Dutch West Indians | 0.7 /100 | #259 | Tragic 73.7% |
| Immigrants | Turkey | 0.7 /100 | #260 | Tragic 73.7% |
| Houma | 0.6 /100 | #261 | Tragic 73.7% |
| Asians | 0.6 /100 | #262 | Tragic 73.7% |
| Immigrants | Asia | 0.5 /100 | #263 | Tragic 73.6% |
| Immigrants | Haiti | 0.5 /100 | #264 | Tragic 73.6% |
| Burmese | 0.5 /100 | #265 | Tragic 73.6% |
| Haitians | 0.5 /100 | #266 | Tragic 73.6% |
Demographics Similar to Americans by In Labor Force | Age 20-24
In terms of in labor force | age 20-24, the demographic groups most similar to Americans are Shoshone (76.1%, a difference of 0.0%), Immigrants from Poland (76.1%, a difference of 0.020%), Immigrants from Lithuania (76.1%, a difference of 0.030%), Immigrants from Oceania (76.1%, a difference of 0.030%), and Latvian (76.1%, a difference of 0.030%).
| Demographics | Rating | Rank | In Labor Force | Age 20-24 |
| Maltese | 98.9 /100 | #92 | Exceptional 76.3% |
| Hungarians | 98.9 /100 | #93 | Exceptional 76.3% |
| Potawatomi | 98.5 /100 | #94 | Exceptional 76.2% |
| Immigrants | Germany | 98.5 /100 | #95 | Exceptional 76.2% |
| Immigrants | Nonimmigrants | 98.5 /100 | #96 | Exceptional 76.2% |
| Immigrants | Lithuania | 98.0 /100 | #97 | Exceptional 76.1% |
| Immigrants | Oceania | 98.0 /100 | #98 | Exceptional 76.1% |
| Americans | 97.8 /100 | #99 | Exceptional 76.1% |
| Shoshone | 97.8 /100 | #100 | Exceptional 76.1% |
| Immigrants | Poland | 97.7 /100 | #101 | Exceptional 76.1% |
| Latvians | 97.6 /100 | #102 | Exceptional 76.1% |
| Immigrants | North Macedonia | 97.5 /100 | #103 | Exceptional 76.1% |
| Macedonians | 97.2 /100 | #104 | Exceptional 76.0% |
| Immigrants | Nepal | 97.2 /100 | #105 | Exceptional 76.0% |
| Immigrants | Uganda | 97.1 /100 | #106 | Exceptional 76.0% |