Cuban vs Immigrants from Ghana In Labor Force | Age 30-34

COMPARE

Cuban
Race
Ancestry
AfghanAfricanAlaska NativeAlaskan AthabascanAlbanianAleutAlsatianAmericanApacheArabArapahoArgentineanArmenianAssyrian/Chaldean/SyriacAustralianAustrianBahamianBangladeshiBarbadianBasqueBelgianBelizeanBermudanBhutaneseBlackfeetBolivianBrazilianBritishBritish West IndianBulgarianBurmeseCajunCambodianCanadianCape VerdeanCarpatho RusynCelticCentral AmericanCentral American IndianCherokeeCheyenneChickasawChileanChineseChippewaChoctawColombianColvilleComancheCosta RicanCreeCreekCroatianCrowCubanCypriotCzechCzechoslovakianDanishDelawareDominicanDutchDutch West IndianEastern EuropeanEcuadorianEgyptianEnglishEstonianEthiopianEuropeanFijianFilipinoFinnishFrenchFrench American IndianFrench CanadianGermanGerman RussianGhanaianGreekGuamanian/ChamorroGuatemalanGuyaneseHaitianHmongHonduranHopiHoumaHungarianIcelanderIndian (Asian)IndonesianInupiatIranianIraqiIrishIroquoisIsraeliItalianJamaicanJapaneseJordanianKenyanKiowaKoreanLaotianLatvianLebaneseLiberianLithuanianLumbeeLuxembourgerMacedonianMalaysianMalteseMarshalleseMenomineeMexicanMexican American IndianMongolianMoroccanNative HawaiianNavajoNepaleseNew ZealanderNicaraguanNigerianNorthern EuropeanNorwegianOkinawanOsageOttawaPaiutePakistaniPalestinianPanamanianParaguayanPennsylvania GermanPeruvianPimaPolishPortuguesePotawatomiPuebloPuerto RicanPuget Sound SalishRomanianRussianSalvadoranSamoanScandinavianScotch-IrishScottishSeminoleSenegaleseSerbianShoshoneSierra LeoneanSiouxSlavicSlovakSloveneSomaliSouth AfricanSouth AmericanSouth American IndianSoviet UnionSpaniardSpanishSpanish AmericanSpanish American IndianSri LankanSubsaharan AfricanSudaneseSwedishSwissSyrianTaiwaneseThaiTlingit-HaidaTohono O'OdhamTonganTrinidadian and TobagonianTsimshianTurkishU.S. Virgin IslanderUgandanUkrainianUruguayanUteVenezuelanVietnameseWelshWest IndianYakamaYaquiYugoslavianYumanYup'ikZimbabwean
Immigration
NonimmigrantsImmigrantsAfghanistanAfricaAlbaniaArgentinaArmeniaAsiaAustraliaAustriaBahamasBangladeshBarbadosBelarusBelgiumBelizeBoliviaBosnia and HerzegovinaBrazilBulgariaBurma/MyanmarCabo VerdeCambodiaCameroonCanadaCaribbeanCentral AmericaChileChinaColombiaCongoCosta RicaCroatiaCubaCzechoslovakiaDenmarkDominicaDominican RepublicEastern AfricaEastern AsiaEastern EuropeEcuadorEgyptEl SalvadorEnglandEritreaEthiopiaEuropeFijiFranceGermanyGreeceGrenadaGuatemalaGuyanaHaitiHondurasHong KongHungaryIndiaIndonesiaIranIraqIrelandIsraelItalyJamaicaJapanJordanKazakhstanKenyaKoreaKuwaitLaosLatin AmericaLatviaLebanonLiberiaLithuaniaMalaysiaMexicoMicronesiaMiddle AfricaMoldovaMoroccoNepalNetherlandsNicaraguaNigeriaNorth AmericaNorth MacedoniaNorthern AfricaNorthern EuropeNorwayOceaniaPakistanPanamaPeruPhilippinesPolandPortugalRomaniaRussiaSaudi ArabiaScotlandSenegalSerbiaSierra LeoneSingaporeSomaliaSouth AfricaSouth AmericaSouth Central AsiaSouth Eastern AsiaSouthern EuropeSpainSri LankaSt. Vincent and the GrenadinesSudanSwedenSwitzerlandSyriaTaiwanThailandTrinidad and TobagoTurkeyUgandaUkraineUruguayUzbekistanVenezuelaVietnamWest IndiesWestern AfricaWestern AsiaWestern EuropeYemenZaireZimbabweAzores
Immigrants from Ghana
Race
Ancestry
AfghanAfricanAlaska NativeAlaskan AthabascanAlbanianAleutAlsatianAmericanApacheArabArapahoArgentineanArmenianAssyrian/Chaldean/SyriacAustralianAustrianBahamianBangladeshiBarbadianBasqueBelgianBelizeanBermudanBhutaneseBlackfeetBolivianBrazilianBritishBritish West IndianBulgarianBurmeseCajunCambodianCanadianCape VerdeanCarpatho RusynCelticCentral AmericanCentral American IndianCherokeeCheyenneChickasawChileanChineseChippewaChoctawColombianColvilleComancheCosta RicanCreeCreekCroatianCrowCypriotCzechCzechoslovakianDanishDelawareDominicanDutchDutch West IndianEastern EuropeanEcuadorianEgyptianEnglishEstonianEthiopianEuropeanFijianFilipinoFinnishFrenchFrench American IndianFrench CanadianGermanGerman RussianGhanaianGreekGuamanian/ChamorroGuatemalanGuyaneseHaitianHmongHonduranHopiHoumaHungarianIcelanderIndian (Asian)IndonesianInupiatIranianIraqiIrishIroquoisIsraeliItalianJamaicanJapaneseJordanianKenyanKiowaKoreanLaotianLatvianLebaneseLiberianLithuanianLumbeeLuxembourgerMacedonianMalaysianMalteseMarshalleseMenomineeMexicanMexican American IndianMongolianMoroccanNative HawaiianNavajoNepaleseNew ZealanderNicaraguanNigerianNorthern EuropeanNorwegianOkinawanOsageOttawaPaiutePakistaniPalestinianPanamanianParaguayanPennsylvania GermanPeruvianPimaPolishPortuguesePotawatomiPuebloPuerto RicanPuget Sound SalishRomanianRussianSalvadoranSamoanScandinavianScotch-IrishScottishSeminoleSenegaleseSerbianShoshoneSierra LeoneanSiouxSlavicSlovakSloveneSomaliSouth AfricanSouth AmericanSouth American IndianSoviet UnionSpaniardSpanishSpanish AmericanSpanish American IndianSri LankanSubsaharan AfricanSudaneseSwedishSwissSyrianTaiwaneseThaiTlingit-HaidaTohono O'OdhamTonganTrinidadian and TobagonianTsimshianTurkishU.S. Virgin IslanderUgandanUkrainianUruguayanUteVenezuelanVietnameseWelshWest IndianYakamaYaquiYugoslavianYumanYup'ikZimbabwean
Immigration
NonimmigrantsImmigrantsAfghanistanAfricaAlbaniaArgentinaArmeniaAsiaAustraliaAustriaBahamasBangladeshBarbadosBelarusBelgiumBelizeBoliviaBosnia and HerzegovinaBrazilBulgariaBurma/MyanmarCabo VerdeCambodiaCameroonCanadaCaribbeanCentral AmericaChileChinaColombiaCongoCosta RicaCroatiaCubaCzechoslovakiaDenmarkDominicaDominican RepublicEastern AfricaEastern AsiaEastern EuropeEcuadorEgyptEl SalvadorEnglandEritreaEthiopiaEuropeFijiFranceGermanyGhanaGreeceGrenadaGuatemalaGuyanaHaitiHondurasHong KongHungaryIndiaIndonesiaIranIraqIrelandIsraelItalyJamaicaJapanJordanKazakhstanKenyaKoreaKuwaitLaosLatin AmericaLatviaLebanonLiberiaLithuaniaMalaysiaMexicoMicronesiaMiddle AfricaMoldovaMoroccoNepalNetherlandsNicaraguaNigeriaNorth AmericaNorth MacedoniaNorthern AfricaNorthern EuropeNorwayOceaniaPakistanPanamaPeruPhilippinesPolandPortugalRomaniaRussiaSaudi ArabiaScotlandSenegalSerbiaSierra LeoneSingaporeSomaliaSouth AfricaSouth AmericaSouth Central AsiaSouth Eastern AsiaSouthern EuropeSpainSri LankaSt. Vincent and the GrenadinesSudanSwedenSwitzerlandSyriaTaiwanThailandTrinidad and TobagoTurkeyUgandaUkraineUruguayUzbekistanVenezuelaVietnamWest IndiesWestern AfricaWestern AsiaWestern EuropeYemenZaireZimbabweAzores
In Labor Force | Age 30-34
Income
Poverty
Unemployment
Labor Participation
Family Structure
Vehicle Availability
Education Level
Disability

In Labor Force | Age 30-34 Comparison

Cubans

Immigrants from Ghana

Tragic
Exceptional
84.2%
IN LABOR FORCE | AGE 30-34
3.4/ 100
METRIC RATING
224th/ 347
METRIC RANK
85.2%
IN LABOR FORCE | AGE 30-34
96.5/ 100
METRIC RATING
104th/ 347
METRIC RANK

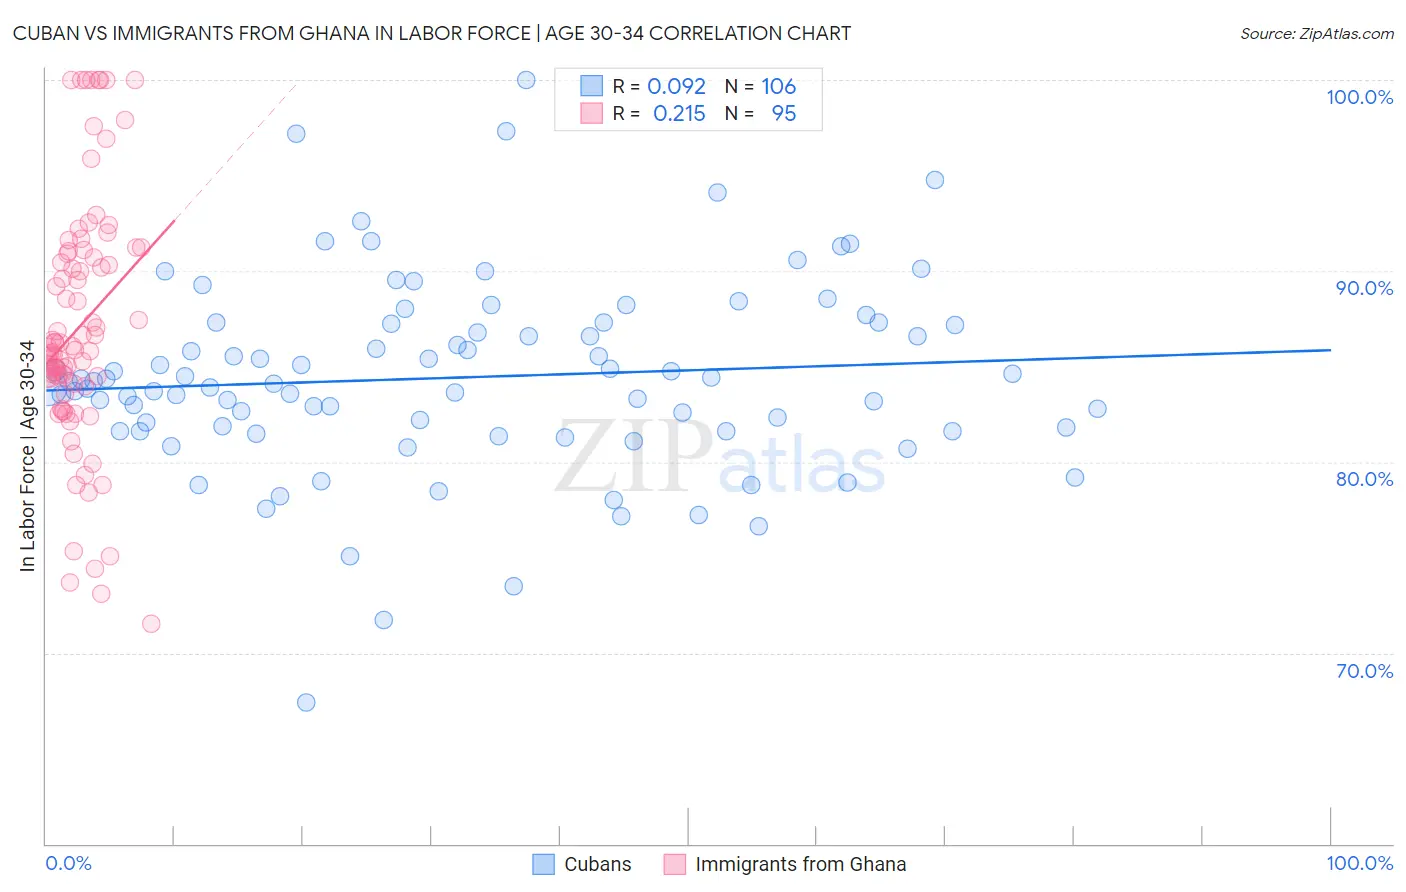
Cuban vs Immigrants from Ghana In Labor Force | Age 30-34 Correlation Chart

The statistical analysis conducted on geographies consisting of 448,964,387 people shows a slight positive correlation between the proportion of Cubans and labor force participation rate among population between the ages 30 and 34 in the United States with a correlation coefficient (R) of 0.092 and weighted average of 84.2%. Similarly, the statistical analysis conducted on geographies consisting of 199,865,631 people shows a weak positive correlation between the proportion of Immigrants from Ghana and labor force participation rate among population between the ages 30 and 34 in the United States with a correlation coefficient (R) of 0.215 and weighted average of 85.2%, a difference of 1.2%.
Cuban vs Immigrants from Ghana In Labor Force | Age 30-34

In Labor Force | Age 30-34 Correlation Summary

MeasurementCubanImmigrants from Ghana
Minimum67.4%71.5%
Maximum100.0%100.0%
Range32.6%28.5%
Mean84.4%87.0%
Median84.1%85.8%
Interquartile 25% (IQ1)81.6%84.1%
Interquartile 75% (IQ3)87.3%90.9%
Interquartile Range (IQR)5.6%6.8%
Standard Deviation (Sample)5.1%6.4%
Standard Deviation (Population)5.1%6.4%

Similar Demographics by In Labor Force | Age 30-34

Demographics Similar to Cubans by In Labor Force | Age 30-34

In terms of in labor force | age 30-34, the demographic groups most similar to Cubans are Immigrants from Laos (84.2%, a difference of 0.010%), Salvadoran (84.2%, a difference of 0.020%), Panamanian (84.2%, a difference of 0.020%), Scottish (84.2%, a difference of 0.020%), and Immigrants from El Salvador (84.2%, a difference of 0.020%).
DemographicsRating | RankIn Labor Force | Age 30-34
Immigrants | Trinidad and Tobago
7.0
/100
|
#217
Tragic
84.3%
Immigrants | Panama
6.3
/100
|
#218
Tragic
84.3%
Swiss
5.8
/100
|
#219
Tragic
84.3%
Danes
5.3
/100
|
#220
Tragic
84.3%
Salvadorans
3.8
/100
|
#221
Tragic
84.2%
Panamanians
3.8
/100
|
#222
Tragic
84.2%
Immigrants | Laos
3.6
/100
|
#223
Tragic
84.2%
Cubans
3.4
/100
|
#224
Tragic
84.2%
Scottish
3.1
/100
|
#225
Tragic
84.2%
Immigrants | El Salvador
3.0
/100
|
#226
Tragic
84.2%
Immigrants | Cuba
3.0
/100
|
#227
Tragic
84.2%
Immigrants | Haiti
2.8
/100
|
#228
Tragic
84.2%
Welsh
2.7
/100
|
#229
Tragic
84.2%
Immigrants | Bahamas
2.6
/100
|
#230
Tragic
84.1%
Malaysians
2.2
/100
|
#231
Tragic
84.1%

Demographics Similar to Immigrants from Ghana by In Labor Force | Age 30-34

In terms of in labor force | age 30-34, the demographic groups most similar to Immigrants from Ghana are Ukrainian (85.2%, a difference of 0.0%), Immigrants from Austria (85.2%, a difference of 0.010%), Alsatian (85.2%, a difference of 0.010%), Immigrants from Middle Africa (85.2%, a difference of 0.010%), and Immigrants from Northern Africa (85.2%, a difference of 0.010%).
DemographicsRating | RankIn Labor Force | Age 30-34
Thais
97.2
/100
|
#97
Exceptional
85.2%
Immigrants | Uganda
97.2
/100
|
#98
Exceptional
85.2%
Belgians
97.2
/100
|
#99
Exceptional
85.2%
Sudanese
97.1
/100
|
#100
Exceptional
85.2%
Immigrants | Belarus
96.9
/100
|
#101
Exceptional
85.2%
Immigrants | Austria
96.8
/100
|
#102
Exceptional
85.2%
Ukrainians
96.6
/100
|
#103
Exceptional
85.2%
Immigrants | Ghana
96.5
/100
|
#104
Exceptional
85.2%
Alsatians
96.3
/100
|
#105
Exceptional
85.2%
Immigrants | Middle Africa
96.3
/100
|
#106
Exceptional
85.2%
Immigrants | Northern Africa
96.3
/100
|
#107
Exceptional
85.2%
Immigrants | Zimbabwe
95.8
/100
|
#108
Exceptional
85.1%
Argentineans
95.8
/100
|
#109
Exceptional
85.1%
Immigrants | South Africa
95.3
/100
|
#110
Exceptional
85.1%
Immigrants | Scotland
94.9
/100
|
#111
Exceptional
85.1%