Crow vs Bermudan In Labor Force | Age 25-29
COMPARE
Crow
Bermudan
In Labor Force | Age 25-29
In Labor Force | Age 25-29 Comparison
Crow
Bermudans
78.6%
IN LABOR FORCE | AGE 25-29
0.0/ 100
METRIC RATING
337th/ 347
METRIC RANK
86.0%
IN LABOR FORCE | AGE 25-29
100.0/ 100
METRIC RATING
17th/ 347
METRIC RANK
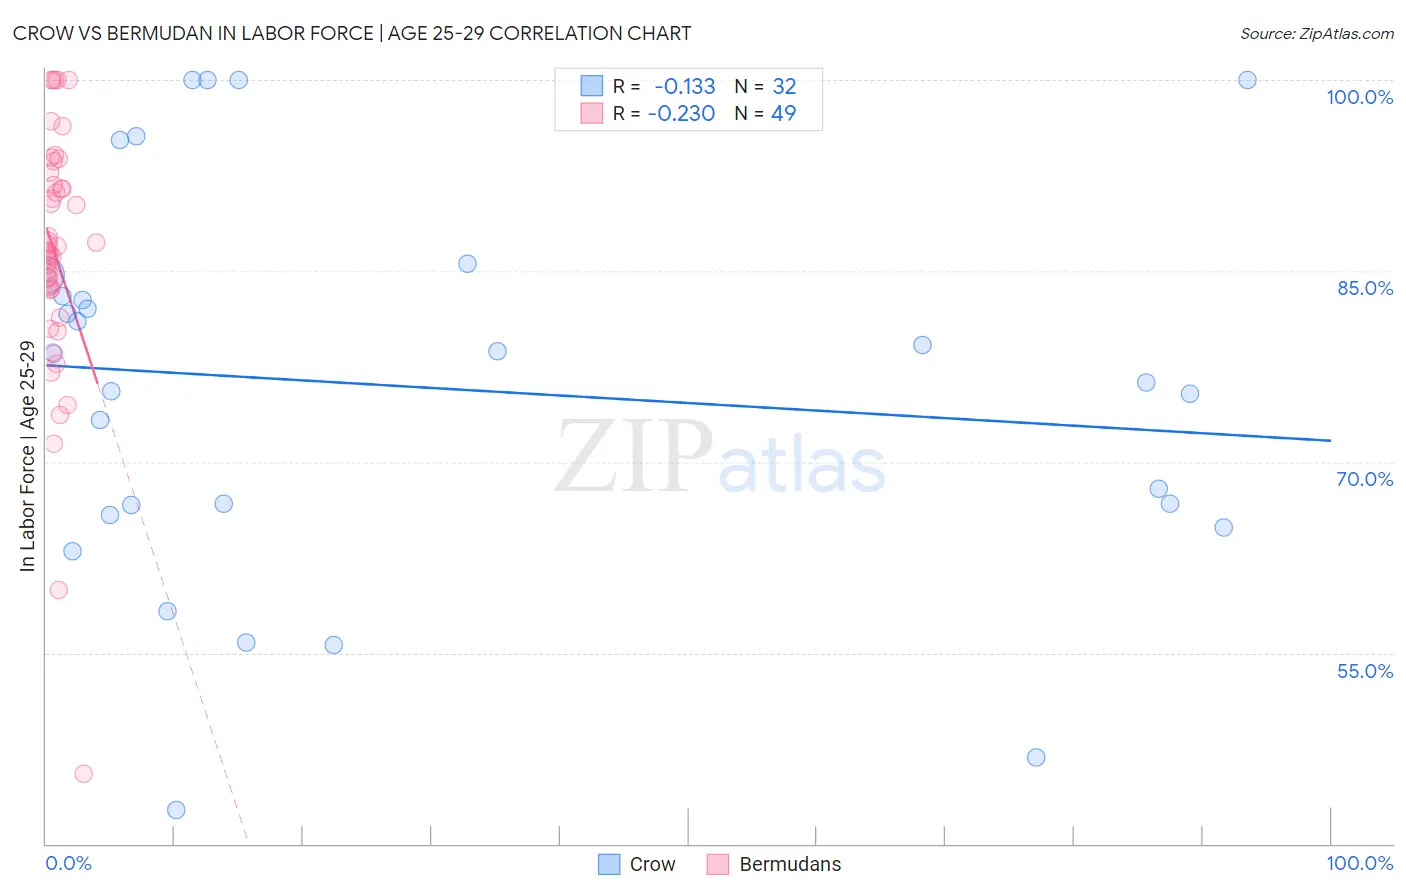
Crow vs Bermudan In Labor Force | Age 25-29 Correlation Chart
The statistical analysis conducted on geographies consisting of 59,193,680 people shows a poor negative correlation between the proportion of Crow and labor force participation rate among population between the ages 25 and 29 in the United States with a correlation coefficient (R) of -0.133 and weighted average of 78.6%. Similarly, the statistical analysis conducted on geographies consisting of 55,723,505 people shows a weak negative correlation between the proportion of Bermudans and labor force participation rate among population between the ages 25 and 29 in the United States with a correlation coefficient (R) of -0.230 and weighted average of 86.0%, a difference of 9.5%.
In Labor Force | Age 25-29 Correlation Summary
| Measurement | Crow | Bermudan |
| Minimum | 42.7% | 45.5% |
| Maximum | 100.0% | 100.0% |
| Range | 57.3% | 54.5% |
| Mean | 75.9% | 86.3% |
| Median | 77.3% | 86.6% |
| Interquartile 25% (IQ1) | 66.2% | 83.5% |
| Interquartile 75% (IQ3) | 83.9% | 92.2% |
| Interquartile Range (IQR) | 17.6% | 8.7% |
| Standard Deviation (Sample) | 15.3% | 10.0% |
| Standard Deviation (Population) | 15.1% | 9.9% |
Similar Demographics by In Labor Force | Age 25-29
Demographics Similar to Crow by In Labor Force | Age 25-29
In terms of in labor force | age 25-29, the demographic groups most similar to Crow are Lumbee (78.3%, a difference of 0.37%), Immigrants from Yemen (78.2%, a difference of 0.49%), Paiute (78.1%, a difference of 0.65%), Apache (79.2%, a difference of 0.76%), and Native/Alaskan (79.3%, a difference of 0.83%).
| Demographics | Rating | Rank | In Labor Force | Age 25-29 |
| Puerto Ricans | 0.0 /100 | #330 | Tragic 80.4% |
| Cheyenne | 0.0 /100 | #331 | Tragic 80.3% |
| Inupiat | 0.0 /100 | #332 | Tragic 79.8% |
| Sioux | 0.0 /100 | #333 | Tragic 79.7% |
| Yuman | 0.0 /100 | #334 | Tragic 79.3% |
| Natives/Alaskans | 0.0 /100 | #335 | Tragic 79.3% |
| Apache | 0.0 /100 | #336 | Tragic 79.2% |
| Crow | 0.0 /100 | #337 | Tragic 78.6% |
| Lumbee | 0.0 /100 | #338 | Tragic 78.3% |
| Immigrants | Yemen | 0.0 /100 | #339 | Tragic 78.2% |
| Paiute | 0.0 /100 | #340 | Tragic 78.1% |
| Tohono O'odham | 0.0 /100 | #341 | Tragic 77.5% |
| Pueblo | 0.0 /100 | #342 | Tragic 77.5% |
| Arapaho | 0.0 /100 | #343 | Tragic 76.6% |
| Hopi | 0.0 /100 | #344 | Tragic 76.5% |
Demographics Similar to Bermudans by In Labor Force | Age 25-29
In terms of in labor force | age 25-29, the demographic groups most similar to Bermudans are Bulgarian (86.0%, a difference of 0.030%), Immigrants from Bolivia (86.1%, a difference of 0.040%), Cape Verdean (86.0%, a difference of 0.040%), Latvian (86.1%, a difference of 0.050%), and Bolivian (86.1%, a difference of 0.050%).
| Demographics | Rating | Rank | In Labor Force | Age 25-29 |
| Liberians | 100.0 /100 | #10 | Exceptional 86.1% |
| Immigrants | Ethiopia | 100.0 /100 | #11 | Exceptional 86.1% |
| Immigrants | Lithuania | 100.0 /100 | #12 | Exceptional 86.1% |
| Norwegians | 100.0 /100 | #13 | Exceptional 86.1% |
| Latvians | 100.0 /100 | #14 | Exceptional 86.1% |
| Bolivians | 100.0 /100 | #15 | Exceptional 86.1% |
| Immigrants | Bolivia | 100.0 /100 | #16 | Exceptional 86.1% |
| Bermudans | 100.0 /100 | #17 | Exceptional 86.0% |
| Bulgarians | 100.0 /100 | #18 | Exceptional 86.0% |
| Cape Verdeans | 100.0 /100 | #19 | Exceptional 86.0% |
| Immigrants | Ireland | 100.0 /100 | #20 | Exceptional 86.0% |
| Maltese | 100.0 /100 | #21 | Exceptional 86.0% |
| Cambodians | 100.0 /100 | #22 | Exceptional 86.0% |
| Immigrants | Uganda | 100.0 /100 | #23 | Exceptional 86.0% |
| Immigrants | Eastern Africa | 100.0 /100 | #24 | Exceptional 86.0% |