Creek vs Samoan In Labor Force | Age 30-34
COMPARE
Creek
Samoan
In Labor Force | Age 30-34
In Labor Force | Age 30-34 Comparison
Creek
Samoans
80.4%
IN LABOR FORCE | AGE 30-34
0.0/ 100
METRIC RATING
329th/ 347
METRIC RANK
83.3%
IN LABOR FORCE | AGE 30-34
0.0/ 100
METRIC RATING
281st/ 347
METRIC RANK
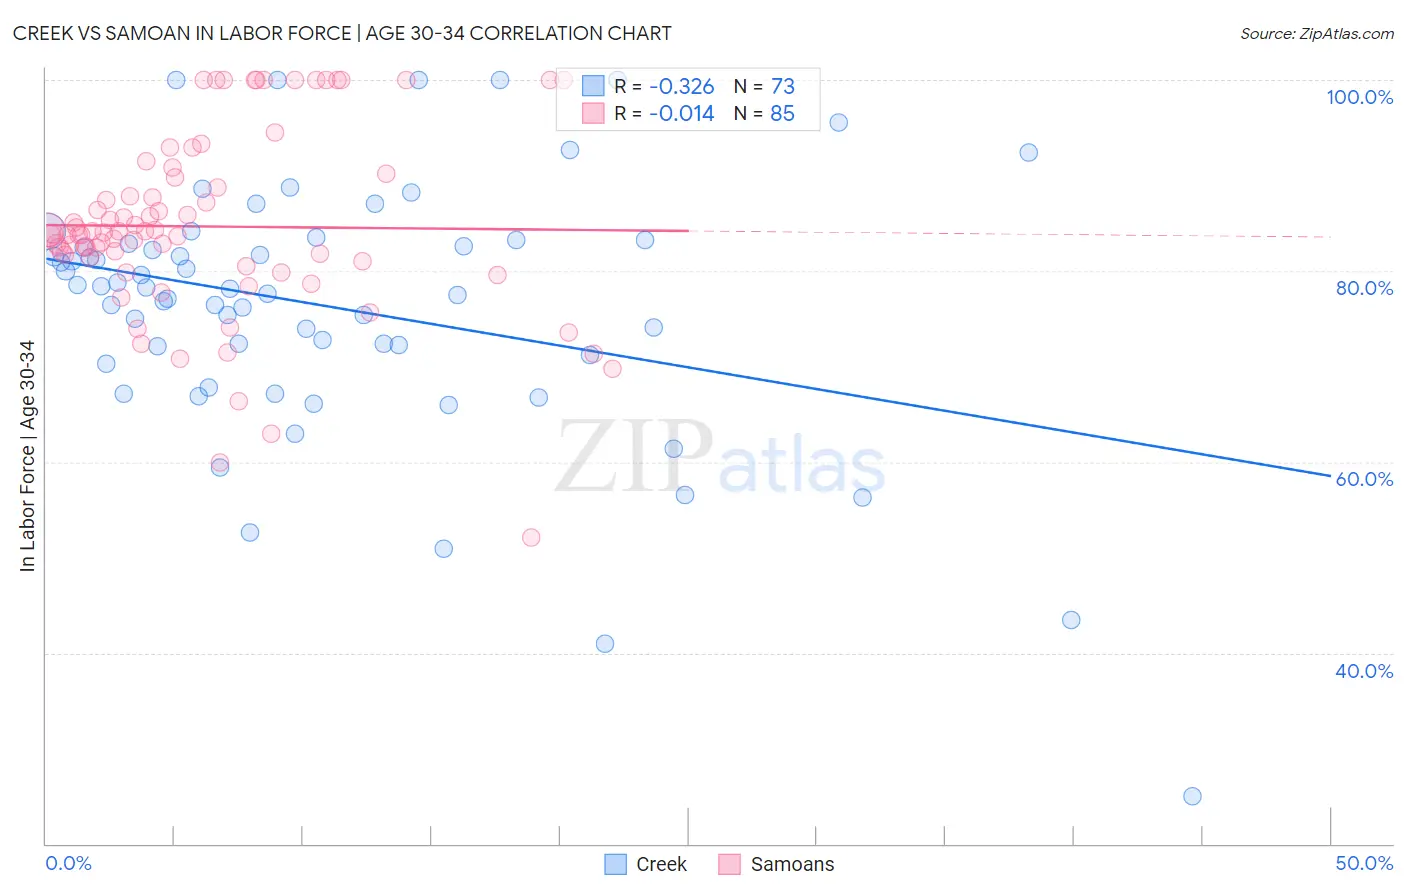
Creek vs Samoan In Labor Force | Age 30-34 Correlation Chart
The statistical analysis conducted on geographies consisting of 178,425,767 people shows a mild negative correlation between the proportion of Creek and labor force participation rate among population between the ages 30 and 34 in the United States with a correlation coefficient (R) of -0.326 and weighted average of 80.4%. Similarly, the statistical analysis conducted on geographies consisting of 225,110,068 people shows no correlation between the proportion of Samoans and labor force participation rate among population between the ages 30 and 34 in the United States with a correlation coefficient (R) of -0.014 and weighted average of 83.3%, a difference of 3.6%.
In Labor Force | Age 30-34 Correlation Summary
| Measurement | Creek | Samoan |
| Minimum | 25.0% | 52.1% |
| Maximum | 100.0% | 100.0% |
| Range | 75.0% | 47.9% |
| Mean | 76.2% | 84.7% |
| Median | 78.2% | 83.9% |
| Interquartile 25% (IQ1) | 70.7% | 80.7% |
| Interquartile 75% (IQ3) | 83.1% | 90.0% |
| Interquartile Range (IQR) | 12.4% | 9.2% |
| Standard Deviation (Sample) | 13.7% | 9.8% |
| Standard Deviation (Population) | 13.6% | 9.7% |
Similar Demographics by In Labor Force | Age 30-34
Demographics Similar to Creek by In Labor Force | Age 30-34
In terms of in labor force | age 30-34, the demographic groups most similar to Creek are Sioux (80.4%, a difference of 0.010%), Pueblo (80.0%, a difference of 0.40%), Colville (80.7%, a difference of 0.41%), Houma (79.9%, a difference of 0.58%), and Seminole (80.8%, a difference of 0.60%).
| Demographics | Rating | Rank | In Labor Force | Age 30-34 |
| Puerto Ricans | 0.0 /100 | #322 | Tragic 81.2% |
| Paiute | 0.0 /100 | #323 | Tragic 81.2% |
| Cheyenne | 0.0 /100 | #324 | Tragic 81.1% |
| Dutch West Indians | 0.0 /100 | #325 | Tragic 81.0% |
| Seminole | 0.0 /100 | #326 | Tragic 80.8% |
| Colville | 0.0 /100 | #327 | Tragic 80.7% |
| Sioux | 0.0 /100 | #328 | Tragic 80.4% |
| Creek | 0.0 /100 | #329 | Tragic 80.4% |
| Pueblo | 0.0 /100 | #330 | Tragic 80.0% |
| Houma | 0.0 /100 | #331 | Tragic 79.9% |
| Kiowa | 0.0 /100 | #332 | Tragic 79.8% |
| Inupiat | 0.0 /100 | #333 | Tragic 79.7% |
| Hopi | 0.0 /100 | #334 | Tragic 79.3% |
| Marshallese | 0.0 /100 | #335 | Tragic 79.2% |
| Natives/Alaskans | 0.0 /100 | #336 | Tragic 79.2% |
Demographics Similar to Samoans by In Labor Force | Age 30-34
In terms of in labor force | age 30-34, the demographic groups most similar to Samoans are Mexican American Indian (83.2%, a difference of 0.040%), Assyrian/Chaldean/Syriac (83.2%, a difference of 0.050%), Immigrants from Belize (83.2%, a difference of 0.10%), Cree (83.2%, a difference of 0.10%), and African (83.4%, a difference of 0.14%).
| Demographics | Rating | Rank | In Labor Force | Age 30-34 |
| Belizeans | 0.0 /100 | #274 | Tragic 83.5% |
| Immigrants | Grenada | 0.0 /100 | #275 | Tragic 83.5% |
| Tongans | 0.0 /100 | #276 | Tragic 83.5% |
| Delaware | 0.0 /100 | #277 | Tragic 83.5% |
| Fijians | 0.0 /100 | #278 | Tragic 83.4% |
| Immigrants | Fiji | 0.0 /100 | #279 | Tragic 83.4% |
| Africans | 0.0 /100 | #280 | Tragic 83.4% |
| Samoans | 0.0 /100 | #281 | Tragic 83.3% |
| Mexican American Indians | 0.0 /100 | #282 | Tragic 83.2% |
| Assyrians/Chaldeans/Syriacs | 0.0 /100 | #283 | Tragic 83.2% |
| Immigrants | Belize | 0.0 /100 | #284 | Tragic 83.2% |
| Cree | 0.0 /100 | #285 | Tragic 83.2% |
| Immigrants | Latin America | 0.0 /100 | #286 | Tragic 83.1% |
| Native Hawaiians | 0.0 /100 | #287 | Tragic 83.0% |
| Central American Indians | 0.0 /100 | #288 | Tragic 83.0% |