Colombian vs Cypriot In Labor Force | Age 20-24
COMPARE
Colombian
Cypriot
In Labor Force | Age 20-24
In Labor Force | Age 20-24 Comparison
Colombians
Cypriots
73.5%
IN LABOR FORCE | AGE 20-24
0.3/ 100
METRIC RATING
269th/ 347
METRIC RANK
73.3%
IN LABOR FORCE | AGE 20-24
0.2/ 100
METRIC RATING
278th/ 347
METRIC RANK
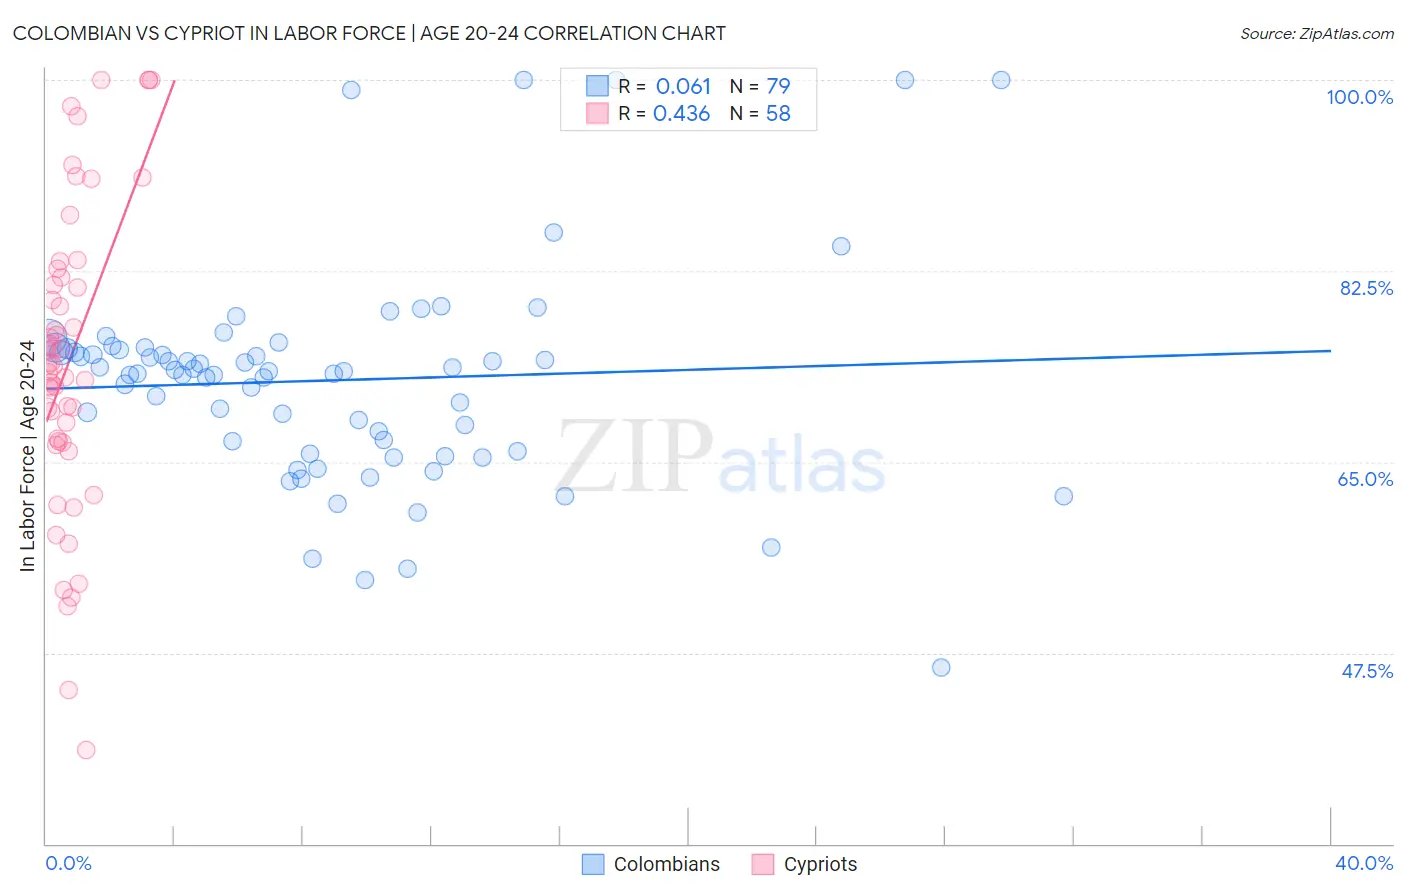
Colombian vs Cypriot In Labor Force | Age 20-24 Correlation Chart
The statistical analysis conducted on geographies consisting of 419,536,889 people shows a slight positive correlation between the proportion of Colombians and labor force participation rate among population between the ages 20 and 24 in the United States with a correlation coefficient (R) of 0.061 and weighted average of 73.5%. Similarly, the statistical analysis conducted on geographies consisting of 61,866,486 people shows a moderate positive correlation between the proportion of Cypriots and labor force participation rate among population between the ages 20 and 24 in the United States with a correlation coefficient (R) of 0.436 and weighted average of 73.3%, a difference of 0.24%.
In Labor Force | Age 20-24 Correlation Summary
| Measurement | Colombian | Cypriot |
| Minimum | 46.2% | 38.6% |
| Maximum | 100.0% | 100.0% |
| Range | 53.8% | 61.4% |
| Mean | 72.5% | 74.4% |
| Median | 73.3% | 73.9% |
| Interquartile 25% (IQ1) | 66.0% | 66.9% |
| Interquartile 75% (IQ3) | 75.4% | 81.9% |
| Interquartile Range (IQR) | 9.4% | 15.0% |
| Standard Deviation (Sample) | 9.9% | 13.9% |
| Standard Deviation (Population) | 9.8% | 13.8% |
Demographics Similar to Colombians and Cypriots by In Labor Force | Age 20-24
In terms of in labor force | age 20-24, the demographic groups most similar to Colombians are South American (73.5%, a difference of 0.030%), Immigrants from Russia (73.5%, a difference of 0.030%), Immigrants from Western Asia (73.5%, a difference of 0.080%), Immigrants from Indonesia (73.4%, a difference of 0.090%), and Belizean (73.4%, a difference of 0.10%). Similarly, the demographic groups most similar to Cypriots are Venezuelan (73.3%, a difference of 0.010%), Immigrants from Malaysia (73.3%, a difference of 0.020%), Mongolian (73.3%, a difference of 0.030%), Immigrants from South America (73.3%, a difference of 0.040%), and Bahamian (73.3%, a difference of 0.080%).
| Demographics | Rating | Rank | In Labor Force | Age 20-24 |
| Immigrants | Asia | 0.5 /100 | #263 | Tragic 73.6% |
| Immigrants | Haiti | 0.5 /100 | #264 | Tragic 73.6% |
| Burmese | 0.5 /100 | #265 | Tragic 73.6% |
| Haitians | 0.5 /100 | #266 | Tragic 73.6% |
| Immigrants | Western Asia | 0.4 /100 | #267 | Tragic 73.5% |
| South Americans | 0.4 /100 | #268 | Tragic 73.5% |
| Colombians | 0.3 /100 | #269 | Tragic 73.5% |
| Immigrants | Russia | 0.3 /100 | #270 | Tragic 73.5% |
| Immigrants | Indonesia | 0.3 /100 | #271 | Tragic 73.4% |
| Belizeans | 0.3 /100 | #272 | Tragic 73.4% |
| Cheyenne | 0.2 /100 | #273 | Tragic 73.4% |
| Immigrants | Colombia | 0.2 /100 | #274 | Tragic 73.4% |
| Immigrants | South America | 0.2 /100 | #275 | Tragic 73.3% |
| Mongolians | 0.2 /100 | #276 | Tragic 73.3% |
| Immigrants | Malaysia | 0.2 /100 | #277 | Tragic 73.3% |
| Cypriots | 0.2 /100 | #278 | Tragic 73.3% |
| Venezuelans | 0.2 /100 | #279 | Tragic 73.3% |
| Bahamians | 0.1 /100 | #280 | Tragic 73.3% |
| Immigrants | Venezuela | 0.1 /100 | #281 | Tragic 73.2% |
| Immigrants | Spain | 0.1 /100 | #282 | Tragic 73.2% |
| Immigrants | Bahamas | 0.1 /100 | #283 | Tragic 73.2% |