Central American vs Slavic In Labor Force | Age 30-34

COMPARE

Central American
Race
Ancestry
AfghanAfricanAlaska NativeAlaskan AthabascanAlbanianAleutAlsatianAmericanApacheArabArapahoArgentineanArmenianAssyrian/Chaldean/SyriacAustralianAustrianBahamianBangladeshiBarbadianBasqueBelgianBelizeanBermudanBhutaneseBlackfeetBolivianBrazilianBritishBritish West IndianBulgarianBurmeseCajunCambodianCanadianCape VerdeanCarpatho RusynCelticCentral AmericanCentral American IndianCherokeeCheyenneChickasawChileanChineseChippewaChoctawColombianColvilleComancheCosta RicanCreeCreekCroatianCrowCubanCypriotCzechCzechoslovakianDanishDelawareDominicanDutchDutch West IndianEastern EuropeanEcuadorianEgyptianEnglishEstonianEthiopianEuropeanFijianFilipinoFinnishFrenchFrench American IndianFrench CanadianGermanGerman RussianGhanaianGreekGuamanian/ChamorroGuatemalanGuyaneseHaitianHmongHonduranHopiHoumaHungarianIcelanderIndian (Asian)IndonesianInupiatIranianIraqiIrishIroquoisIsraeliItalianJamaicanJapaneseJordanianKenyanKiowaKoreanLaotianLatvianLebaneseLiberianLithuanianLumbeeLuxembourgerMacedonianMalaysianMalteseMarshalleseMenomineeMexicanMexican American IndianMongolianMoroccanNative HawaiianNavajoNepaleseNew ZealanderNicaraguanNigerianNorthern EuropeanNorwegianOkinawanOsageOttawaPaiutePakistaniPalestinianPanamanianParaguayanPennsylvania GermanPeruvianPimaPolishPortuguesePotawatomiPuebloPuerto RicanPuget Sound SalishRomanianRussianSalvadoranSamoanScandinavianScotch-IrishScottishSeminoleSenegaleseSerbianShoshoneSierra LeoneanSiouxSlovakSloveneSomaliSouth AfricanSouth AmericanSouth American IndianSoviet UnionSpaniardSpanishSpanish AmericanSpanish American IndianSri LankanSubsaharan AfricanSudaneseSwedishSwissSyrianTaiwaneseThaiTlingit-HaidaTohono O'OdhamTonganTrinidadian and TobagonianTsimshianTurkishU.S. Virgin IslanderUgandanUkrainianUruguayanUteVenezuelanVietnameseWelshWest IndianYakamaYaquiYugoslavianYumanYup'ikZimbabwean
Immigration
NonimmigrantsImmigrantsAfghanistanAfricaAlbaniaArgentinaArmeniaAsiaAustraliaAustriaBahamasBangladeshBarbadosBelarusBelgiumBelizeBoliviaBosnia and HerzegovinaBrazilBulgariaBurma/MyanmarCabo VerdeCambodiaCameroonCanadaCaribbeanCentral AmericaChileChinaColombiaCongoCosta RicaCroatiaCubaCzechoslovakiaDenmarkDominicaDominican RepublicEastern AfricaEastern AsiaEastern EuropeEcuadorEgyptEl SalvadorEnglandEritreaEthiopiaEuropeFijiFranceGermanyGhanaGreeceGrenadaGuatemalaGuyanaHaitiHondurasHong KongHungaryIndiaIndonesiaIranIraqIrelandIsraelItalyJamaicaJapanJordanKazakhstanKenyaKoreaKuwaitLaosLatin AmericaLatviaLebanonLiberiaLithuaniaMalaysiaMexicoMicronesiaMiddle AfricaMoldovaMoroccoNepalNetherlandsNicaraguaNigeriaNorth AmericaNorth MacedoniaNorthern AfricaNorthern EuropeNorwayOceaniaPakistanPanamaPeruPhilippinesPolandPortugalRomaniaRussiaSaudi ArabiaScotlandSenegalSerbiaSierra LeoneSingaporeSomaliaSouth AfricaSouth AmericaSouth Central AsiaSouth Eastern AsiaSouthern EuropeSpainSri LankaSt. Vincent and the GrenadinesSudanSwedenSwitzerlandSyriaTaiwanThailandTrinidad and TobagoTurkeyUgandaUkraineUruguayUzbekistanVenezuelaVietnamWest IndiesWestern AfricaWestern AsiaWestern EuropeYemenZaireZimbabweAzores
Slavic
Race
Ancestry
AfghanAfricanAlaska NativeAlaskan AthabascanAlbanianAleutAlsatianAmericanApacheArabArapahoArgentineanArmenianAssyrian/Chaldean/SyriacAustralianAustrianBahamianBangladeshiBarbadianBasqueBelgianBelizeanBermudanBhutaneseBlackfeetBolivianBrazilianBritishBritish West IndianBulgarianBurmeseCajunCambodianCanadianCape VerdeanCarpatho RusynCelticCentral American IndianCherokeeCheyenneChickasawChileanChineseChippewaChoctawColombianColvilleComancheCosta RicanCreeCreekCroatianCrowCubanCypriotCzechCzechoslovakianDanishDelawareDominicanDutchDutch West IndianEastern EuropeanEcuadorianEgyptianEnglishEstonianEthiopianEuropeanFijianFilipinoFinnishFrenchFrench American IndianFrench CanadianGermanGerman RussianGhanaianGreekGuamanian/ChamorroGuatemalanGuyaneseHaitianHmongHonduranHopiHoumaHungarianIcelanderIndian (Asian)IndonesianInupiatIranianIraqiIrishIroquoisIsraeliItalianJamaicanJapaneseJordanianKenyanKiowaKoreanLaotianLatvianLebaneseLiberianLithuanianLumbeeLuxembourgerMacedonianMalaysianMalteseMarshalleseMenomineeMexicanMexican American IndianMongolianMoroccanNative HawaiianNavajoNepaleseNew ZealanderNicaraguanNigerianNorthern EuropeanNorwegianOkinawanOsageOttawaPaiutePakistaniPalestinianPanamanianParaguayanPennsylvania GermanPeruvianPimaPolishPortuguesePotawatomiPuebloPuerto RicanPuget Sound SalishRomanianRussianSalvadoranSamoanScandinavianScotch-IrishScottishSeminoleSenegaleseSerbianShoshoneSierra LeoneanSiouxSlavicSlovakSloveneSomaliSouth AfricanSouth AmericanSouth American IndianSoviet UnionSpaniardSpanishSpanish AmericanSpanish American IndianSri LankanSubsaharan AfricanSudaneseSwedishSwissSyrianTaiwaneseThaiTlingit-HaidaTohono O'OdhamTonganTrinidadian and TobagonianTsimshianTurkishU.S. Virgin IslanderUgandanUkrainianUruguayanUteVenezuelanVietnameseWelshWest IndianYakamaYaquiYugoslavianYumanYup'ikZimbabwean
Immigration
NonimmigrantsImmigrantsAfghanistanAfricaAlbaniaArgentinaArmeniaAsiaAustraliaAustriaBahamasBangladeshBarbadosBelarusBelgiumBelizeBoliviaBosnia and HerzegovinaBrazilBulgariaBurma/MyanmarCabo VerdeCambodiaCameroonCanadaCaribbeanCentral AmericaChileChinaColombiaCongoCosta RicaCroatiaCubaCzechoslovakiaDenmarkDominicaDominican RepublicEastern AfricaEastern AsiaEastern EuropeEcuadorEgyptEl SalvadorEnglandEritreaEthiopiaEuropeFijiFranceGermanyGhanaGreeceGrenadaGuatemalaGuyanaHaitiHondurasHong KongHungaryIndiaIndonesiaIranIraqIrelandIsraelItalyJamaicaJapanJordanKazakhstanKenyaKoreaKuwaitLaosLatin AmericaLatviaLebanonLiberiaLithuaniaMalaysiaMexicoMicronesiaMiddle AfricaMoldovaMoroccoNepalNetherlandsNicaraguaNigeriaNorth AmericaNorth MacedoniaNorthern AfricaNorthern EuropeNorwayOceaniaPakistanPanamaPeruPhilippinesPolandPortugalRomaniaRussiaSaudi ArabiaScotlandSenegalSerbiaSierra LeoneSingaporeSomaliaSouth AfricaSouth AmericaSouth Central AsiaSouth Eastern AsiaSouthern EuropeSpainSri LankaSt. Vincent and the GrenadinesSudanSwedenSwitzerlandSyriaTaiwanThailandTrinidad and TobagoTurkeyUgandaUkraineUruguayUzbekistanVenezuelaVietnamWest IndiesWestern AfricaWestern AsiaWestern EuropeYemenZaireZimbabweAzores
In Labor Force | Age 30-34
Income
Poverty
Unemployment
Labor Participation
Family Structure
Vehicle Availability
Education Level
Disability

In Labor Force | Age 30-34 Comparison

Central Americans

Slavs

Tragic
Exceptional
84.0%
IN LABOR FORCE | AGE 30-34
0.9/ 100
METRIC RATING
246th/ 347
METRIC RANK
85.0%
IN LABOR FORCE | AGE 30-34
90.7/ 100
METRIC RATING
127th/ 347
METRIC RANK

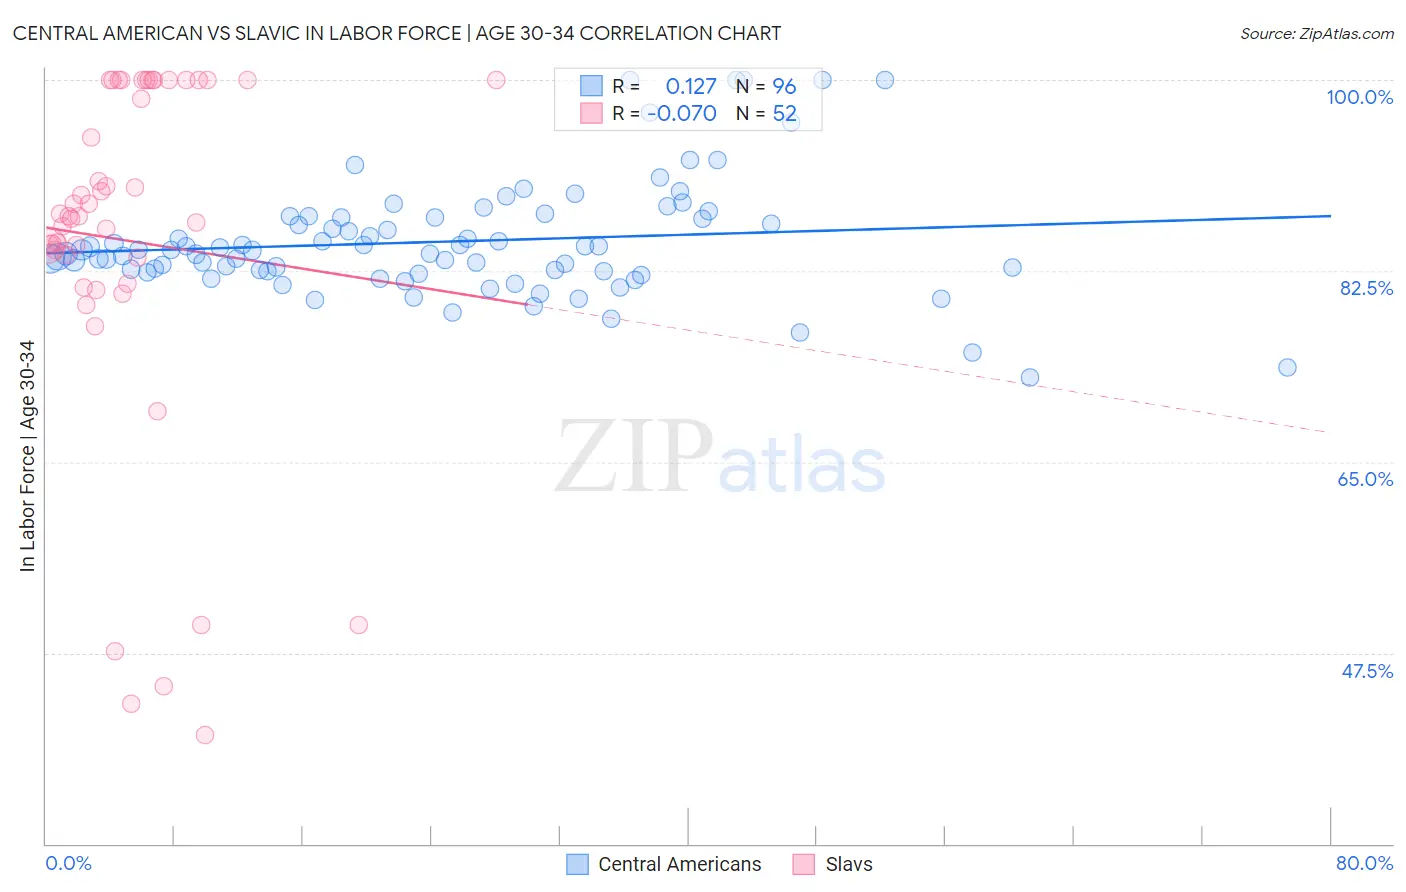
Central American vs Slavic In Labor Force | Age 30-34 Correlation Chart

The statistical analysis conducted on geographies consisting of 504,052,448 people shows a poor positive correlation between the proportion of Central Americans and labor force participation rate among population between the ages 30 and 34 in the United States with a correlation coefficient (R) of 0.127 and weighted average of 84.0%. Similarly, the statistical analysis conducted on geographies consisting of 270,763,521 people shows a slight negative correlation between the proportion of Slavs and labor force participation rate among population between the ages 30 and 34 in the United States with a correlation coefficient (R) of -0.070 and weighted average of 85.0%, a difference of 1.2%.
Central American vs Slavic In Labor Force | Age 30-34

In Labor Force | Age 30-34 Correlation Summary

MeasurementCentral AmericanSlavic
Minimum72.7%40.0%
Maximum100.0%100.0%
Range27.3%60.0%
Mean85.2%85.2%
Median84.4%87.5%
Interquartile 25% (IQ1)82.5%82.5%
Interquartile 75% (IQ3)87.4%100.0%
Interquartile Range (IQR)4.9%17.5%
Standard Deviation (Sample)5.3%16.3%
Standard Deviation (Population)5.3%16.1%

Similar Demographics by In Labor Force | Age 30-34

Demographics Similar to Central Americans by In Labor Force | Age 30-34

In terms of in labor force | age 30-34, the demographic groups most similar to Central Americans are Basque (84.0%, a difference of 0.0%), Immigrants from Venezuela (84.0%, a difference of 0.0%), British West Indian (84.0%, a difference of 0.020%), Immigrants from Caribbean (84.0%, a difference of 0.030%), and Portuguese (84.0%, a difference of 0.030%).
DemographicsRating | RankIn Labor Force | Age 30-34
English
1.4
/100
|
#239
Tragic
84.0%
Venezuelans
1.3
/100
|
#240
Tragic
84.0%
Immigrants | Portugal
1.2
/100
|
#241
Tragic
84.0%
Immigrants | Oceania
1.1
/100
|
#242
Tragic
84.0%
Immigrants | Caribbean
1.1
/100
|
#243
Tragic
84.0%
Basques
0.9
/100
|
#244
Tragic
84.0%
Immigrants | Venezuela
0.9
/100
|
#245
Tragic
84.0%
Central Americans
0.9
/100
|
#246
Tragic
84.0%
British West Indians
0.8
/100
|
#247
Tragic
84.0%
Portuguese
0.8
/100
|
#248
Tragic
84.0%
Immigrants | Dominica
0.7
/100
|
#249
Tragic
84.0%
Immigrants | Iraq
0.7
/100
|
#250
Tragic
83.9%
Nicaraguans
0.6
/100
|
#251
Tragic
83.9%
Bahamians
0.6
/100
|
#252
Tragic
83.9%
Immigrants | Nicaragua
0.6
/100
|
#253
Tragic
83.9%

Demographics Similar to Slavs by In Labor Force | Age 30-34

In terms of in labor force | age 30-34, the demographic groups most similar to Slavs are Austrian (85.0%, a difference of 0.0%), Immigrants from Argentina (85.0%, a difference of 0.0%), Immigrants from Western Africa (85.0%, a difference of 0.010%), Immigrants from Spain (85.0%, a difference of 0.010%), and Immigrants from Jordan (85.0%, a difference of 0.020%).
DemographicsRating | RankIn Labor Force | Age 30-34
Immigrants | Southern Europe
93.3
/100
|
#120
Exceptional
85.1%
Immigrants | Egypt
93.2
/100
|
#121
Exceptional
85.1%
Immigrants | Kuwait
92.6
/100
|
#122
Exceptional
85.1%
Armenians
92.2
/100
|
#123
Exceptional
85.0%
Australians
92.0
/100
|
#124
Exceptional
85.0%
Immigrants | Jordan
91.5
/100
|
#125
Exceptional
85.0%
Austrians
90.9
/100
|
#126
Exceptional
85.0%
Slavs
90.7
/100
|
#127
Exceptional
85.0%
Immigrants | Argentina
90.6
/100
|
#128
Exceptional
85.0%
Immigrants | Western Africa
90.2
/100
|
#129
Exceptional
85.0%
Immigrants | Spain
90.0
/100
|
#130
Exceptional
85.0%
Chinese
89.6
/100
|
#131
Excellent
85.0%
Immigrants | Israel
89.5
/100
|
#132
Excellent
85.0%
New Zealanders
89.5
/100
|
#133
Excellent
85.0%
Immigrants | Chile
89.2
/100
|
#134
Excellent
85.0%