Central American Indian vs Black/African American In Labor Force | Age 16-19
COMPARE
Central American Indian
Black/African American
In Labor Force | Age 16-19
In Labor Force | Age 16-19 Comparison
Central American Indians
Blacks/African Americans
34.1%
IN LABOR FORCE | AGE 16-19
0.4/ 100
METRIC RATING
271st/ 347
METRIC RANK
36.5%
IN LABOR FORCE | AGE 16-19
45.1/ 100
METRIC RATING
178th/ 347
METRIC RANK
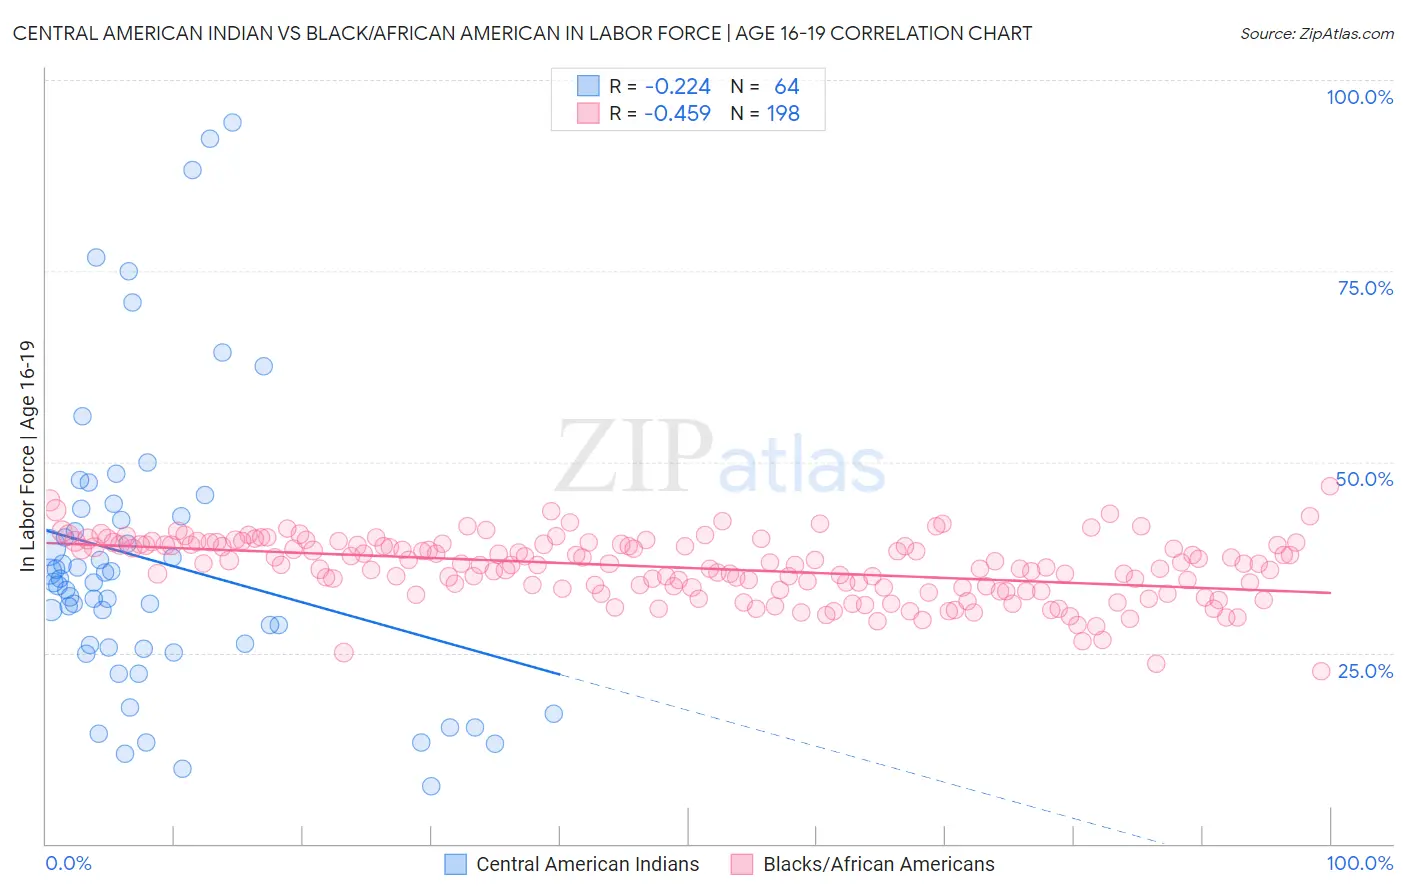
Central American Indian vs Black/African American In Labor Force | Age 16-19 Correlation Chart
The statistical analysis conducted on geographies consisting of 325,854,393 people shows a weak negative correlation between the proportion of Central American Indians and labor force participation rate among population between the ages 16 and 19 in the United States with a correlation coefficient (R) of -0.224 and weighted average of 34.1%. Similarly, the statistical analysis conducted on geographies consisting of 562,399,773 people shows a moderate negative correlation between the proportion of Blacks/African Americans and labor force participation rate among population between the ages 16 and 19 in the United States with a correlation coefficient (R) of -0.459 and weighted average of 36.5%, a difference of 7.1%.
In Labor Force | Age 16-19 Correlation Summary
| Measurement | Central American Indian | Black/African American |
| Minimum | 7.5% | 22.6% |
| Maximum | 94.4% | 46.8% |
| Range | 86.9% | 24.2% |
| Mean | 37.0% | 36.1% |
| Median | 34.2% | 36.6% |
| Interquartile 25% (IQ1) | 25.6% | 33.5% |
| Interquartile 75% (IQ3) | 43.4% | 39.2% |
| Interquartile Range (IQR) | 17.8% | 5.7% |
| Standard Deviation (Sample) | 19.3% | 4.1% |
| Standard Deviation (Population) | 19.2% | 4.1% |
Similar Demographics by In Labor Force | Age 16-19
Demographics Similar to Central American Indians by In Labor Force | Age 16-19
In terms of in labor force | age 16-19, the demographic groups most similar to Central American Indians are Immigrants from Russia (34.1%, a difference of 0.0%), Asian (34.1%, a difference of 0.030%), Pima (34.1%, a difference of 0.050%), Immigrants from Asia (34.1%, a difference of 0.13%), and Immigrants from Panama (34.0%, a difference of 0.24%).
| Demographics | Rating | Rank | In Labor Force | Age 16-19 |
| Immigrants | Uruguay | 0.9 /100 | #264 | Tragic 34.4% |
| Immigrants | El Salvador | 0.7 /100 | #265 | Tragic 34.3% |
| Immigrants | Malaysia | 0.7 /100 | #266 | Tragic 34.3% |
| Immigrants | Peru | 0.5 /100 | #267 | Tragic 34.2% |
| Immigrants | Asia | 0.5 /100 | #268 | Tragic 34.1% |
| Pima | 0.5 /100 | #269 | Tragic 34.1% |
| Immigrants | Russia | 0.4 /100 | #270 | Tragic 34.1% |
| Central American Indians | 0.4 /100 | #271 | Tragic 34.1% |
| Asians | 0.4 /100 | #272 | Tragic 34.1% |
| Immigrants | Panama | 0.4 /100 | #273 | Tragic 34.0% |
| Venezuelans | 0.3 /100 | #274 | Tragic 34.0% |
| Immigrants | Fiji | 0.3 /100 | #275 | Tragic 33.9% |
| Immigrants | Latin America | 0.3 /100 | #276 | Tragic 33.9% |
| Menominee | 0.3 /100 | #277 | Tragic 33.9% |
| Colombians | 0.3 /100 | #278 | Tragic 33.8% |
Demographics Similar to Blacks/African Americans by In Labor Force | Age 16-19
In terms of in labor force | age 16-19, the demographic groups most similar to Blacks/African Americans are Immigrants from Northern Europe (36.5%, a difference of 0.080%), Immigrants from Southern Europe (36.4%, a difference of 0.090%), Albanian (36.5%, a difference of 0.19%), Native/Alaskan (36.6%, a difference of 0.20%), and Immigrants from Morocco (36.4%, a difference of 0.21%).
| Demographics | Rating | Rank | In Labor Force | Age 16-19 |
| Immigrants | Cambodia | 58.4 /100 | #171 | Average 36.7% |
| South Africans | 58.3 /100 | #172 | Average 36.7% |
| Russians | 57.5 /100 | #173 | Average 36.7% |
| Immigrants | Czechoslovakia | 50.0 /100 | #174 | Average 36.6% |
| Natives/Alaskans | 49.0 /100 | #175 | Average 36.6% |
| Albanians | 48.8 /100 | #176 | Average 36.5% |
| Immigrants | Northern Europe | 46.6 /100 | #177 | Average 36.5% |
| Blacks/African Americans | 45.1 /100 | #178 | Average 36.5% |
| Immigrants | Southern Europe | 43.3 /100 | #179 | Average 36.4% |
| Immigrants | Morocco | 41.1 /100 | #180 | Average 36.4% |
| Jordanians | 39.6 /100 | #181 | Fair 36.4% |
| Immigrants | Italy | 39.1 /100 | #182 | Fair 36.4% |
| Eastern Europeans | 38.8 /100 | #183 | Fair 36.4% |
| Costa Ricans | 36.1 /100 | #184 | Fair 36.3% |
| Bhutanese | 35.3 /100 | #185 | Fair 36.3% |