Celtic vs Immigrants from Czechoslovakia In Labor Force | Age 25-29
COMPARE
Celtic
Immigrants from Czechoslovakia
In Labor Force | Age 25-29
In Labor Force | Age 25-29 Comparison
Celtics
Immigrants from Czechoslovakia
84.7%
IN LABOR FORCE | AGE 25-29
52.5/ 100
METRIC RATING
169th/ 347
METRIC RANK
85.4%
IN LABOR FORCE | AGE 25-29
99.3/ 100
METRIC RATING
65th/ 347
METRIC RANK
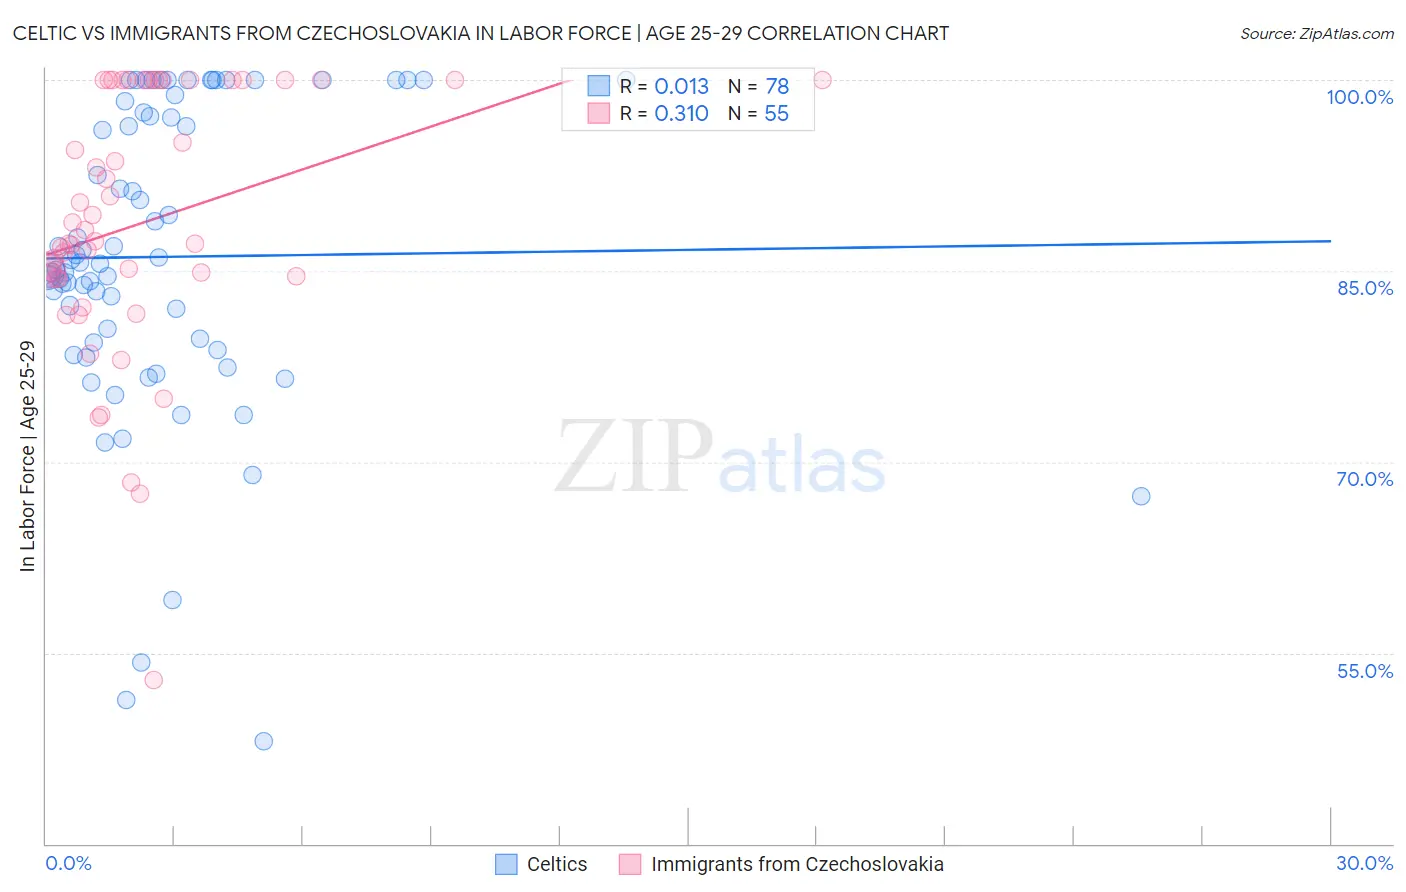
Celtic vs Immigrants from Czechoslovakia In Labor Force | Age 25-29 Correlation Chart
The statistical analysis conducted on geographies consisting of 168,838,785 people shows no correlation between the proportion of Celtics and labor force participation rate among population between the ages 25 and 29 in the United States with a correlation coefficient (R) of 0.013 and weighted average of 84.7%. Similarly, the statistical analysis conducted on geographies consisting of 195,420,999 people shows a mild positive correlation between the proportion of Immigrants from Czechoslovakia and labor force participation rate among population between the ages 25 and 29 in the United States with a correlation coefficient (R) of 0.310 and weighted average of 85.4%, a difference of 0.89%.
In Labor Force | Age 25-29 Correlation Summary
| Measurement | Celtic | Immigrants from Czechoslovakia |
| Minimum | 48.1% | 52.9% |
| Maximum | 100.0% | 100.0% |
| Range | 51.9% | 47.1% |
| Mean | 86.1% | 88.8% |
| Median | 85.6% | 87.4% |
| Interquartile 25% (IQ1) | 79.4% | 84.4% |
| Interquartile 75% (IQ3) | 97.5% | 100.0% |
| Interquartile Range (IQR) | 18.0% | 15.6% |
| Standard Deviation (Sample) | 12.0% | 10.2% |
| Standard Deviation (Population) | 11.9% | 10.1% |
Similar Demographics by In Labor Force | Age 25-29
Demographics Similar to Celtics by In Labor Force | Age 25-29
In terms of in labor force | age 25-29, the demographic groups most similar to Celtics are Tongan (84.7%, a difference of 0.0%), Immigrants from Vietnam (84.7%, a difference of 0.010%), Immigrants from Western Europe (84.7%, a difference of 0.010%), South American (84.7%, a difference of 0.020%), and Assyrian/Chaldean/Syriac (84.7%, a difference of 0.020%).
| Demographics | Rating | Rank | In Labor Force | Age 25-29 |
| Immigrants | Colombia | 58.3 /100 | #162 | Average 84.7% |
| Argentineans | 57.9 /100 | #163 | Average 84.7% |
| Ghanaians | 57.6 /100 | #164 | Average 84.7% |
| Immigrants | Burma/Myanmar | 57.4 /100 | #165 | Average 84.7% |
| Immigrants | Spain | 56.9 /100 | #166 | Average 84.7% |
| Indonesians | 56.5 /100 | #167 | Average 84.7% |
| South Americans | 54.9 /100 | #168 | Average 84.7% |
| Celtics | 52.5 /100 | #169 | Average 84.7% |
| Tongans | 52.4 /100 | #170 | Average 84.7% |
| Immigrants | Vietnam | 50.5 /100 | #171 | Average 84.7% |
| Immigrants | Western Europe | 50.4 /100 | #172 | Average 84.7% |
| Assyrians/Chaldeans/Syriacs | 50.2 /100 | #173 | Average 84.7% |
| Palestinians | 50.0 /100 | #174 | Average 84.7% |
| Hungarians | 47.8 /100 | #175 | Average 84.6% |
| Malaysians | 46.8 /100 | #176 | Average 84.6% |
Demographics Similar to Immigrants from Czechoslovakia by In Labor Force | Age 25-29
In terms of in labor force | age 25-29, the demographic groups most similar to Immigrants from Czechoslovakia are Immigrants from Italy (85.4%, a difference of 0.010%), Immigrants from Scotland (85.4%, a difference of 0.010%), Immigrants from Turkey (85.4%, a difference of 0.020%), Immigrants from Cameroon (85.4%, a difference of 0.020%), and Taiwanese (85.4%, a difference of 0.030%).
| Demographics | Rating | Rank | In Labor Force | Age 25-29 |
| Greeks | 99.6 /100 | #58 | Exceptional 85.5% |
| Immigrants | Morocco | 99.5 /100 | #59 | Exceptional 85.5% |
| Thais | 99.5 /100 | #60 | Exceptional 85.5% |
| Serbians | 99.5 /100 | #61 | Exceptional 85.5% |
| Taiwanese | 99.4 /100 | #62 | Exceptional 85.4% |
| Immigrants | Kenya | 99.4 /100 | #63 | Exceptional 85.4% |
| Immigrants | Italy | 99.3 /100 | #64 | Exceptional 85.4% |
| Immigrants | Czechoslovakia | 99.3 /100 | #65 | Exceptional 85.4% |
| Immigrants | Scotland | 99.3 /100 | #66 | Exceptional 85.4% |
| Immigrants | Turkey | 99.2 /100 | #67 | Exceptional 85.4% |
| Immigrants | Cameroon | 99.2 /100 | #68 | Exceptional 85.4% |
| Menominee | 99.1 /100 | #69 | Exceptional 85.4% |
| Immigrants | Sweden | 99.1 /100 | #70 | Exceptional 85.4% |
| Kenyans | 99.0 /100 | #71 | Exceptional 85.4% |
| Immigrants | Australia | 98.9 /100 | #72 | Exceptional 85.3% |