British West Indian vs Immigrants from Armenia In Labor Force | Age > 16
COMPARE
British West Indian
Immigrants from Armenia
In Labor Force | Age > 16
In Labor Force | Age > 16 Comparison
British West Indians
Immigrants from Armenia
64.4%
IN LABOR FORCE | AGE > 16
1.8/ 100
METRIC RATING
250th/ 347
METRIC RANK
65.3%
IN LABOR FORCE | AGE > 16
76.6/ 100
METRIC RATING
155th/ 347
METRIC RANK
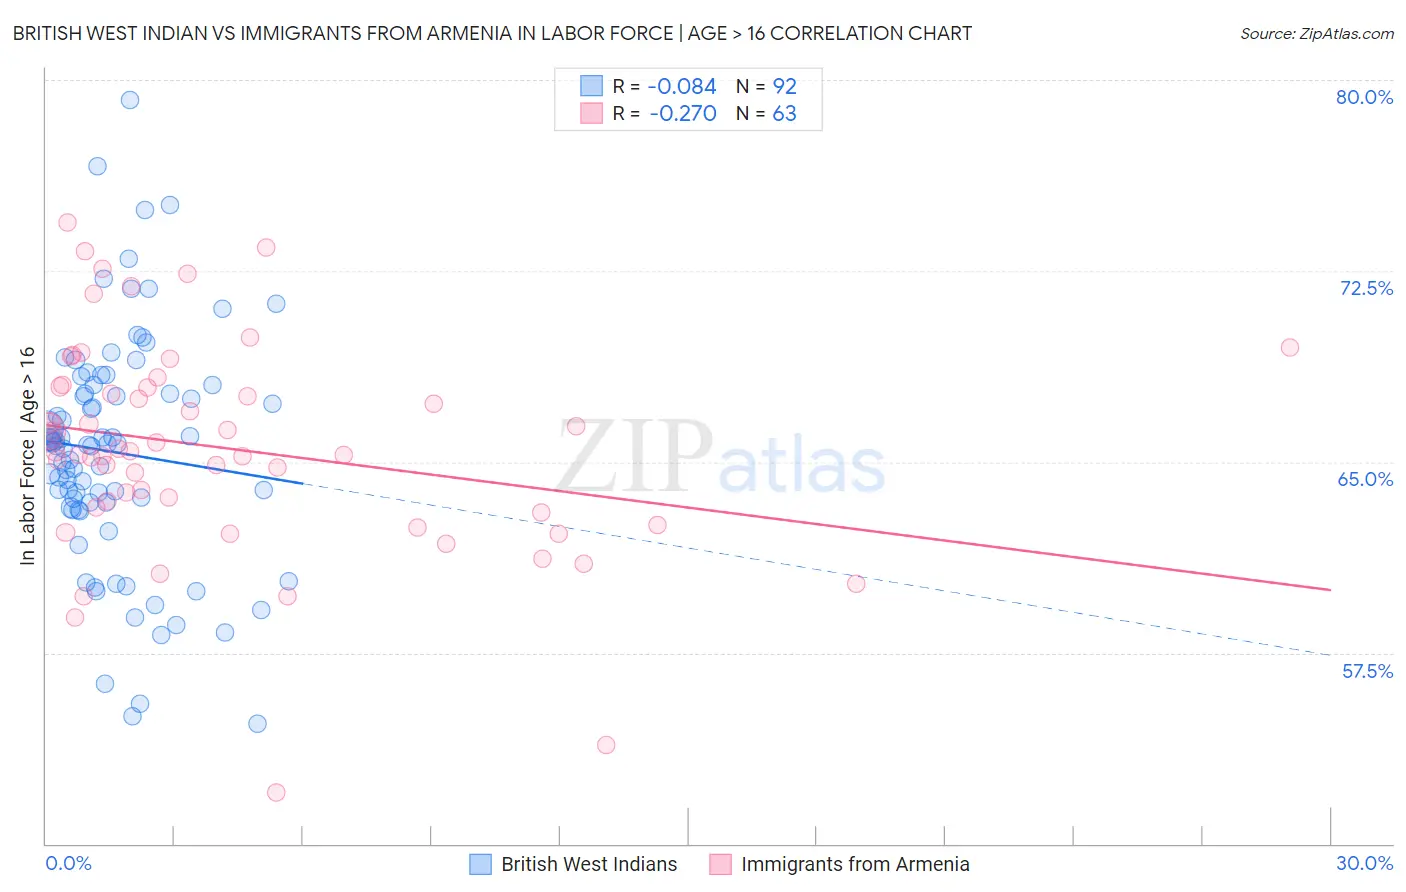
British West Indian vs Immigrants from Armenia In Labor Force | Age > 16 Correlation Chart
The statistical analysis conducted on geographies consisting of 152,701,183 people shows a slight negative correlation between the proportion of British West Indians and labor force participation rate among population ages 16 and over in the United States with a correlation coefficient (R) of -0.084 and weighted average of 64.4%. Similarly, the statistical analysis conducted on geographies consisting of 97,718,343 people shows a weak negative correlation between the proportion of Immigrants from Armenia and labor force participation rate among population ages 16 and over in the United States with a correlation coefficient (R) of -0.270 and weighted average of 65.3%, a difference of 1.5%.
In Labor Force | Age > 16 Correlation Summary
| Measurement | British West Indian | Immigrants from Armenia |
| Minimum | 54.7% | 52.0% |
| Maximum | 79.2% | 74.4% |
| Range | 24.5% | 22.4% |
| Mean | 65.4% | 65.5% |
| Median | 65.7% | 65.4% |
| Interquartile 25% (IQ1) | 63.3% | 63.0% |
| Interquartile 75% (IQ3) | 67.8% | 68.0% |
| Interquartile Range (IQR) | 4.6% | 5.0% |
| Standard Deviation (Sample) | 4.6% | 4.3% |
| Standard Deviation (Population) | 4.5% | 4.2% |
Similar Demographics by In Labor Force | Age > 16
Demographics Similar to British West Indians by In Labor Force | Age > 16
In terms of in labor force | age > 16, the demographic groups most similar to British West Indians are German (64.4%, a difference of 0.010%), Portuguese (64.4%, a difference of 0.020%), Immigrants from Barbados (64.4%, a difference of 0.040%), Swiss (64.4%, a difference of 0.050%), and Immigrants from Dominican Republic (64.4%, a difference of 0.050%).
| Demographics | Rating | Rank | In Labor Force | Age > 16 |
| Immigrants | Lebanon | 3.2 /100 | #243 | Tragic 64.5% |
| Tsimshian | 3.1 /100 | #244 | Tragic 64.5% |
| West Indians | 3.0 /100 | #245 | Tragic 64.5% |
| Immigrants | Caribbean | 2.3 /100 | #246 | Tragic 64.4% |
| Swiss | 2.1 /100 | #247 | Tragic 64.4% |
| Immigrants | Barbados | 2.1 /100 | #248 | Tragic 64.4% |
| Germans | 1.8 /100 | #249 | Tragic 64.4% |
| British West Indians | 1.8 /100 | #250 | Tragic 64.4% |
| Portuguese | 1.6 /100 | #251 | Tragic 64.4% |
| Immigrants | Dominican Republic | 1.5 /100 | #252 | Tragic 64.4% |
| Czechoslovakians | 1.4 /100 | #253 | Tragic 64.3% |
| Immigrants | Uzbekistan | 1.4 /100 | #254 | Tragic 64.3% |
| Hispanics or Latinos | 1.1 /100 | #255 | Tragic 64.3% |
| Immigrants | Mexico | 1.0 /100 | #256 | Tragic 64.3% |
| Inupiat | 0.8 /100 | #257 | Tragic 64.3% |
Demographics Similar to Immigrants from Armenia by In Labor Force | Age > 16
In terms of in labor force | age > 16, the demographic groups most similar to Immigrants from Armenia are Immigrants from Ireland (65.3%, a difference of 0.010%), Immigrants from Russia (65.3%, a difference of 0.010%), Panamanian (65.3%, a difference of 0.020%), Immigrants from Eastern Europe (65.4%, a difference of 0.030%), and Immigrants from Syria (65.3%, a difference of 0.030%).
| Demographics | Rating | Rank | In Labor Force | Age > 16 |
| Bhutanese | 86.3 /100 | #148 | Excellent 65.5% |
| Immigrants | Albania | 85.7 /100 | #149 | Excellent 65.4% |
| Immigrants | Immigrants | 81.9 /100 | #150 | Excellent 65.4% |
| Czechs | 81.5 /100 | #151 | Excellent 65.4% |
| Yugoslavians | 81.3 /100 | #152 | Excellent 65.4% |
| Immigrants | China | 80.5 /100 | #153 | Excellent 65.4% |
| Immigrants | Eastern Europe | 78.3 /100 | #154 | Good 65.4% |
| Immigrants | Armenia | 76.6 /100 | #155 | Good 65.3% |
| Immigrants | Ireland | 75.9 /100 | #156 | Good 65.3% |
| Immigrants | Russia | 75.7 /100 | #157 | Good 65.3% |
| Panamanians | 75.2 /100 | #158 | Good 65.3% |
| Immigrants | Syria | 74.6 /100 | #159 | Good 65.3% |
| Immigrants | South Africa | 73.5 /100 | #160 | Good 65.3% |
| Australians | 71.3 /100 | #161 | Good 65.3% |
| Albanians | 70.8 /100 | #162 | Good 65.3% |