British West Indian vs Ecuadorian In Labor Force | Age 16-19
COMPARE
British West Indian
Ecuadorian
In Labor Force | Age 16-19
In Labor Force | Age 16-19 Comparison
British West Indians
Ecuadorians
29.1%
IN LABOR FORCE | AGE 16-19
0.0/ 100
METRIC RATING
340th/ 347
METRIC RANK
31.4%
IN LABOR FORCE | AGE 16-19
0.0/ 100
METRIC RATING
320th/ 347
METRIC RANK
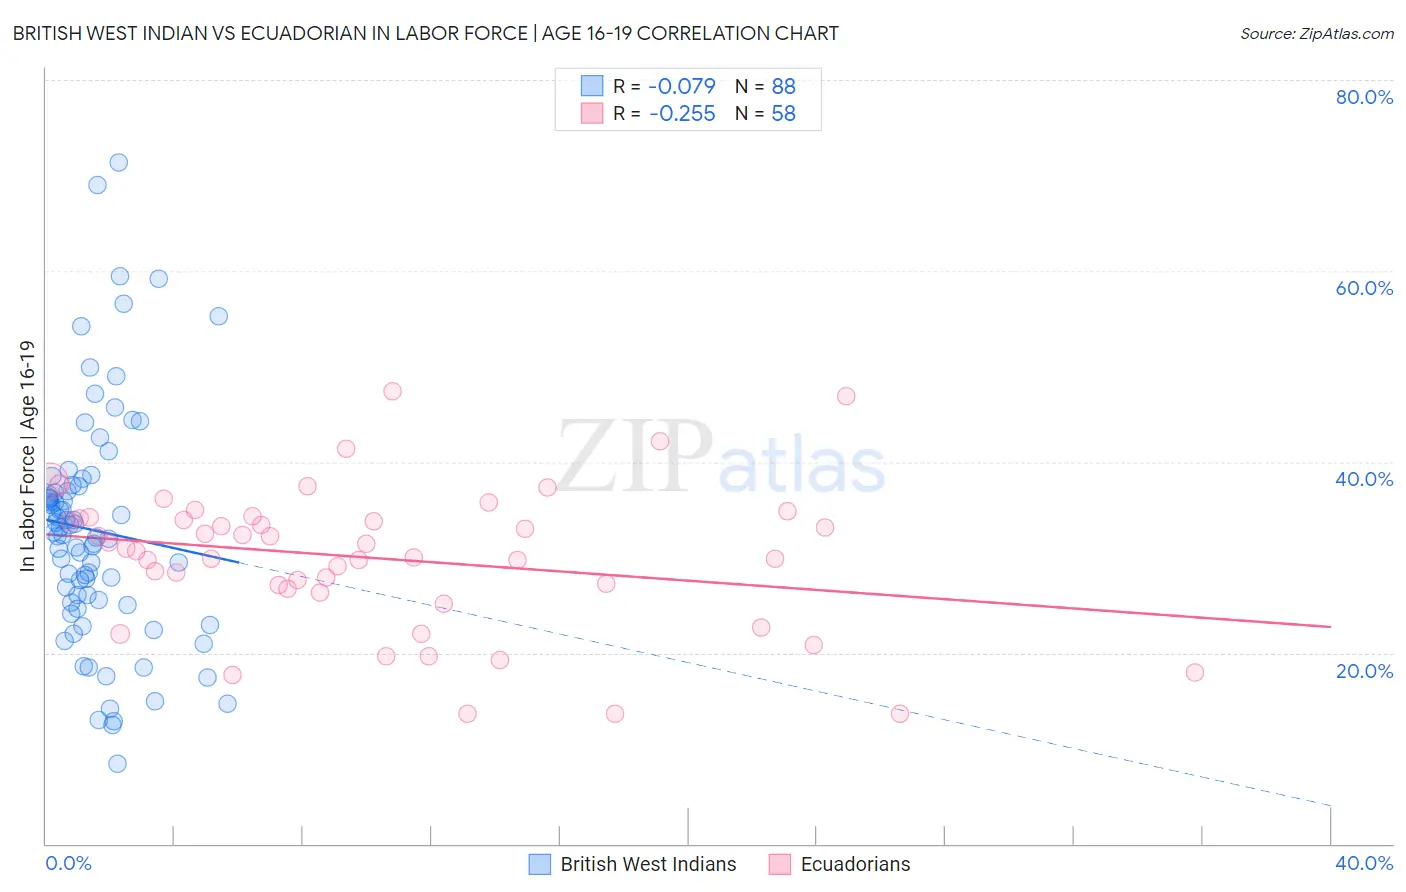
British West Indian vs Ecuadorian In Labor Force | Age 16-19 Correlation Chart
The statistical analysis conducted on geographies consisting of 152,607,678 people shows a slight negative correlation between the proportion of British West Indians and labor force participation rate among population between the ages 16 and 19 in the United States with a correlation coefficient (R) of -0.079 and weighted average of 29.1%. Similarly, the statistical analysis conducted on geographies consisting of 317,507,621 people shows a weak negative correlation between the proportion of Ecuadorians and labor force participation rate among population between the ages 16 and 19 in the United States with a correlation coefficient (R) of -0.255 and weighted average of 31.4%, a difference of 7.9%.
In Labor Force | Age 16-19 Correlation Summary
| Measurement | British West Indian | Ecuadorian |
| Minimum | 8.4% | 13.6% |
| Maximum | 71.4% | 47.4% |
| Range | 63.0% | 33.8% |
| Mean | 32.8% | 29.9% |
| Median | 32.5% | 30.8% |
| Interquartile 25% (IQ1) | 25.4% | 26.7% |
| Interquartile 75% (IQ3) | 37.2% | 34.0% |
| Interquartile Range (IQR) | 11.7% | 7.3% |
| Standard Deviation (Sample) | 12.1% | 7.4% |
| Standard Deviation (Population) | 12.0% | 7.4% |
Demographics Similar to British West Indians and Ecuadorians by In Labor Force | Age 16-19
In terms of in labor force | age 16-19, the demographic groups most similar to British West Indians are Immigrants from Uzbekistan (29.2%, a difference of 0.20%), Vietnamese (29.6%, a difference of 1.6%), Immigrants from Bangladesh (30.0%, a difference of 3.3%), Immigrants from Trinidad and Tobago (30.2%, a difference of 3.6%), and Immigrants from Cuba (30.2%, a difference of 4.0%). Similarly, the demographic groups most similar to Ecuadorians are West Indian (31.3%, a difference of 0.23%), Tohono O'odham (31.3%, a difference of 0.35%), Immigrants from Caribbean (31.2%, a difference of 0.48%), Dominican (31.2%, a difference of 0.67%), and Immigrants from China (31.1%, a difference of 0.81%).
| Demographics | Rating | Rank | In Labor Force | Age 16-19 |
| Ecuadorians | 0.0 /100 | #320 | Tragic 31.4% |
| West Indians | 0.0 /100 | #321 | Tragic 31.3% |
| Tohono O'odham | 0.0 /100 | #322 | Tragic 31.3% |
| Immigrants | Caribbean | 0.0 /100 | #323 | Tragic 31.2% |
| Dominicans | 0.0 /100 | #324 | Tragic 31.2% |
| Immigrants | China | 0.0 /100 | #325 | Tragic 31.1% |
| Immigrants | Dominican Republic | 0.0 /100 | #326 | Tragic 31.1% |
| Immigrants | Taiwan | 0.0 /100 | #327 | Tragic 31.0% |
| Immigrants | Ecuador | 0.0 /100 | #328 | Tragic 31.0% |
| Barbadians | 0.0 /100 | #329 | Tragic 31.0% |
| Lumbee | 0.0 /100 | #330 | Tragic 31.0% |
| Trinidadians and Tobagonians | 0.0 /100 | #331 | Tragic 30.9% |
| Immigrants | Israel | 0.0 /100 | #332 | Tragic 30.5% |
| Immigrants | Hong Kong | 0.0 /100 | #333 | Tragic 30.5% |
| Puerto Ricans | 0.0 /100 | #334 | Tragic 30.3% |
| Immigrants | Cuba | 0.0 /100 | #335 | Tragic 30.2% |
| Immigrants | Trinidad and Tobago | 0.0 /100 | #336 | Tragic 30.2% |
| Immigrants | Bangladesh | 0.0 /100 | #337 | Tragic 30.0% |
| Vietnamese | 0.0 /100 | #338 | Tragic 29.6% |
| Immigrants | Uzbekistan | 0.0 /100 | #339 | Tragic 29.2% |
| British West Indians | 0.0 /100 | #340 | Tragic 29.1% |