Bhutanese vs Vietnamese In Labor Force | Age 20-64

COMPARE

Bhutanese
Race
Ancestry
AfghanAfricanAlaska NativeAlaskan AthabascanAlbanianAleutAlsatianAmericanApacheArabArapahoArgentineanArmenianAssyrian/Chaldean/SyriacAustralianAustrianBahamianBangladeshiBarbadianBasqueBelgianBelizeanBermudanBhutaneseBlackfeetBolivianBrazilianBritishBritish West IndianBulgarianBurmeseCajunCambodianCanadianCape VerdeanCarpatho RusynCelticCentral AmericanCentral American IndianCherokeeCheyenneChickasawChileanChineseChippewaChoctawColombianColvilleComancheCosta RicanCreeCreekCroatianCrowCubanCypriotCzechCzechoslovakianDanishDelawareDominicanDutchDutch West IndianEastern EuropeanEcuadorianEgyptianEnglishEstonianEthiopianEuropeanFijianFilipinoFinnishFrenchFrench American IndianFrench CanadianGermanGerman RussianGhanaianGreekGuamanian/ChamorroGuatemalanGuyaneseHaitianHmongHonduranHopiHoumaHungarianIcelanderIndian (Asian)IndonesianInupiatIranianIraqiIrishIroquoisIsraeliItalianJamaicanJapaneseJordanianKenyanKiowaKoreanLaotianLatvianLebaneseLiberianLithuanianLumbeeLuxembourgerMacedonianMalaysianMalteseMarshalleseMenomineeMexicanMexican American IndianMongolianMoroccanNative HawaiianNavajoNepaleseNew ZealanderNicaraguanNigerianNorthern EuropeanNorwegianOkinawanOsageOttawaPaiutePakistaniPalestinianPanamanianParaguayanPennsylvania GermanPeruvianPimaPolishPortuguesePotawatomiPuebloPuerto RicanPuget Sound SalishRomanianRussianSalvadoranSamoanScandinavianScotch-IrishScottishSeminoleSenegaleseSerbianShoshoneSierra LeoneanSiouxSlavicSlovakSloveneSomaliSouth AfricanSouth AmericanSouth American IndianSoviet UnionSpaniardSpanishSpanish AmericanSpanish American IndianSri LankanSubsaharan AfricanSudaneseSwedishSwissSyrianTaiwaneseThaiTlingit-HaidaTohono O'OdhamTonganTrinidadian and TobagonianTsimshianTurkishU.S. Virgin IslanderUgandanUkrainianUruguayanUteVenezuelanWelshWest IndianYakamaYaquiYugoslavianYumanYup'ikZimbabwean
Immigration
NonimmigrantsImmigrantsAfghanistanAfricaAlbaniaArgentinaArmeniaAsiaAustraliaAustriaBahamasBangladeshBarbadosBelarusBelgiumBelizeBoliviaBosnia and HerzegovinaBrazilBulgariaBurma/MyanmarCabo VerdeCambodiaCameroonCanadaCaribbeanCentral AmericaChileChinaColombiaCongoCosta RicaCroatiaCubaCzechoslovakiaDenmarkDominicaDominican RepublicEastern AfricaEastern AsiaEastern EuropeEcuadorEgyptEl SalvadorEnglandEritreaEthiopiaEuropeFijiFranceGermanyGhanaGreeceGrenadaGuatemalaGuyanaHaitiHondurasHong KongHungaryIndiaIndonesiaIranIraqIrelandIsraelItalyJamaicaJapanJordanKazakhstanKenyaKoreaKuwaitLaosLatin AmericaLatviaLebanonLiberiaLithuaniaMalaysiaMexicoMicronesiaMiddle AfricaMoldovaMoroccoNepalNetherlandsNicaraguaNigeriaNorth AmericaNorth MacedoniaNorthern AfricaNorthern EuropeNorwayOceaniaPakistanPanamaPeruPhilippinesPolandPortugalRomaniaRussiaSaudi ArabiaScotlandSenegalSerbiaSierra LeoneSingaporeSomaliaSouth AfricaSouth AmericaSouth Central AsiaSouth Eastern AsiaSouthern EuropeSpainSri LankaSt. Vincent and the GrenadinesSudanSwedenSwitzerlandSyriaTaiwanThailandTrinidad and TobagoTurkeyUgandaUkraineUruguayUzbekistanVenezuelaVietnamWest IndiesWestern AfricaWestern AsiaWestern EuropeYemenZaireZimbabweAzores
Vietnamese
Race
Ancestry
AfghanAfricanAlaska NativeAlaskan AthabascanAlbanianAleutAlsatianAmericanApacheArabArapahoArgentineanArmenianAssyrian/Chaldean/SyriacAustralianAustrianBahamianBangladeshiBarbadianBasqueBelgianBelizeanBermudanBlackfeetBolivianBrazilianBritishBritish West IndianBulgarianBurmeseCajunCambodianCanadianCape VerdeanCarpatho RusynCelticCentral AmericanCentral American IndianCherokeeCheyenneChickasawChileanChineseChippewaChoctawColombianColvilleComancheCosta RicanCreeCreekCroatianCrowCubanCypriotCzechCzechoslovakianDanishDelawareDominicanDutchDutch West IndianEastern EuropeanEcuadorianEgyptianEnglishEstonianEthiopianEuropeanFijianFilipinoFinnishFrenchFrench American IndianFrench CanadianGermanGerman RussianGhanaianGreekGuamanian/ChamorroGuatemalanGuyaneseHaitianHmongHonduranHopiHoumaHungarianIcelanderIndian (Asian)IndonesianInupiatIranianIraqiIrishIroquoisIsraeliItalianJamaicanJapaneseJordanianKenyanKiowaKoreanLaotianLatvianLebaneseLiberianLithuanianLumbeeLuxembourgerMacedonianMalaysianMalteseMarshalleseMenomineeMexicanMexican American IndianMongolianMoroccanNative HawaiianNavajoNepaleseNew ZealanderNicaraguanNigerianNorthern EuropeanNorwegianOkinawanOsageOttawaPaiutePakistaniPalestinianPanamanianParaguayanPennsylvania GermanPeruvianPimaPolishPortuguesePotawatomiPuebloPuerto RicanPuget Sound SalishRomanianRussianSalvadoranSamoanScandinavianScotch-IrishScottishSeminoleSenegaleseSerbianShoshoneSierra LeoneanSiouxSlavicSlovakSloveneSomaliSouth AfricanSouth AmericanSouth American IndianSoviet UnionSpaniardSpanishSpanish AmericanSpanish American IndianSri LankanSubsaharan AfricanSudaneseSwedishSwissSyrianTaiwaneseThaiTlingit-HaidaTohono O'OdhamTonganTrinidadian and TobagonianTsimshianTurkishU.S. Virgin IslanderUgandanUkrainianUruguayanUteVenezuelanVietnameseWelshWest IndianYakamaYaquiYugoslavianYumanYup'ikZimbabwean
Immigration
NonimmigrantsImmigrantsAfghanistanAfricaAlbaniaArgentinaArmeniaAsiaAustraliaAustriaBahamasBangladeshBarbadosBelarusBelgiumBelizeBoliviaBosnia and HerzegovinaBrazilBulgariaBurma/MyanmarCabo VerdeCambodiaCameroonCanadaCaribbeanCentral AmericaChileChinaColombiaCongoCosta RicaCroatiaCubaCzechoslovakiaDenmarkDominicaDominican RepublicEastern AfricaEastern AsiaEastern EuropeEcuadorEgyptEl SalvadorEnglandEritreaEthiopiaEuropeFijiFranceGermanyGhanaGreeceGrenadaGuatemalaGuyanaHaitiHondurasHong KongHungaryIndiaIndonesiaIranIraqIrelandIsraelItalyJamaicaJapanJordanKazakhstanKenyaKoreaKuwaitLaosLatin AmericaLatviaLebanonLiberiaLithuaniaMalaysiaMexicoMicronesiaMiddle AfricaMoldovaMoroccoNepalNetherlandsNicaraguaNigeriaNorth AmericaNorth MacedoniaNorthern AfricaNorthern EuropeNorwayOceaniaPakistanPanamaPeruPhilippinesPolandPortugalRomaniaRussiaSaudi ArabiaScotlandSenegalSerbiaSierra LeoneSingaporeSomaliaSouth AfricaSouth AmericaSouth Central AsiaSouth Eastern AsiaSouthern EuropeSpainSri LankaSt. Vincent and the GrenadinesSudanSwedenSwitzerlandSyriaTaiwanThailandTrinidad and TobagoTurkeyUgandaUkraineUruguayUzbekistanVenezuelaVietnamWest IndiesWestern AfricaWestern AsiaWestern EuropeYemenZaireZimbabweAzores
In Labor Force | Age 20-64
Income
Poverty
Unemployment
Labor Participation
Family Structure
Vehicle Availability
Education Level
Disability

In Labor Force | Age 20-64 Comparison

Bhutanese

Vietnamese

Exceptional
Tragic
80.2%
IN LABOR FORCE | AGE 20-64
98.6/ 100
METRIC RATING
68th/ 347
METRIC RANK
78.0%
IN LABOR FORCE | AGE 20-64
0.0/ 100
METRIC RATING
287th/ 347
METRIC RANK

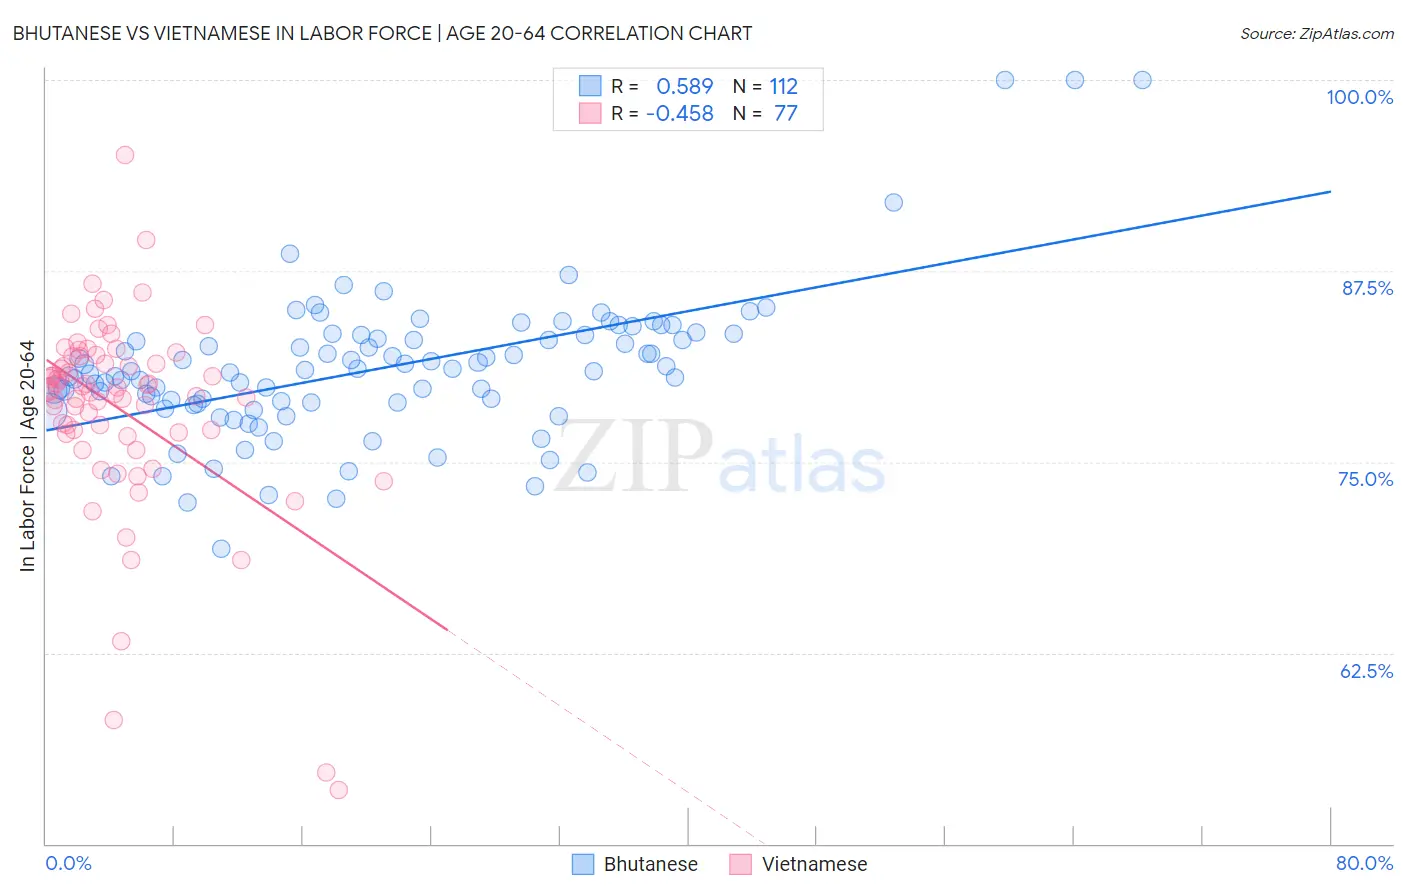
Bhutanese vs Vietnamese In Labor Force | Age 20-64 Correlation Chart

The statistical analysis conducted on geographies consisting of 455,602,654 people shows a substantial positive correlation between the proportion of Bhutanese and labor force participation rate among population between the ages 20 and 64 in the United States with a correlation coefficient (R) of 0.589 and weighted average of 80.2%. Similarly, the statistical analysis conducted on geographies consisting of 170,756,377 people shows a moderate negative correlation between the proportion of Vietnamese and labor force participation rate among population between the ages 20 and 64 in the United States with a correlation coefficient (R) of -0.458 and weighted average of 78.0%, a difference of 2.9%.
Bhutanese vs Vietnamese In Labor Force | Age 20-64

In Labor Force | Age 20-64 Correlation Summary

MeasurementBhutaneseVietnamese
Minimum69.3%53.5%
Maximum100.0%95.1%
Range30.7%41.6%
Mean81.1%78.4%
Median81.0%79.7%
Interquartile 25% (IQ1)78.8%76.9%
Interquartile 75% (IQ3)83.2%81.9%
Interquartile Range (IQR)4.3%5.0%
Standard Deviation (Sample)4.8%6.6%
Standard Deviation (Population)4.8%6.6%

Similar Demographics by In Labor Force | Age 20-64

Demographics Similar to Bhutanese by In Labor Force | Age 20-64

In terms of in labor force | age 20-64, the demographic groups most similar to Bhutanese are Albanian (80.2%, a difference of 0.0%), Immigrants from Turkey (80.2%, a difference of 0.0%), Macedonian (80.2%, a difference of 0.010%), Taiwanese (80.2%, a difference of 0.010%), and Soviet Union (80.2%, a difference of 0.010%).
DemographicsRating | RankIn Labor Force | Age 20-64
Burmese
98.8
/100
|
#61
Exceptional
80.3%
Carpatho Rusyns
98.8
/100
|
#62
Exceptional
80.3%
Immigrants | Korea
98.8
/100
|
#63
Exceptional
80.3%
Immigrants | Albania
98.7
/100
|
#64
Exceptional
80.3%
Lithuanians
98.7
/100
|
#65
Exceptional
80.2%
Macedonians
98.7
/100
|
#66
Exceptional
80.2%
Taiwanese
98.6
/100
|
#67
Exceptional
80.2%
Bhutanese
98.6
/100
|
#68
Exceptional
80.2%
Albanians
98.6
/100
|
#69
Exceptional
80.2%
Immigrants | Turkey
98.5
/100
|
#70
Exceptional
80.2%
Soviet Union
98.5
/100
|
#71
Exceptional
80.2%
Eastern Europeans
98.4
/100
|
#72
Exceptional
80.2%
Cypriots
98.2
/100
|
#73
Exceptional
80.2%
Immigrants | Eastern Europe
98.1
/100
|
#74
Exceptional
80.2%
Immigrants | Afghanistan
97.9
/100
|
#75
Exceptional
80.2%

Demographics Similar to Vietnamese by In Labor Force | Age 20-64

In terms of in labor force | age 20-64, the demographic groups most similar to Vietnamese are Immigrants from Belize (78.0%, a difference of 0.0%), Osage (78.0%, a difference of 0.010%), Hmong (77.9%, a difference of 0.070%), African (77.9%, a difference of 0.080%), and Immigrants from Bangladesh (77.9%, a difference of 0.10%).
DemographicsRating | RankIn Labor Force | Age 20-64
Immigrants | Dominica
0.0
/100
|
#280
Tragic
78.1%
Guyanese
0.0
/100
|
#281
Tragic
78.1%
Immigrants | St. Vincent and the Grenadines
0.0
/100
|
#282
Tragic
78.1%
Immigrants | Nonimmigrants
0.0
/100
|
#283
Tragic
78.1%
Immigrants | Guyana
0.0
/100
|
#284
Tragic
78.1%
Osage
0.0
/100
|
#285
Tragic
78.0%
Immigrants | Belize
0.0
/100
|
#286
Tragic
78.0%
Vietnamese
0.0
/100
|
#287
Tragic
78.0%
Hmong
0.0
/100
|
#288
Tragic
77.9%
Africans
0.0
/100
|
#289
Tragic
77.9%
Immigrants | Bangladesh
0.0
/100
|
#290
Tragic
77.9%
Spanish Americans
0.0
/100
|
#291
Tragic
77.8%
Immigrants | Azores
0.0
/100
|
#292
Tragic
77.8%
Delaware
0.0
/100
|
#293
Tragic
77.8%
Immigrants | Central America
0.0
/100
|
#294
Tragic
77.7%