Bhutanese vs Guatemalan In Labor Force | Age 35-44

COMPARE

Bhutanese
Race
Ancestry
AfghanAfricanAlaska NativeAlaskan AthabascanAlbanianAleutAlsatianAmericanApacheArabArapahoArgentineanArmenianAssyrian/Chaldean/SyriacAustralianAustrianBahamianBangladeshiBarbadianBasqueBelgianBelizeanBermudanBhutaneseBlackfeetBolivianBrazilianBritishBritish West IndianBulgarianBurmeseCajunCambodianCanadianCape VerdeanCarpatho RusynCelticCentral AmericanCentral American IndianCherokeeCheyenneChickasawChileanChineseChippewaChoctawColombianColvilleComancheCosta RicanCreeCreekCroatianCrowCubanCypriotCzechCzechoslovakianDanishDelawareDominicanDutchDutch West IndianEastern EuropeanEcuadorianEgyptianEnglishEstonianEthiopianEuropeanFijianFilipinoFinnishFrenchFrench American IndianFrench CanadianGermanGerman RussianGhanaianGreekGuamanian/ChamorroGuyaneseHaitianHmongHonduranHopiHoumaHungarianIcelanderIndian (Asian)IndonesianInupiatIranianIraqiIrishIroquoisIsraeliItalianJamaicanJapaneseJordanianKenyanKiowaKoreanLaotianLatvianLebaneseLiberianLithuanianLumbeeLuxembourgerMacedonianMalaysianMalteseMarshalleseMenomineeMexicanMexican American IndianMongolianMoroccanNative HawaiianNavajoNepaleseNew ZealanderNicaraguanNigerianNorthern EuropeanNorwegianOkinawanOsageOttawaPaiutePakistaniPalestinianPanamanianParaguayanPennsylvania GermanPeruvianPimaPolishPortuguesePotawatomiPuebloPuerto RicanPuget Sound SalishRomanianRussianSalvadoranSamoanScandinavianScotch-IrishScottishSeminoleSenegaleseSerbianShoshoneSierra LeoneanSiouxSlavicSlovakSloveneSomaliSouth AfricanSouth AmericanSouth American IndianSoviet UnionSpaniardSpanishSpanish AmericanSpanish American IndianSri LankanSubsaharan AfricanSudaneseSwedishSwissSyrianTaiwaneseThaiTlingit-HaidaTohono O'OdhamTonganTrinidadian and TobagonianTsimshianTurkishU.S. Virgin IslanderUgandanUkrainianUruguayanUteVenezuelanVietnameseWelshWest IndianYakamaYaquiYugoslavianYumanYup'ikZimbabwean
Immigration
NonimmigrantsImmigrantsAfghanistanAfricaAlbaniaArgentinaArmeniaAsiaAustraliaAustriaBahamasBangladeshBarbadosBelarusBelgiumBelizeBoliviaBosnia and HerzegovinaBrazilBulgariaBurma/MyanmarCabo VerdeCambodiaCameroonCanadaCaribbeanCentral AmericaChileChinaColombiaCongoCosta RicaCroatiaCubaCzechoslovakiaDenmarkDominicaDominican RepublicEastern AfricaEastern AsiaEastern EuropeEcuadorEgyptEl SalvadorEnglandEritreaEthiopiaEuropeFijiFranceGermanyGhanaGreeceGrenadaGuatemalaGuyanaHaitiHondurasHong KongHungaryIndiaIndonesiaIranIraqIrelandIsraelItalyJamaicaJapanJordanKazakhstanKenyaKoreaKuwaitLaosLatin AmericaLatviaLebanonLiberiaLithuaniaMalaysiaMexicoMicronesiaMiddle AfricaMoldovaMoroccoNepalNetherlandsNicaraguaNigeriaNorth AmericaNorth MacedoniaNorthern AfricaNorthern EuropeNorwayOceaniaPakistanPanamaPeruPhilippinesPolandPortugalRomaniaRussiaSaudi ArabiaScotlandSenegalSerbiaSierra LeoneSingaporeSomaliaSouth AfricaSouth AmericaSouth Central AsiaSouth Eastern AsiaSouthern EuropeSpainSri LankaSt. Vincent and the GrenadinesSudanSwedenSwitzerlandSyriaTaiwanThailandTrinidad and TobagoTurkeyUgandaUkraineUruguayUzbekistanVenezuelaVietnamWest IndiesWestern AfricaWestern AsiaWestern EuropeYemenZaireZimbabweAzores
Guatemalan
Race
Ancestry
AfghanAfricanAlaska NativeAlaskan AthabascanAlbanianAleutAlsatianAmericanApacheArabArapahoArgentineanArmenianAssyrian/Chaldean/SyriacAustralianAustrianBahamianBangladeshiBarbadianBasqueBelgianBelizeanBermudanBlackfeetBolivianBrazilianBritishBritish West IndianBulgarianBurmeseCajunCambodianCanadianCape VerdeanCarpatho RusynCelticCentral AmericanCentral American IndianCherokeeCheyenneChickasawChileanChineseChippewaChoctawColombianColvilleComancheCosta RicanCreeCreekCroatianCrowCubanCypriotCzechCzechoslovakianDanishDelawareDominicanDutchDutch West IndianEastern EuropeanEcuadorianEgyptianEnglishEstonianEthiopianEuropeanFijianFilipinoFinnishFrenchFrench American IndianFrench CanadianGermanGerman RussianGhanaianGreekGuamanian/ChamorroGuatemalanGuyaneseHaitianHmongHonduranHopiHoumaHungarianIcelanderIndian (Asian)IndonesianInupiatIranianIraqiIrishIroquoisIsraeliItalianJamaicanJapaneseJordanianKenyanKiowaKoreanLaotianLatvianLebaneseLiberianLithuanianLumbeeLuxembourgerMacedonianMalaysianMalteseMarshalleseMenomineeMexicanMexican American IndianMongolianMoroccanNative HawaiianNavajoNepaleseNew ZealanderNicaraguanNigerianNorthern EuropeanNorwegianOkinawanOsageOttawaPaiutePakistaniPalestinianPanamanianParaguayanPennsylvania GermanPeruvianPimaPolishPortuguesePotawatomiPuebloPuerto RicanPuget Sound SalishRomanianRussianSalvadoranSamoanScandinavianScotch-IrishScottishSeminoleSenegaleseSerbianShoshoneSierra LeoneanSiouxSlavicSlovakSloveneSomaliSouth AfricanSouth AmericanSouth American IndianSoviet UnionSpaniardSpanishSpanish AmericanSpanish American IndianSri LankanSubsaharan AfricanSudaneseSwedishSwissSyrianTaiwaneseThaiTlingit-HaidaTohono O'OdhamTonganTrinidadian and TobagonianTsimshianTurkishU.S. Virgin IslanderUgandanUkrainianUruguayanUteVenezuelanVietnameseWelshWest IndianYakamaYaquiYugoslavianYumanYup'ikZimbabwean
Immigration
NonimmigrantsImmigrantsAfghanistanAfricaAlbaniaArgentinaArmeniaAsiaAustraliaAustriaBahamasBangladeshBarbadosBelarusBelgiumBelizeBoliviaBosnia and HerzegovinaBrazilBulgariaBurma/MyanmarCabo VerdeCambodiaCameroonCanadaCaribbeanCentral AmericaChileChinaColombiaCongoCosta RicaCroatiaCubaCzechoslovakiaDenmarkDominicaDominican RepublicEastern AfricaEastern AsiaEastern EuropeEcuadorEgyptEl SalvadorEnglandEritreaEthiopiaEuropeFijiFranceGermanyGhanaGreeceGrenadaGuatemalaGuyanaHaitiHondurasHong KongHungaryIndiaIndonesiaIranIraqIrelandIsraelItalyJamaicaJapanJordanKazakhstanKenyaKoreaKuwaitLaosLatin AmericaLatviaLebanonLiberiaLithuaniaMalaysiaMexicoMicronesiaMiddle AfricaMoldovaMoroccoNepalNetherlandsNicaraguaNigeriaNorth AmericaNorth MacedoniaNorthern AfricaNorthern EuropeNorwayOceaniaPakistanPanamaPeruPhilippinesPolandPortugalRomaniaRussiaSaudi ArabiaScotlandSenegalSerbiaSierra LeoneSingaporeSomaliaSouth AfricaSouth AmericaSouth Central AsiaSouth Eastern AsiaSouthern EuropeSpainSri LankaSt. Vincent and the GrenadinesSudanSwedenSwitzerlandSyriaTaiwanThailandTrinidad and TobagoTurkeyUgandaUkraineUruguayUzbekistanVenezuelaVietnamWest IndiesWestern AfricaWestern AsiaWestern EuropeYemenZaireZimbabweAzores
In Labor Force | Age 35-44
Income
Poverty
Unemployment
Labor Participation
Family Structure
Vehicle Availability
Education Level
Disability

In Labor Force | Age 35-44 Comparison

Bhutanese

Guatemalans

Excellent
Tragic
84.7%
IN LABOR FORCE | AGE 35-44
89.7/ 100
METRIC RATING
130th/ 347
METRIC RANK
83.0%
IN LABOR FORCE | AGE 35-44
0.0/ 100
METRIC RATING
281st/ 347
METRIC RANK

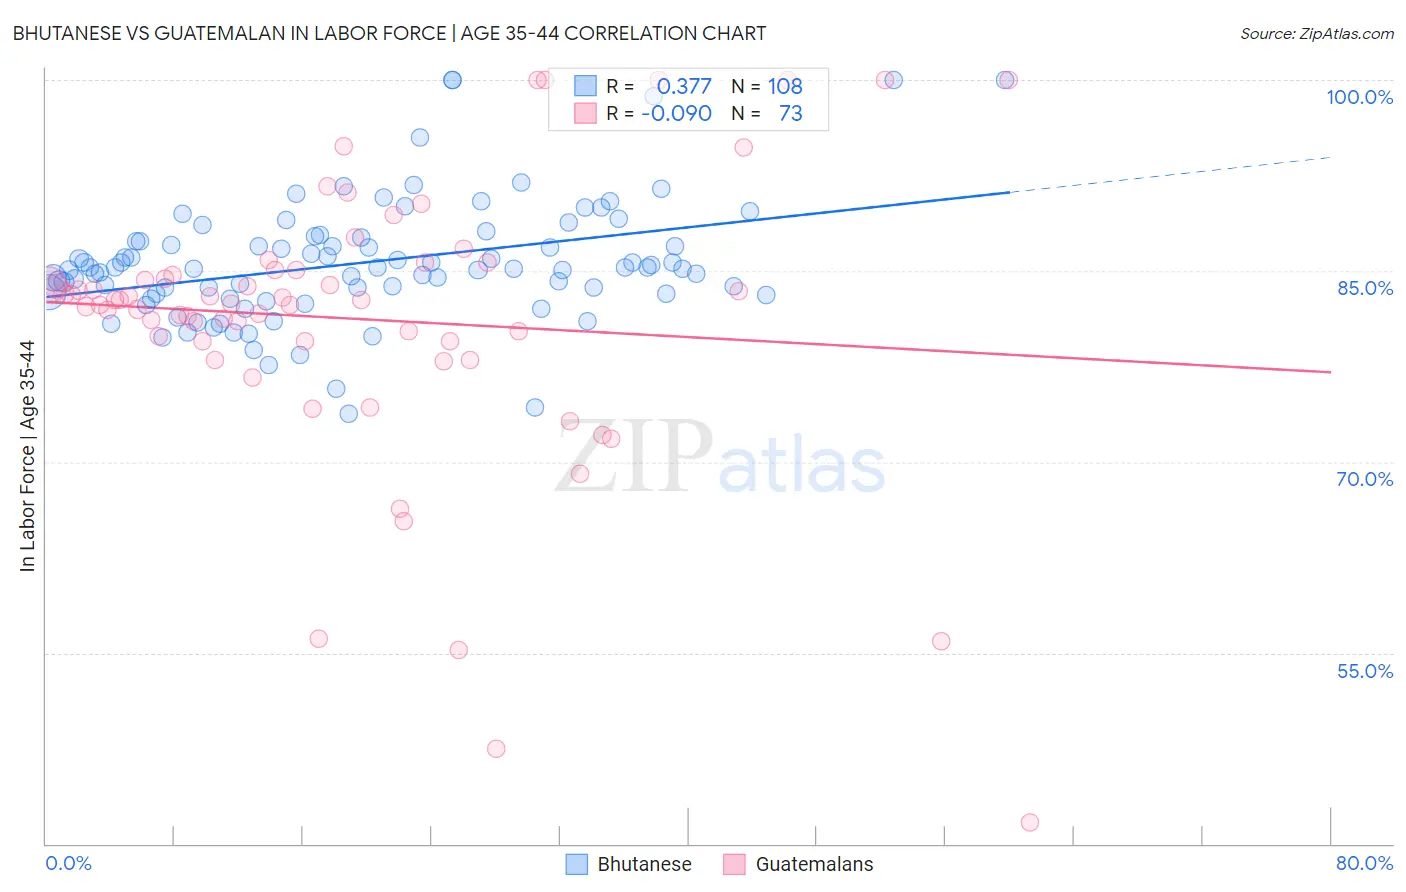
Bhutanese vs Guatemalan In Labor Force | Age 35-44 Correlation Chart

The statistical analysis conducted on geographies consisting of 455,246,136 people shows a mild positive correlation between the proportion of Bhutanese and labor force participation rate among population between the ages 35 and 44 in the United States with a correlation coefficient (R) of 0.377 and weighted average of 84.7%. Similarly, the statistical analysis conducted on geographies consisting of 409,363,843 people shows a slight negative correlation between the proportion of Guatemalans and labor force participation rate among population between the ages 35 and 44 in the United States with a correlation coefficient (R) of -0.090 and weighted average of 83.0%, a difference of 2.0%.
Bhutanese vs Guatemalan In Labor Force | Age 35-44

In Labor Force | Age 35-44 Correlation Summary

MeasurementBhutaneseGuatemalan
Minimum73.8%41.7%
Maximum100.0%100.0%
Range26.2%58.3%
Mean85.7%81.2%
Median85.2%82.7%
Interquartile 25% (IQ1)83.2%79.5%
Interquartile 75% (IQ3)87.5%85.1%
Interquartile Range (IQR)4.3%5.6%
Standard Deviation (Sample)4.8%11.0%
Standard Deviation (Population)4.8%11.0%

Similar Demographics by In Labor Force | Age 35-44

Demographics Similar to Bhutanese by In Labor Force | Age 35-44

In terms of in labor force | age 35-44, the demographic groups most similar to Bhutanese are Palestinian (84.7%, a difference of 0.0%), Immigrants from Scotland (84.7%, a difference of 0.0%), Austrian (84.7%, a difference of 0.0%), Immigrants from Ghana (84.7%, a difference of 0.010%), and Immigrants from South America (84.7%, a difference of 0.020%).
DemographicsRating | RankIn Labor Force | Age 35-44
Immigrants | South America
90.9
/100
|
#123
Exceptional
84.7%
Slavs
90.8
/100
|
#124
Exceptional
84.7%
Maltese
90.8
/100
|
#125
Exceptional
84.7%
Asians
90.6
/100
|
#126
Exceptional
84.7%
Immigrants | Spain
90.6
/100
|
#127
Exceptional
84.7%
Immigrants | Ghana
90.4
/100
|
#128
Exceptional
84.7%
Palestinians
89.7
/100
|
#129
Excellent
84.7%
Bhutanese
89.7
/100
|
#130
Excellent
84.7%
Immigrants | Scotland
89.6
/100
|
#131
Excellent
84.7%
Austrians
89.4
/100
|
#132
Excellent
84.7%
Argentineans
88.4
/100
|
#133
Excellent
84.6%
Immigrants | Korea
88.2
/100
|
#134
Excellent
84.6%
Immigrants | Malaysia
87.5
/100
|
#135
Excellent
84.6%
Afghans
86.3
/100
|
#136
Excellent
84.6%
Immigrants | Chile
84.6
/100
|
#137
Excellent
84.6%

Demographics Similar to Guatemalans by In Labor Force | Age 35-44

In terms of in labor force | age 35-44, the demographic groups most similar to Guatemalans are Osage (82.9%, a difference of 0.040%), Immigrants from Guatemala (82.9%, a difference of 0.040%), Immigrants from Dominican Republic (82.9%, a difference of 0.050%), Fijian (82.9%, a difference of 0.060%), and Immigrants from Bangladesh (82.9%, a difference of 0.060%).
DemographicsRating | RankIn Labor Force | Age 35-44
Immigrants | Nonimmigrants
0.0
/100
|
#274
Tragic
83.2%
Hawaiians
0.0
/100
|
#275
Tragic
83.2%
Delaware
0.0
/100
|
#276
Tragic
83.2%
Samoans
0.0
/100
|
#277
Tragic
83.2%
Belizeans
0.0
/100
|
#278
Tragic
83.1%
Immigrants | Micronesia
0.0
/100
|
#279
Tragic
83.1%
Dominicans
0.0
/100
|
#280
Tragic
83.1%
Guatemalans
0.0
/100
|
#281
Tragic
83.0%
Osage
0.0
/100
|
#282
Tragic
82.9%
Immigrants | Guatemala
0.0
/100
|
#283
Tragic
82.9%
Immigrants | Dominican Republic
0.0
/100
|
#284
Tragic
82.9%
Fijians
0.0
/100
|
#285
Tragic
82.9%
Immigrants | Bangladesh
0.0
/100
|
#286
Tragic
82.9%
Immigrants | Belize
0.0
/100
|
#287
Tragic
82.9%
Puget Sound Salish
0.0
/100
|
#288
Tragic
82.9%