Bermudan vs Immigrants from Austria In Labor Force | Age 20-64
COMPARE
Bermudan
Immigrants from Austria
In Labor Force | Age 20-64
In Labor Force | Age 20-64 Comparison
Bermudans
Immigrants from Austria
80.0%
IN LABOR FORCE | AGE 20-64
93.3/ 100
METRIC RATING
115th/ 347
METRIC RANK
79.4%
IN LABOR FORCE | AGE 20-64
23.7/ 100
METRIC RATING
195th/ 347
METRIC RANK
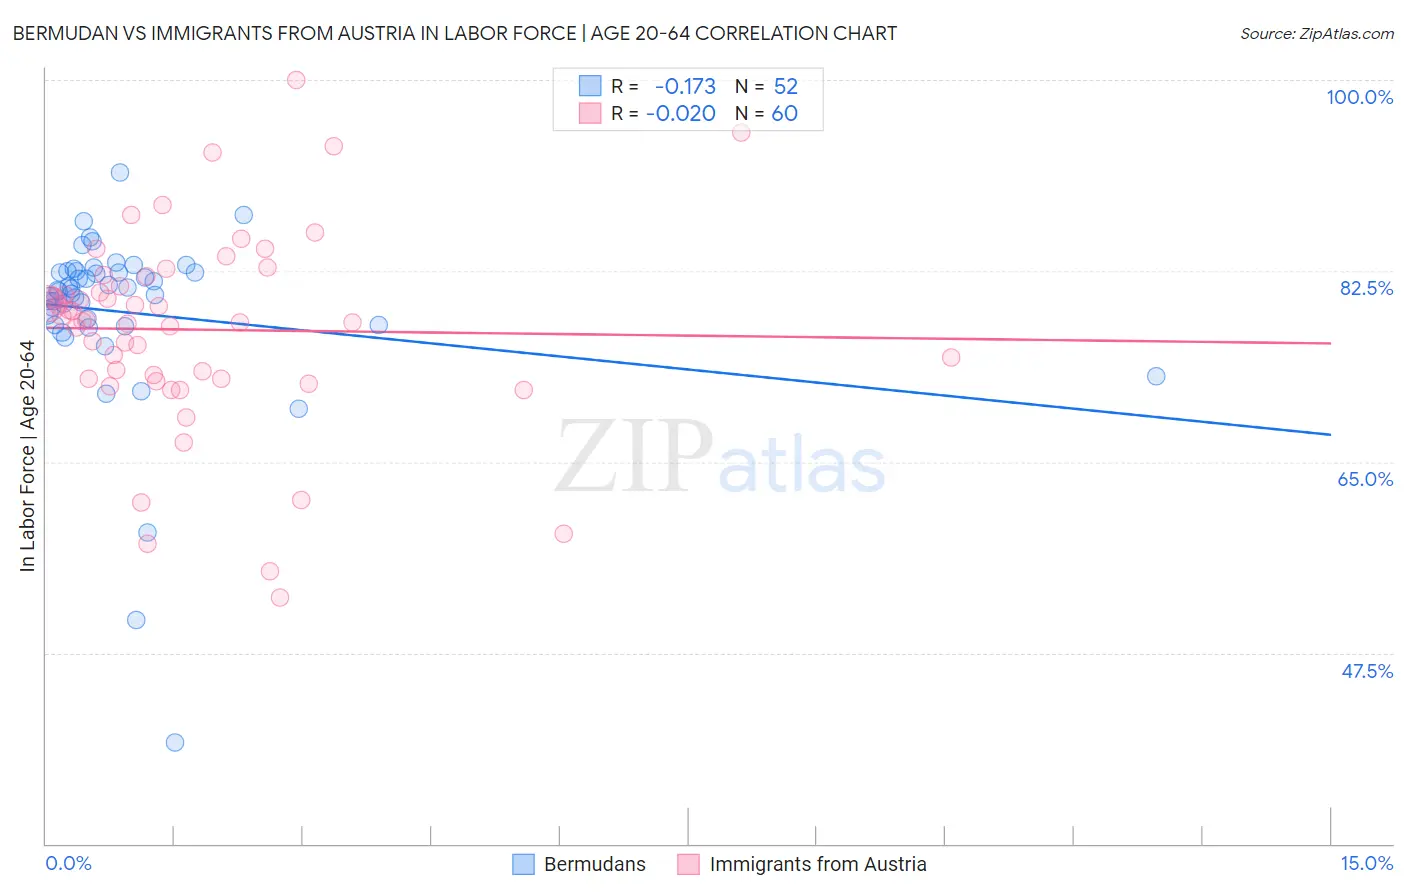
Bermudan vs Immigrants from Austria In Labor Force | Age 20-64 Correlation Chart
The statistical analysis conducted on geographies consisting of 55,730,379 people shows a poor negative correlation between the proportion of Bermudans and labor force participation rate among population between the ages 20 and 64 in the United States with a correlation coefficient (R) of -0.173 and weighted average of 80.0%. Similarly, the statistical analysis conducted on geographies consisting of 167,973,933 people shows no correlation between the proportion of Immigrants from Austria and labor force participation rate among population between the ages 20 and 64 in the United States with a correlation coefficient (R) of -0.020 and weighted average of 79.4%, a difference of 0.77%.
In Labor Force | Age 20-64 Correlation Summary
| Measurement | Bermudan | Immigrants from Austria |
| Minimum | 39.3% | 52.6% |
| Maximum | 91.5% | 100.0% |
| Range | 52.2% | 47.4% |
| Mean | 78.7% | 77.1% |
| Median | 80.7% | 78.0% |
| Interquartile 25% (IQ1) | 77.5% | 72.6% |
| Interquartile 75% (IQ3) | 82.4% | 81.6% |
| Interquartile Range (IQR) | 4.9% | 9.0% |
| Standard Deviation (Sample) | 8.5% | 9.1% |
| Standard Deviation (Population) | 8.4% | 9.0% |
Similar Demographics by In Labor Force | Age 20-64
Demographics Similar to Bermudans by In Labor Force | Age 20-64
In terms of in labor force | age 20-64, the demographic groups most similar to Bermudans are Immigrants from Western Africa (80.0%, a difference of 0.010%), Estonian (80.0%, a difference of 0.020%), Immigrants from South America (80.0%, a difference of 0.020%), Immigrants from Italy (80.0%, a difference of 0.020%), and Sri Lankan (80.0%, a difference of 0.020%).
| Demographics | Rating | Rank | In Labor Force | Age 20-64 |
| Iranians | 94.3 /100 | #108 | Exceptional 80.0% |
| Immigrants | Argentina | 94.1 /100 | #109 | Exceptional 80.0% |
| Estonians | 94.0 /100 | #110 | Exceptional 80.0% |
| Immigrants | South America | 93.9 /100 | #111 | Exceptional 80.0% |
| Immigrants | Italy | 93.9 /100 | #112 | Exceptional 80.0% |
| Sri Lankans | 93.9 /100 | #113 | Exceptional 80.0% |
| Argentineans | 93.8 /100 | #114 | Exceptional 80.0% |
| Bermudans | 93.3 /100 | #115 | Exceptional 80.0% |
| Immigrants | Western Africa | 93.1 /100 | #116 | Exceptional 80.0% |
| Immigrants | Vietnam | 92.7 /100 | #117 | Exceptional 80.0% |
| Cape Verdeans | 92.7 /100 | #118 | Exceptional 80.0% |
| Immigrants | Taiwan | 92.5 /100 | #119 | Exceptional 80.0% |
| Maltese | 92.4 /100 | #120 | Exceptional 80.0% |
| Immigrants | Kuwait | 92.2 /100 | #121 | Exceptional 80.0% |
| Mongolians | 92.0 /100 | #122 | Exceptional 79.9% |
Demographics Similar to Immigrants from Austria by In Labor Force | Age 20-64
In terms of in labor force | age 20-64, the demographic groups most similar to Immigrants from Austria are Immigrants from Thailand (79.4%, a difference of 0.010%), Ecuadorian (79.4%, a difference of 0.010%), Immigrants from Senegal (79.4%, a difference of 0.010%), Immigrants from Denmark (79.4%, a difference of 0.030%), and Indonesian (79.4%, a difference of 0.030%).
| Demographics | Rating | Rank | In Labor Force | Age 20-64 |
| Immigrants | Haiti | 32.1 /100 | #188 | Fair 79.4% |
| Immigrants | El Salvador | 30.9 /100 | #189 | Fair 79.4% |
| Immigrants | Syria | 30.8 /100 | #190 | Fair 79.4% |
| Swiss | 28.9 /100 | #191 | Fair 79.4% |
| Immigrants | Denmark | 26.9 /100 | #192 | Fair 79.4% |
| Indonesians | 26.1 /100 | #193 | Fair 79.4% |
| Immigrants | Thailand | 24.8 /100 | #194 | Fair 79.4% |
| Immigrants | Austria | 23.7 /100 | #195 | Fair 79.4% |
| Ecuadorians | 23.1 /100 | #196 | Fair 79.4% |
| Immigrants | Senegal | 22.5 /100 | #197 | Fair 79.4% |
| Immigrants | Laos | 21.5 /100 | #198 | Fair 79.4% |
| Dutch | 20.2 /100 | #199 | Fair 79.3% |
| Immigrants | Oceania | 19.1 /100 | #200 | Poor 79.3% |
| Immigrants | Nicaragua | 19.0 /100 | #201 | Poor 79.3% |
| Nicaraguans | 18.3 /100 | #202 | Poor 79.3% |