Bermudan vs Cambodian In Labor Force | Age 45-54
COMPARE
Bermudan
Cambodian
In Labor Force | Age 45-54
In Labor Force | Age 45-54 Comparison
Bermudans
Cambodians
83.1%
IN LABOR FORCE | AGE 45-54
88.0/ 100
METRIC RATING
124th/ 347
METRIC RANK
84.1%
IN LABOR FORCE | AGE 45-54
99.9/ 100
METRIC RATING
14th/ 347
METRIC RANK
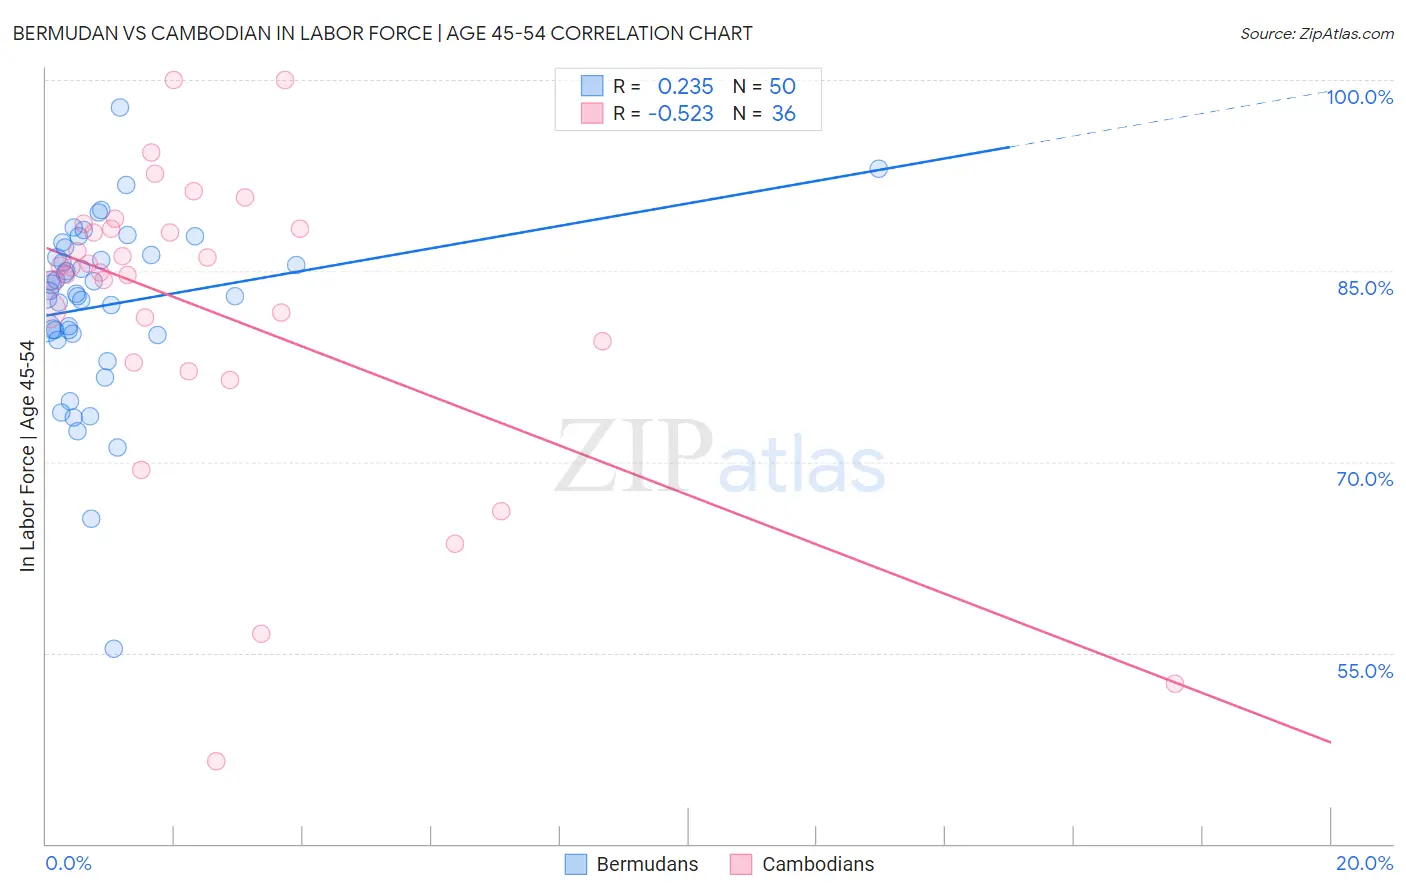
Bermudan vs Cambodian In Labor Force | Age 45-54 Correlation Chart
The statistical analysis conducted on geographies consisting of 55,715,223 people shows a weak positive correlation between the proportion of Bermudans and labor force participation rate among population between the ages 45 and 54 in the United States with a correlation coefficient (R) of 0.235 and weighted average of 83.1%. Similarly, the statistical analysis conducted on geographies consisting of 102,477,530 people shows a substantial negative correlation between the proportion of Cambodians and labor force participation rate among population between the ages 45 and 54 in the United States with a correlation coefficient (R) of -0.523 and weighted average of 84.1%, a difference of 1.2%.
In Labor Force | Age 45-54 Correlation Summary
| Measurement | Bermudan | Cambodian |
| Minimum | 55.3% | 46.5% |
| Maximum | 97.8% | 100.0% |
| Range | 42.5% | 53.5% |
| Mean | 82.3% | 81.9% |
| Median | 83.3% | 85.1% |
| Interquartile 25% (IQ1) | 80.0% | 78.7% |
| Interquartile 75% (IQ3) | 86.3% | 88.3% |
| Interquartile Range (IQR) | 6.3% | 9.6% |
| Standard Deviation (Sample) | 7.1% | 12.0% |
| Standard Deviation (Population) | 7.0% | 11.8% |
Similar Demographics by In Labor Force | Age 45-54
Demographics Similar to Bermudans by In Labor Force | Age 45-54
In terms of in labor force | age 45-54, the demographic groups most similar to Bermudans are Tongan (83.1%, a difference of 0.0%), Immigrants from Vietnam (83.1%, a difference of 0.020%), Immigrants from Iran (83.1%, a difference of 0.020%), Uruguayan (83.1%, a difference of 0.030%), and Immigrants from Belgium (83.1%, a difference of 0.030%).
| Demographics | Rating | Rank | In Labor Force | Age 45-54 |
| Immigrants | China | 90.9 /100 | #117 | Exceptional 83.2% |
| Immigrants | Europe | 90.7 /100 | #118 | Exceptional 83.2% |
| Immigrants | Uruguay | 90.2 /100 | #119 | Exceptional 83.2% |
| Immigrants | Russia | 90.1 /100 | #120 | Exceptional 83.2% |
| Uruguayans | 89.4 /100 | #121 | Excellent 83.1% |
| Immigrants | Vietnam | 88.9 /100 | #122 | Excellent 83.1% |
| Tongans | 88.2 /100 | #123 | Excellent 83.1% |
| Bermudans | 88.0 /100 | #124 | Excellent 83.1% |
| Immigrants | Iran | 87.2 /100 | #125 | Excellent 83.1% |
| Immigrants | Belgium | 86.4 /100 | #126 | Excellent 83.1% |
| Immigrants | Jordan | 85.2 /100 | #127 | Excellent 83.1% |
| Germans | 85.1 /100 | #128 | Excellent 83.1% |
| Immigrants | Northern Europe | 85.1 /100 | #129 | Excellent 83.1% |
| Immigrants | Israel | 84.7 /100 | #130 | Excellent 83.1% |
| Finns | 83.3 /100 | #131 | Excellent 83.1% |
Demographics Similar to Cambodians by In Labor Force | Age 45-54
In terms of in labor force | age 45-54, the demographic groups most similar to Cambodians are Chinese (84.1%, a difference of 0.030%), Cypriot (84.1%, a difference of 0.060%), Immigrants from Nepal (84.0%, a difference of 0.080%), Zimbabwean (84.0%, a difference of 0.10%), and Immigrants from South Central Asia (84.0%, a difference of 0.10%).
| Demographics | Rating | Rank | In Labor Force | Age 45-54 |
| Immigrants | Cameroon | 100.0 /100 | #7 | Exceptional 84.6% |
| Sierra Leoneans | 100.0 /100 | #8 | Exceptional 84.5% |
| Immigrants | Sierra Leone | 100.0 /100 | #9 | Exceptional 84.4% |
| Norwegians | 100.0 /100 | #10 | Exceptional 84.4% |
| Thais | 100.0 /100 | #11 | Exceptional 84.3% |
| Bulgarians | 100.0 /100 | #12 | Exceptional 84.2% |
| Chinese | 99.9 /100 | #13 | Exceptional 84.1% |
| Cambodians | 99.9 /100 | #14 | Exceptional 84.1% |
| Cypriots | 99.9 /100 | #15 | Exceptional 84.1% |
| Immigrants | Nepal | 99.9 /100 | #16 | Exceptional 84.0% |
| Zimbabweans | 99.9 /100 | #17 | Exceptional 84.0% |
| Immigrants | South Central Asia | 99.9 /100 | #18 | Exceptional 84.0% |
| Czechs | 99.8 /100 | #19 | Exceptional 83.9% |
| Immigrants | Eastern Africa | 99.8 /100 | #20 | Exceptional 83.9% |
| Immigrants | Sri Lanka | 99.8 /100 | #21 | Exceptional 83.9% |