Austrian vs Immigrants from Laos In Labor Force | Age 45-54
COMPARE
Austrian
Immigrants from Laos
In Labor Force | Age 45-54
In Labor Force | Age 45-54 Comparison
Austrians
Immigrants from Laos
83.0%
IN LABOR FORCE | AGE 45-54
81.3/ 100
METRIC RATING
135th/ 347
METRIC RANK
81.6%
IN LABOR FORCE | AGE 45-54
0.2/ 100
METRIC RATING
254th/ 347
METRIC RANK
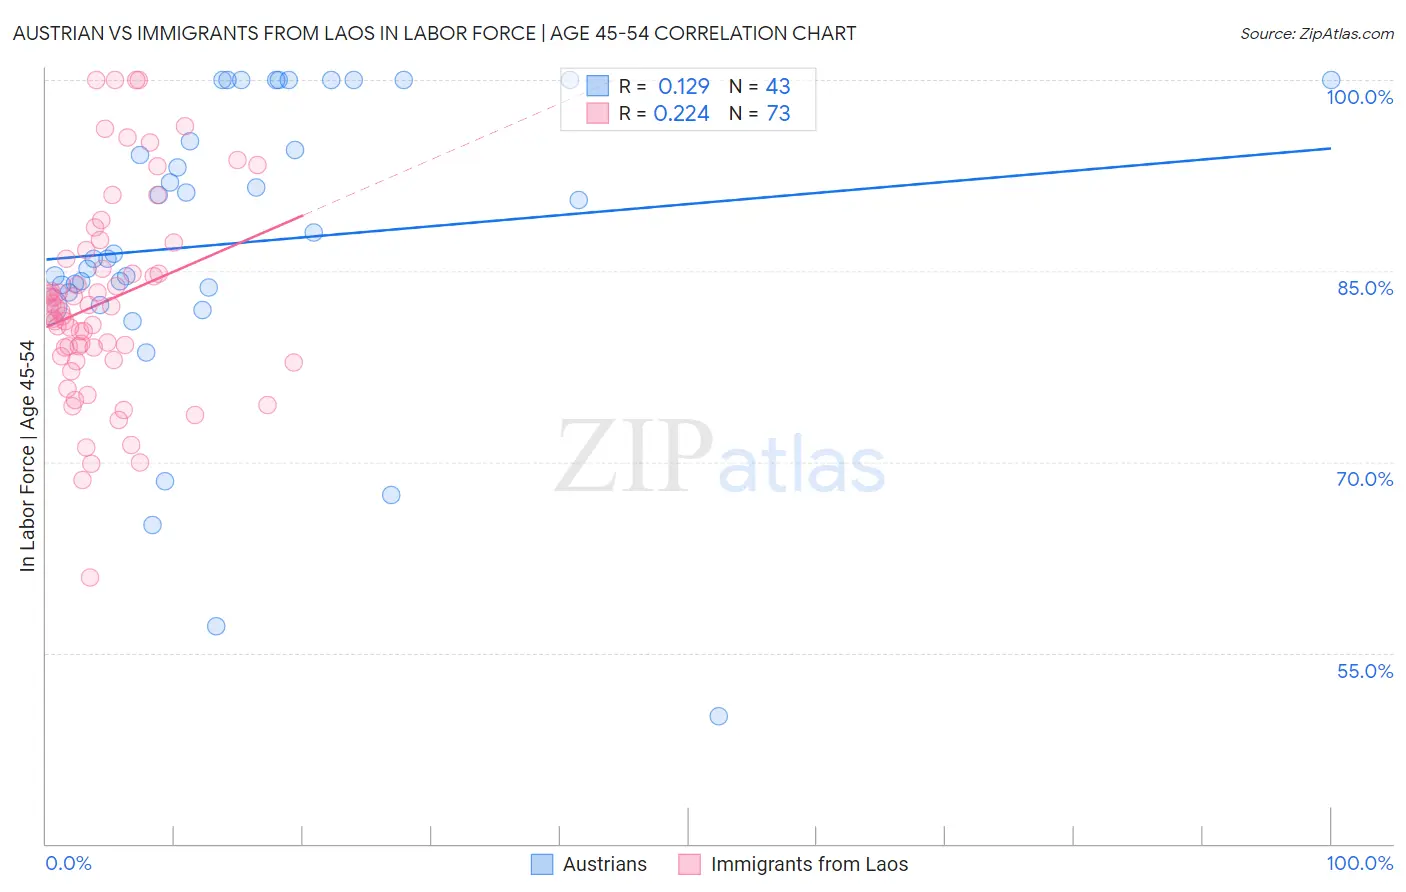
Austrian vs Immigrants from Laos In Labor Force | Age 45-54 Correlation Chart
The statistical analysis conducted on geographies consisting of 451,779,620 people shows a poor positive correlation between the proportion of Austrians and labor force participation rate among population between the ages 45 and 54 in the United States with a correlation coefficient (R) of 0.129 and weighted average of 83.0%. Similarly, the statistical analysis conducted on geographies consisting of 201,465,424 people shows a weak positive correlation between the proportion of Immigrants from Laos and labor force participation rate among population between the ages 45 and 54 in the United States with a correlation coefficient (R) of 0.224 and weighted average of 81.6%, a difference of 1.7%.
In Labor Force | Age 45-54 Correlation Summary
| Measurement | Austrian | Immigrants from Laos |
| Minimum | 50.0% | 60.9% |
| Maximum | 100.0% | 100.0% |
| Range | 50.0% | 39.1% |
| Mean | 87.2% | 82.6% |
| Median | 86.4% | 81.9% |
| Interquartile 25% (IQ1) | 83.3% | 78.2% |
| Interquartile 75% (IQ3) | 100.0% | 86.3% |
| Interquartile Range (IQR) | 16.7% | 8.2% |
| Standard Deviation (Sample) | 11.8% | 8.0% |
| Standard Deviation (Population) | 11.7% | 7.9% |
Similar Demographics by In Labor Force | Age 45-54
Demographics Similar to Austrians by In Labor Force | Age 45-54
In terms of in labor force | age 45-54, the demographic groups most similar to Austrians are Immigrants from Kazakhstan (83.0%, a difference of 0.0%), Sudanese (83.0%, a difference of 0.010%), Immigrants from Spain (83.0%, a difference of 0.010%), Liberian (83.0%, a difference of 0.020%), and Ghanaian (83.0%, a difference of 0.020%).
| Demographics | Rating | Rank | In Labor Force | Age 45-54 |
| Germans | 85.1 /100 | #128 | Excellent 83.1% |
| Immigrants | Northern Europe | 85.1 /100 | #129 | Excellent 83.1% |
| Immigrants | Israel | 84.7 /100 | #130 | Excellent 83.1% |
| Finns | 83.3 /100 | #131 | Excellent 83.1% |
| Immigrants | Ukraine | 82.9 /100 | #132 | Excellent 83.0% |
| Liberians | 82.7 /100 | #133 | Excellent 83.0% |
| Sudanese | 82.0 /100 | #134 | Excellent 83.0% |
| Austrians | 81.3 /100 | #135 | Excellent 83.0% |
| Immigrants | Kazakhstan | 81.0 /100 | #136 | Excellent 83.0% |
| Immigrants | Spain | 80.4 /100 | #137 | Excellent 83.0% |
| Ghanaians | 79.5 /100 | #138 | Good 83.0% |
| Scandinavians | 78.5 /100 | #139 | Good 83.0% |
| Yugoslavians | 78.3 /100 | #140 | Good 83.0% |
| Immigrants | Haiti | 77.9 /100 | #141 | Good 83.0% |
| Immigrants | Scotland | 77.8 /100 | #142 | Good 83.0% |
Demographics Similar to Immigrants from Laos by In Labor Force | Age 45-54
In terms of in labor force | age 45-54, the demographic groups most similar to Immigrants from Laos are Japanese (81.6%, a difference of 0.010%), Scotch-Irish (81.6%, a difference of 0.020%), Pennsylvania German (81.6%, a difference of 0.030%), Barbadian (81.6%, a difference of 0.040%), and Guamanian/Chamorro (81.6%, a difference of 0.050%).
| Demographics | Rating | Rank | In Labor Force | Age 45-54 |
| Central Americans | 0.4 /100 | #247 | Tragic 81.7% |
| Puget Sound Salish | 0.3 /100 | #248 | Tragic 81.7% |
| Hmong | 0.3 /100 | #249 | Tragic 81.7% |
| Immigrants | Armenia | 0.2 /100 | #250 | Tragic 81.7% |
| Guamanians/Chamorros | 0.2 /100 | #251 | Tragic 81.6% |
| Pennsylvania Germans | 0.2 /100 | #252 | Tragic 81.6% |
| Japanese | 0.2 /100 | #253 | Tragic 81.6% |
| Immigrants | Laos | 0.2 /100 | #254 | Tragic 81.6% |
| Scotch-Irish | 0.2 /100 | #255 | Tragic 81.6% |
| Barbadians | 0.1 /100 | #256 | Tragic 81.6% |
| Immigrants | Congo | 0.1 /100 | #257 | Tragic 81.6% |
| Immigrants | Fiji | 0.1 /100 | #258 | Tragic 81.5% |
| Guyanese | 0.1 /100 | #259 | Tragic 81.5% |
| Spaniards | 0.1 /100 | #260 | Tragic 81.5% |
| Hawaiians | 0.1 /100 | #261 | Tragic 81.5% |