Alsatian vs Iroquois In Labor Force | Age 45-54
COMPARE
Alsatian
Iroquois
In Labor Force | Age 45-54
In Labor Force | Age 45-54 Comparison
Alsatians
Iroquois
81.3%
IN LABOR FORCE | AGE 45-54
0.0/ 100
METRIC RATING
269th/ 347
METRIC RANK
80.6%
IN LABOR FORCE | AGE 45-54
0.0/ 100
METRIC RATING
292nd/ 347
METRIC RANK
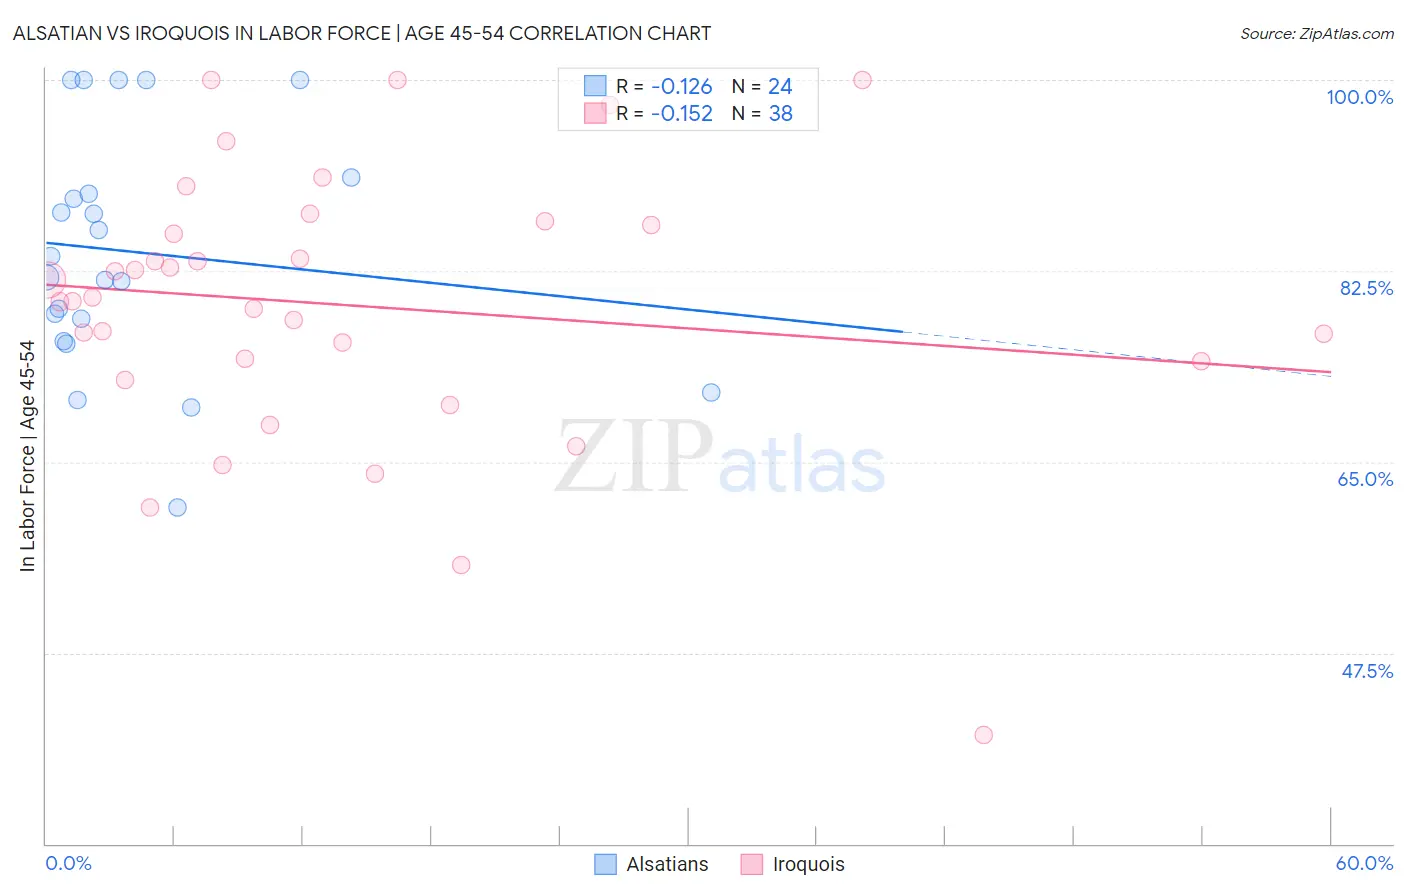
Alsatian vs Iroquois In Labor Force | Age 45-54 Correlation Chart
The statistical analysis conducted on geographies consisting of 82,679,176 people shows a poor negative correlation between the proportion of Alsatians and labor force participation rate among population between the ages 45 and 54 in the United States with a correlation coefficient (R) of -0.126 and weighted average of 81.3%. Similarly, the statistical analysis conducted on geographies consisting of 207,246,780 people shows a poor negative correlation between the proportion of Iroquois and labor force participation rate among population between the ages 45 and 54 in the United States with a correlation coefficient (R) of -0.152 and weighted average of 80.6%, a difference of 0.91%.
In Labor Force | Age 45-54 Correlation Summary
| Measurement | Alsatian | Iroquois |
| Minimum | 60.8% | 40.0% |
| Maximum | 100.0% | 100.0% |
| Range | 39.2% | 60.0% |
| Mean | 84.2% | 79.3% |
| Median | 82.9% | 79.9% |
| Interquartile 25% (IQ1) | 77.1% | 74.2% |
| Interquartile 75% (IQ3) | 90.3% | 86.7% |
| Interquartile Range (IQR) | 13.2% | 12.5% |
| Standard Deviation (Sample) | 10.9% | 12.6% |
| Standard Deviation (Population) | 10.7% | 12.4% |
Similar Demographics by In Labor Force | Age 45-54
Demographics Similar to Alsatians by In Labor Force | Age 45-54
In terms of in labor force | age 45-54, the demographic groups most similar to Alsatians are Immigrants from Honduras (81.4%, a difference of 0.020%), Bangladeshi (81.3%, a difference of 0.030%), West Indian (81.4%, a difference of 0.040%), Immigrants from Barbados (81.3%, a difference of 0.040%), and Spanish (81.3%, a difference of 0.040%).
| Demographics | Rating | Rank | In Labor Force | Age 45-54 |
| Immigrants | Guyana | 0.1 /100 | #262 | Tragic 81.5% |
| Indonesians | 0.1 /100 | #263 | Tragic 81.5% |
| Immigrants | West Indies | 0.1 /100 | #264 | Tragic 81.5% |
| Hondurans | 0.1 /100 | #265 | Tragic 81.4% |
| Immigrants | St. Vincent and the Grenadines | 0.1 /100 | #266 | Tragic 81.4% |
| West Indians | 0.1 /100 | #267 | Tragic 81.4% |
| Immigrants | Honduras | 0.0 /100 | #268 | Tragic 81.4% |
| Alsatians | 0.0 /100 | #269 | Tragic 81.3% |
| Bangladeshis | 0.0 /100 | #270 | Tragic 81.3% |
| Immigrants | Barbados | 0.0 /100 | #271 | Tragic 81.3% |
| Spanish | 0.0 /100 | #272 | Tragic 81.3% |
| Chippewa | 0.0 /100 | #273 | Tragic 81.3% |
| British West Indians | 0.0 /100 | #274 | Tragic 81.2% |
| Immigrants | Nonimmigrants | 0.0 /100 | #275 | Tragic 81.2% |
| U.S. Virgin Islanders | 0.0 /100 | #276 | Tragic 81.2% |
Demographics Similar to Iroquois by In Labor Force | Age 45-54
In terms of in labor force | age 45-54, the demographic groups most similar to Iroquois are Osage (80.6%, a difference of 0.020%), Yakama (80.6%, a difference of 0.020%), Immigrants from Belize (80.6%, a difference of 0.030%), Nepalese (80.5%, a difference of 0.090%), and African (80.5%, a difference of 0.12%).
| Demographics | Rating | Rank | In Labor Force | Age 45-54 |
| Delaware | 0.0 /100 | #285 | Tragic 80.8% |
| Immigrants | Dominica | 0.0 /100 | #286 | Tragic 80.8% |
| Vietnamese | 0.0 /100 | #287 | Tragic 80.8% |
| Cree | 0.0 /100 | #288 | Tragic 80.8% |
| Immigrants | Bangladesh | 0.0 /100 | #289 | Tragic 80.7% |
| Mexican American Indians | 0.0 /100 | #290 | Tragic 80.7% |
| Immigrants | Belize | 0.0 /100 | #291 | Tragic 80.6% |
| Iroquois | 0.0 /100 | #292 | Tragic 80.6% |
| Osage | 0.0 /100 | #293 | Tragic 80.6% |
| Yakama | 0.0 /100 | #294 | Tragic 80.6% |
| Nepalese | 0.0 /100 | #295 | Tragic 80.5% |
| Africans | 0.0 /100 | #296 | Tragic 80.5% |
| Americans | 0.0 /100 | #297 | Tragic 80.4% |
| Marshallese | 0.0 /100 | #298 | Tragic 80.3% |
| Dominicans | 0.0 /100 | #299 | Tragic 80.3% |