Alaska Native vs Immigrants from Guatemala In Labor Force | Age 30-34
COMPARE
Alaska Native
Immigrants from Guatemala
In Labor Force | Age 30-34
In Labor Force | Age 30-34 Comparison
Alaska Natives
Immigrants from Guatemala
81.3%
IN LABOR FORCE | AGE 30-34
0.0/ 100
METRIC RATING
321st/ 347
METRIC RANK
83.7%
IN LABOR FORCE | AGE 30-34
0.1/ 100
METRIC RATING
266th/ 347
METRIC RANK
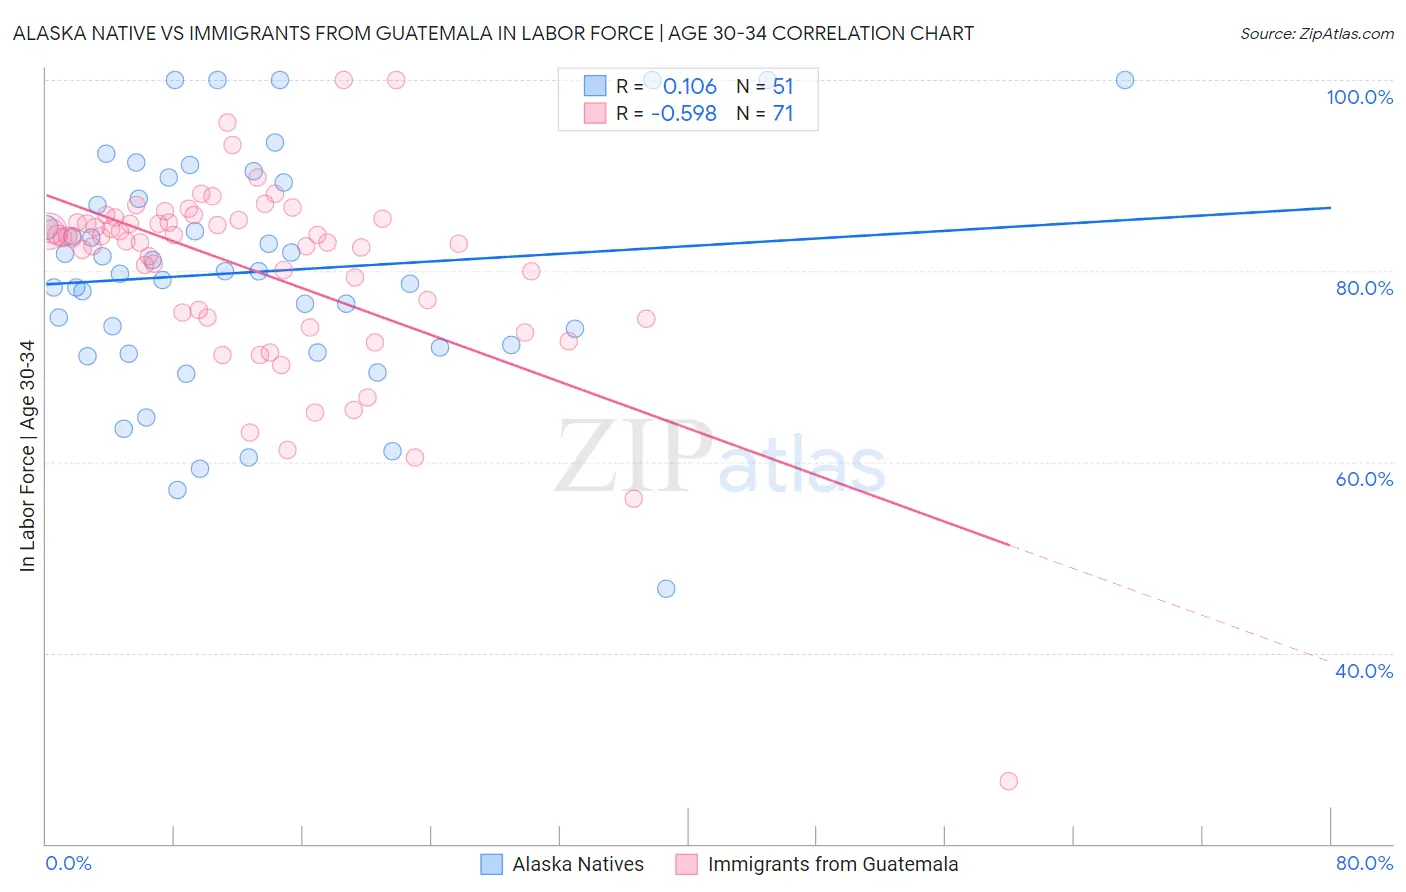
Alaska Native vs Immigrants from Guatemala In Labor Force | Age 30-34 Correlation Chart
The statistical analysis conducted on geographies consisting of 76,755,114 people shows a poor positive correlation between the proportion of Alaska Natives and labor force participation rate among population between the ages 30 and 34 in the United States with a correlation coefficient (R) of 0.106 and weighted average of 81.3%. Similarly, the statistical analysis conducted on geographies consisting of 377,154,484 people shows a substantial negative correlation between the proportion of Immigrants from Guatemala and labor force participation rate among population between the ages 30 and 34 in the United States with a correlation coefficient (R) of -0.598 and weighted average of 83.7%, a difference of 2.9%.
In Labor Force | Age 30-34 Correlation Summary
| Measurement | Alaska Native | Immigrants from Guatemala |
| Minimum | 46.7% | 26.6% |
| Maximum | 100.0% | 100.0% |
| Range | 53.3% | 73.4% |
| Mean | 79.9% | 80.1% |
| Median | 80.0% | 83.5% |
| Interquartile 25% (IQ1) | 72.0% | 75.1% |
| Interquartile 75% (IQ3) | 89.3% | 85.3% |
| Interquartile Range (IQR) | 17.3% | 10.2% |
| Standard Deviation (Sample) | 12.2% | 10.6% |
| Standard Deviation (Population) | 12.1% | 10.6% |
Similar Demographics by In Labor Force | Age 30-34
Demographics Similar to Alaska Natives by In Labor Force | Age 30-34
In terms of in labor force | age 30-34, the demographic groups most similar to Alaska Natives are Yaqui (81.4%, a difference of 0.080%), Choctaw (81.4%, a difference of 0.10%), Shoshone (81.4%, a difference of 0.10%), Puerto Rican (81.2%, a difference of 0.16%), and Immigrants from the Azores (81.5%, a difference of 0.18%).
| Demographics | Rating | Rank | In Labor Force | Age 30-34 |
| Alaskan Athabascans | 0.0 /100 | #314 | Tragic 81.7% |
| Cherokee | 0.0 /100 | #315 | Tragic 81.6% |
| Immigrants | Azores | 0.0 /100 | #316 | Tragic 81.5% |
| Arapaho | 0.0 /100 | #317 | Tragic 81.5% |
| Choctaw | 0.0 /100 | #318 | Tragic 81.4% |
| Shoshone | 0.0 /100 | #319 | Tragic 81.4% |
| Yaqui | 0.0 /100 | #320 | Tragic 81.4% |
| Alaska Natives | 0.0 /100 | #321 | Tragic 81.3% |
| Puerto Ricans | 0.0 /100 | #322 | Tragic 81.2% |
| Paiute | 0.0 /100 | #323 | Tragic 81.2% |
| Cheyenne | 0.0 /100 | #324 | Tragic 81.1% |
| Dutch West Indians | 0.0 /100 | #325 | Tragic 81.0% |
| Seminole | 0.0 /100 | #326 | Tragic 80.8% |
| Colville | 0.0 /100 | #327 | Tragic 80.7% |
| Sioux | 0.0 /100 | #328 | Tragic 80.4% |
Demographics Similar to Immigrants from Guatemala by In Labor Force | Age 30-34
In terms of in labor force | age 30-34, the demographic groups most similar to Immigrants from Guatemala are Immigrants from Honduras (83.7%, a difference of 0.020%), Guatemalan (83.7%, a difference of 0.050%), Immigrants from Guyana (83.8%, a difference of 0.090%), Dominican (83.8%, a difference of 0.10%), and Spaniard (83.6%, a difference of 0.10%).
| Demographics | Rating | Rank | In Labor Force | Age 30-34 |
| Scotch-Irish | 0.3 /100 | #259 | Tragic 83.8% |
| Immigrants | Dominican Republic | 0.3 /100 | #260 | Tragic 83.8% |
| Guyanese | 0.3 /100 | #261 | Tragic 83.8% |
| Dominicans | 0.2 /100 | #262 | Tragic 83.8% |
| Immigrants | Guyana | 0.2 /100 | #263 | Tragic 83.8% |
| Guatemalans | 0.2 /100 | #264 | Tragic 83.7% |
| Immigrants | Honduras | 0.1 /100 | #265 | Tragic 83.7% |
| Immigrants | Guatemala | 0.1 /100 | #266 | Tragic 83.7% |
| Spaniards | 0.1 /100 | #267 | Tragic 83.6% |
| Immigrants | Bangladesh | 0.1 /100 | #268 | Tragic 83.6% |
| Vietnamese | 0.1 /100 | #269 | Tragic 83.6% |
| Spanish Americans | 0.0 /100 | #270 | Tragic 83.5% |
| Spanish | 0.0 /100 | #271 | Tragic 83.5% |
| Immigrants | Nonimmigrants | 0.0 /100 | #272 | Tragic 83.5% |
| Guamanians/Chamorros | 0.0 /100 | #273 | Tragic 83.5% |