Alaska Native vs Immigrants from Colombia In Labor Force | Age 25-29
COMPARE
Alaska Native
Immigrants from Colombia
In Labor Force | Age 25-29
In Labor Force | Age 25-29 Comparison
Alaska Natives
Immigrants from Colombia
81.6%
IN LABOR FORCE | AGE 25-29
0.0/ 100
METRIC RATING
323rd/ 347
METRIC RANK
84.7%
IN LABOR FORCE | AGE 25-29
58.3/ 100
METRIC RATING
162nd/ 347
METRIC RANK
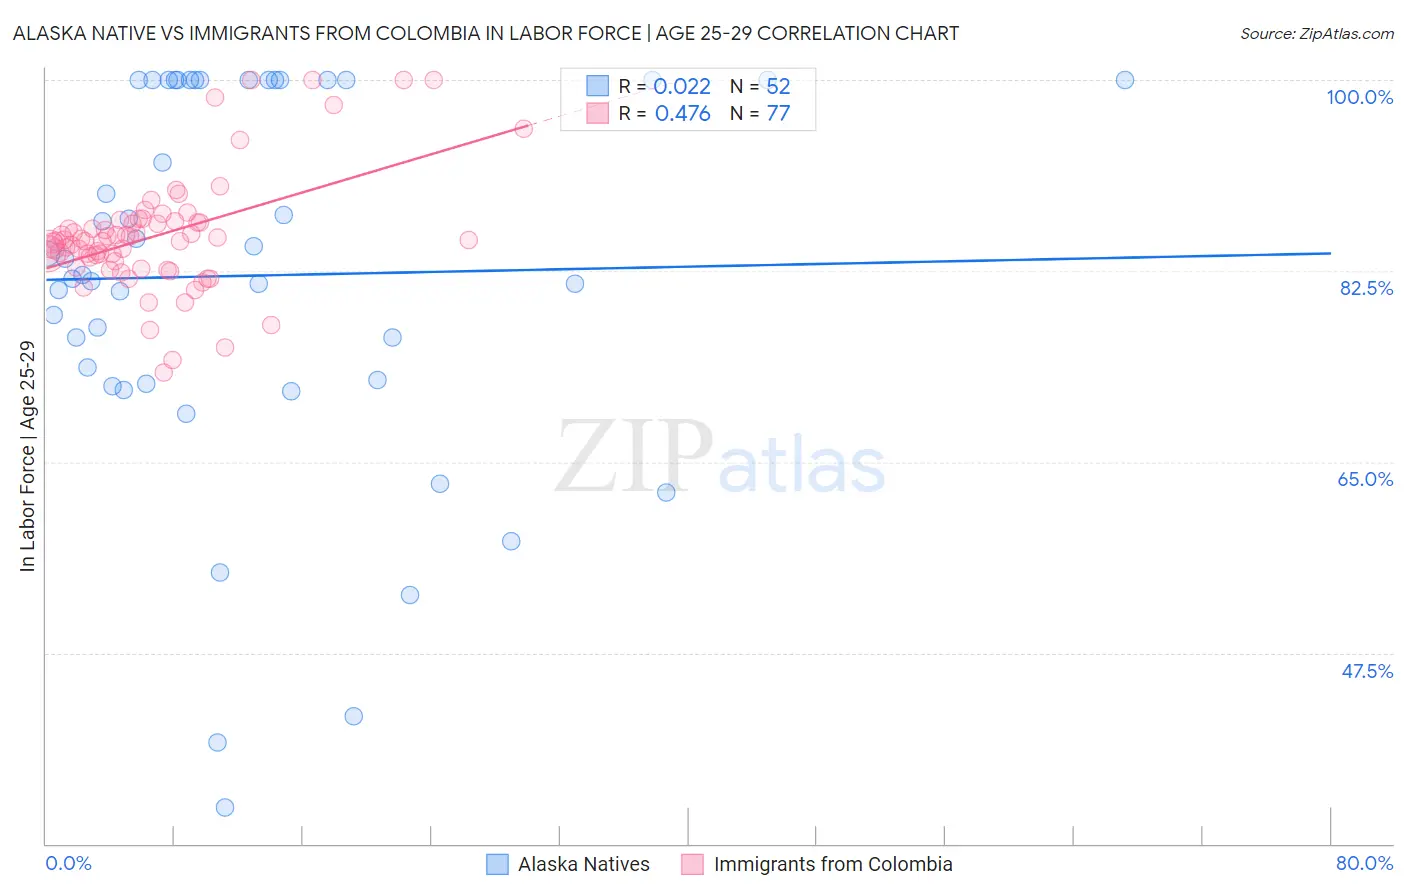
Alaska Native vs Immigrants from Colombia In Labor Force | Age 25-29 Correlation Chart
The statistical analysis conducted on geographies consisting of 76,769,069 people shows no correlation between the proportion of Alaska Natives and labor force participation rate among population between the ages 25 and 29 in the United States with a correlation coefficient (R) of 0.022 and weighted average of 81.6%. Similarly, the statistical analysis conducted on geographies consisting of 378,572,642 people shows a moderate positive correlation between the proportion of Immigrants from Colombia and labor force participation rate among population between the ages 25 and 29 in the United States with a correlation coefficient (R) of 0.476 and weighted average of 84.7%, a difference of 3.9%.
In Labor Force | Age 25-29 Correlation Summary
| Measurement | Alaska Native | Immigrants from Colombia |
| Minimum | 33.3% | 73.2% |
| Maximum | 100.0% | 100.0% |
| Range | 66.7% | 26.8% |
| Mean | 82.1% | 85.8% |
| Median | 82.8% | 85.3% |
| Interquartile 25% (IQ1) | 72.3% | 83.1% |
| Interquartile 75% (IQ3) | 100.0% | 87.0% |
| Interquartile Range (IQR) | 27.7% | 3.9% |
| Standard Deviation (Sample) | 17.4% | 5.4% |
| Standard Deviation (Population) | 17.2% | 5.3% |
Similar Demographics by In Labor Force | Age 25-29
Demographics Similar to Alaska Natives by In Labor Force | Age 25-29
In terms of in labor force | age 25-29, the demographic groups most similar to Alaska Natives are Kiowa (81.6%, a difference of 0.050%), Shoshone (81.6%, a difference of 0.060%), Colville (81.6%, a difference of 0.11%), Seminole (81.7%, a difference of 0.16%), and Comanche (81.9%, a difference of 0.38%).
| Demographics | Rating | Rank | In Labor Force | Age 25-29 |
| Mexicans | 0.0 /100 | #316 | Tragic 81.9% |
| Chickasaw | 0.0 /100 | #317 | Tragic 81.9% |
| Comanche | 0.0 /100 | #318 | Tragic 81.9% |
| Seminole | 0.0 /100 | #319 | Tragic 81.7% |
| Colville | 0.0 /100 | #320 | Tragic 81.6% |
| Shoshone | 0.0 /100 | #321 | Tragic 81.6% |
| Kiowa | 0.0 /100 | #322 | Tragic 81.6% |
| Alaska Natives | 0.0 /100 | #323 | Tragic 81.6% |
| Houma | 0.0 /100 | #324 | Tragic 81.2% |
| Dutch West Indians | 0.0 /100 | #325 | Tragic 81.1% |
| Choctaw | 0.0 /100 | #326 | Tragic 81.0% |
| Ute | 0.0 /100 | #327 | Tragic 80.8% |
| Creek | 0.0 /100 | #328 | Tragic 80.7% |
| Yakama | 0.0 /100 | #329 | Tragic 80.6% |
| Puerto Ricans | 0.0 /100 | #330 | Tragic 80.4% |
Demographics Similar to Immigrants from Colombia by In Labor Force | Age 25-29
In terms of in labor force | age 25-29, the demographic groups most similar to Immigrants from Colombia are Immigrants from Peru (84.7%, a difference of 0.0%), Canadian (84.7%, a difference of 0.0%), Argentinean (84.7%, a difference of 0.0%), Ghanaian (84.7%, a difference of 0.0%), and Immigrants from Ghana (84.7%, a difference of 0.010%).
| Demographics | Rating | Rank | In Labor Force | Age 25-29 |
| Indians (Asian) | 61.6 /100 | #155 | Good 84.7% |
| French | 61.0 /100 | #156 | Good 84.7% |
| British | 60.4 /100 | #157 | Good 84.7% |
| Immigrants | Ghana | 60.2 /100 | #158 | Good 84.7% |
| Immigrants | Western Africa | 60.1 /100 | #159 | Good 84.7% |
| Immigrants | Peru | 58.6 /100 | #160 | Average 84.7% |
| Canadians | 58.5 /100 | #161 | Average 84.7% |
| Immigrants | Colombia | 58.3 /100 | #162 | Average 84.7% |
| Argentineans | 57.9 /100 | #163 | Average 84.7% |
| Ghanaians | 57.6 /100 | #164 | Average 84.7% |
| Immigrants | Burma/Myanmar | 57.4 /100 | #165 | Average 84.7% |
| Immigrants | Spain | 56.9 /100 | #166 | Average 84.7% |
| Indonesians | 56.5 /100 | #167 | Average 84.7% |
| South Americans | 54.9 /100 | #168 | Average 84.7% |
| Celtics | 52.5 /100 | #169 | Average 84.7% |