Afghan vs Immigrants from Philippines In Labor Force | Age > 16
COMPARE
Afghan
Immigrants from Philippines
In Labor Force | Age > 16
In Labor Force | Age > 16 Comparison
Afghans
Immigrants from Philippines
67.1%
IN LABOR FORCE | AGE > 16
100.0/ 100
METRIC RATING
33rd/ 347
METRIC RANK
65.6%
IN LABOR FORCE | AGE > 16
94.5/ 100
METRIC RATING
129th/ 347
METRIC RANK
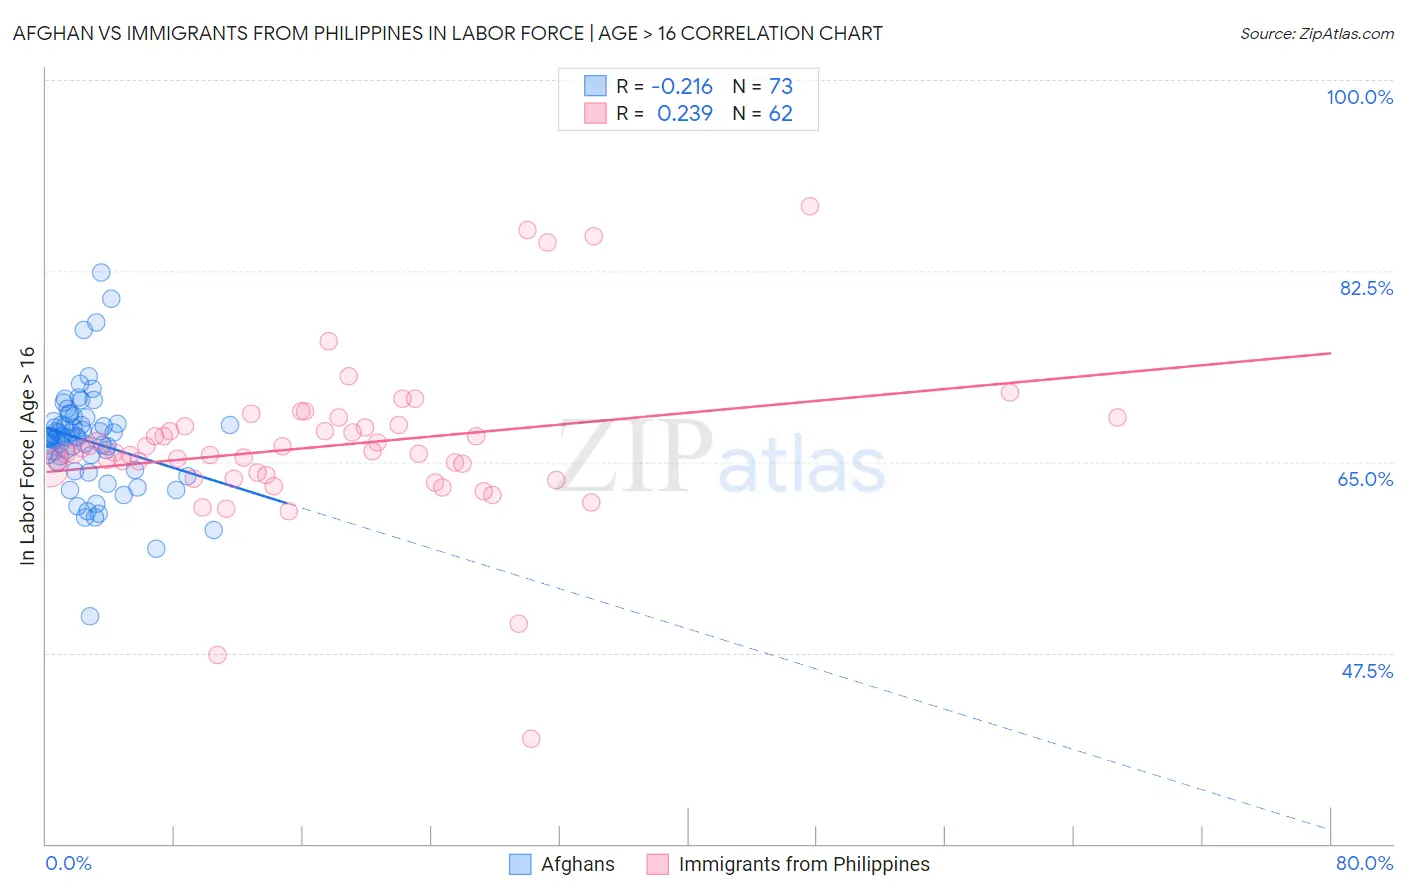
Afghan vs Immigrants from Philippines In Labor Force | Age > 16 Correlation Chart
The statistical analysis conducted on geographies consisting of 148,872,277 people shows a weak negative correlation between the proportion of Afghans and labor force participation rate among population ages 16 and over in the United States with a correlation coefficient (R) of -0.216 and weighted average of 67.1%. Similarly, the statistical analysis conducted on geographies consisting of 471,291,976 people shows a weak positive correlation between the proportion of Immigrants from Philippines and labor force participation rate among population ages 16 and over in the United States with a correlation coefficient (R) of 0.239 and weighted average of 65.6%, a difference of 2.2%.
In Labor Force | Age > 16 Correlation Summary
| Measurement | Afghan | Immigrants from Philippines |
| Minimum | 50.8% | 39.6% |
| Maximum | 82.3% | 88.4% |
| Range | 31.5% | 48.8% |
| Mean | 66.9% | 66.5% |
| Median | 67.2% | 65.8% |
| Interquartile 25% (IQ1) | 64.6% | 63.8% |
| Interquartile 75% (IQ3) | 68.6% | 68.3% |
| Interquartile Range (IQR) | 4.0% | 4.5% |
| Standard Deviation (Sample) | 4.8% | 7.5% |
| Standard Deviation (Population) | 4.8% | 7.5% |
Similar Demographics by In Labor Force | Age > 16
Demographics Similar to Afghans by In Labor Force | Age > 16
In terms of in labor force | age > 16, the demographic groups most similar to Afghans are Immigrants from Congo (67.1%, a difference of 0.0%), Immigrants from Ghana (67.1%, a difference of 0.010%), Ghanaian (67.1%, a difference of 0.060%), Immigrants from South Central Asia (67.1%, a difference of 0.070%), and Immigrants from Western Africa (67.1%, a difference of 0.070%).
| Demographics | Rating | Rank | In Labor Force | Age > 16 |
| Immigrants | Cabo Verde | 100.0 /100 | #26 | Exceptional 67.3% |
| Zimbabweans | 100.0 /100 | #27 | Exceptional 67.3% |
| Immigrants | Morocco | 100.0 /100 | #28 | Exceptional 67.2% |
| Thais | 100.0 /100 | #29 | Exceptional 67.2% |
| Immigrants | Zaire | 100.0 /100 | #30 | Exceptional 67.2% |
| Ghanaians | 100.0 /100 | #31 | Exceptional 67.1% |
| Immigrants | Congo | 100.0 /100 | #32 | Exceptional 67.1% |
| Afghans | 100.0 /100 | #33 | Exceptional 67.1% |
| Immigrants | Ghana | 100.0 /100 | #34 | Exceptional 67.1% |
| Immigrants | South Central Asia | 100.0 /100 | #35 | Exceptional 67.1% |
| Immigrants | Western Africa | 100.0 /100 | #36 | Exceptional 67.1% |
| Immigrants | Afghanistan | 100.0 /100 | #37 | Exceptional 67.0% |
| Immigrants | Nigeria | 100.0 /100 | #38 | Exceptional 66.9% |
| Salvadorans | 100.0 /100 | #39 | Exceptional 66.8% |
| Immigrants | El Salvador | 100.0 /100 | #40 | Exceptional 66.8% |
Demographics Similar to Immigrants from Philippines by In Labor Force | Age > 16
In terms of in labor force | age > 16, the demographic groups most similar to Immigrants from Philippines are Immigrants from Guatemala (65.6%, a difference of 0.0%), Ecuadorian (65.6%, a difference of 0.010%), Icelander (65.6%, a difference of 0.010%), Immigrants from Eastern Asia (65.7%, a difference of 0.020%), and Immigrants from North Macedonia (65.6%, a difference of 0.020%).
| Demographics | Rating | Rank | In Labor Force | Age > 16 |
| Immigrants | Ecuador | 95.9 /100 | #122 | Exceptional 65.7% |
| Immigrants | Iraq | 95.5 /100 | #123 | Exceptional 65.7% |
| Iraqis | 95.4 /100 | #124 | Exceptional 65.7% |
| Norwegians | 95.3 /100 | #125 | Exceptional 65.7% |
| Koreans | 95.3 /100 | #126 | Exceptional 65.7% |
| Immigrants | Eastern Asia | 94.9 /100 | #127 | Exceptional 65.7% |
| Ecuadorians | 94.7 /100 | #128 | Exceptional 65.6% |
| Immigrants | Philippines | 94.5 /100 | #129 | Exceptional 65.6% |
| Immigrants | Guatemala | 94.4 /100 | #130 | Exceptional 65.6% |
| Icelanders | 94.3 /100 | #131 | Exceptional 65.6% |
| Immigrants | North Macedonia | 94.1 /100 | #132 | Exceptional 65.6% |
| Immigrants | Lithuania | 93.5 /100 | #133 | Exceptional 65.6% |
| Costa Ricans | 93.2 /100 | #134 | Exceptional 65.6% |
| Guatemalans | 92.5 /100 | #135 | Exceptional 65.6% |
| Immigrants | Argentina | 92.4 /100 | #136 | Exceptional 65.6% |