Afghan vs Belizean In Labor Force | Age 20-64
COMPARE
Afghan
Belizean
In Labor Force | Age 20-64
In Labor Force | Age 20-64 Comparison
Afghans
Belizeans
80.3%
IN LABOR FORCE | AGE 20-64
98.9/ 100
METRIC RATING
57th/ 347
METRIC RANK
78.2%
IN LABOR FORCE | AGE 20-64
0.0/ 100
METRIC RATING
279th/ 347
METRIC RANK
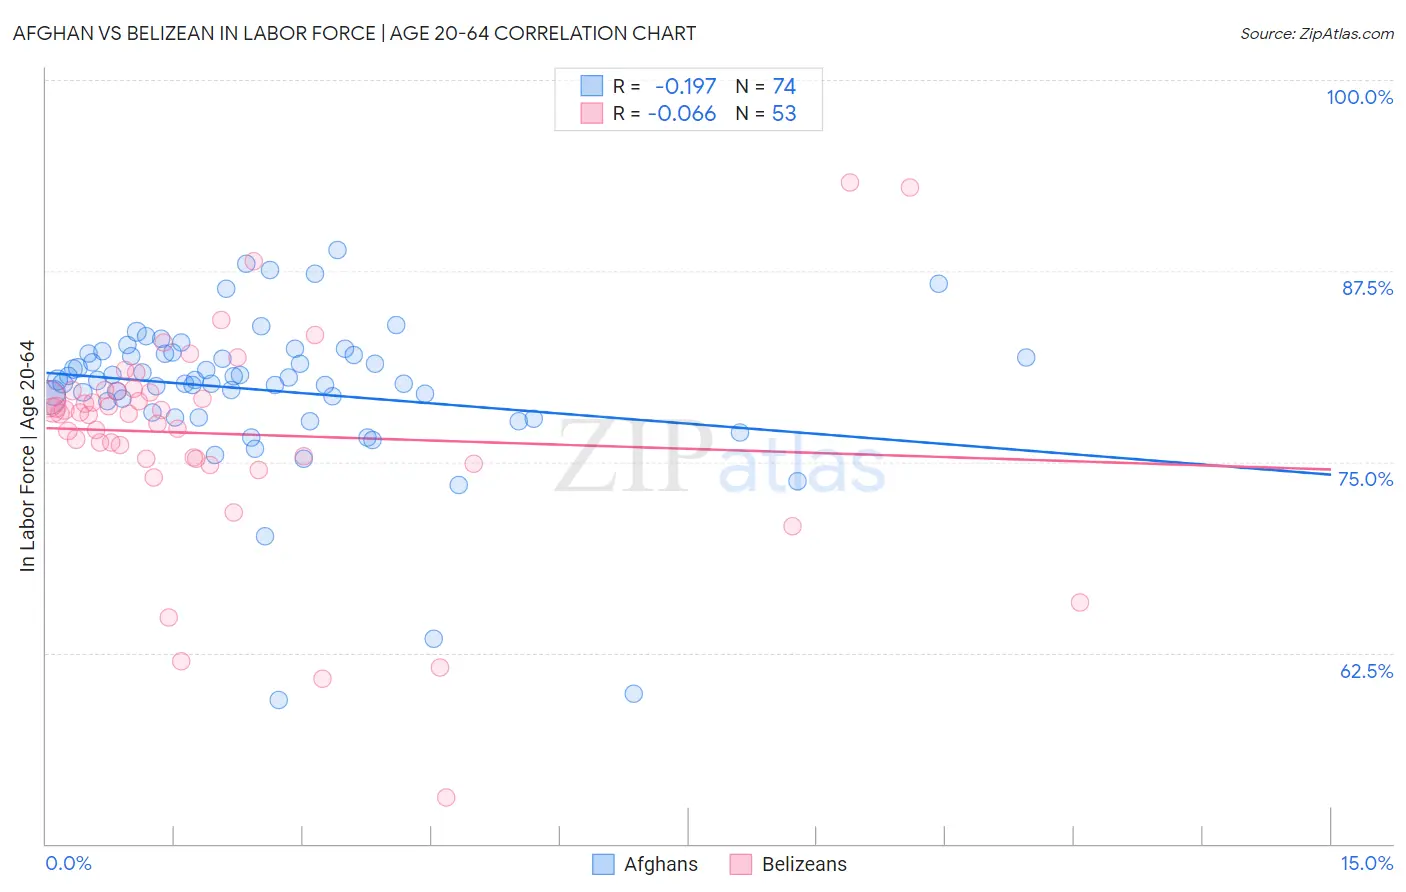
Afghan vs Belizean In Labor Force | Age 20-64 Correlation Chart
The statistical analysis conducted on geographies consisting of 148,874,971 people shows a poor negative correlation between the proportion of Afghans and labor force participation rate among population between the ages 20 and 64 in the United States with a correlation coefficient (R) of -0.197 and weighted average of 80.3%. Similarly, the statistical analysis conducted on geographies consisting of 144,213,246 people shows a slight negative correlation between the proportion of Belizeans and labor force participation rate among population between the ages 20 and 64 in the United States with a correlation coefficient (R) of -0.066 and weighted average of 78.2%, a difference of 2.7%.
In Labor Force | Age 20-64 Correlation Summary
| Measurement | Afghan | Belizean |
| Minimum | 59.4% | 53.0% |
| Maximum | 88.9% | 93.3% |
| Range | 29.5% | 40.3% |
| Mean | 79.7% | 76.8% |
| Median | 80.3% | 78.2% |
| Interquartile 25% (IQ1) | 78.3% | 75.2% |
| Interquartile 75% (IQ3) | 82.1% | 79.7% |
| Interquartile Range (IQR) | 3.8% | 4.5% |
| Standard Deviation (Sample) | 5.1% | 7.1% |
| Standard Deviation (Population) | 5.1% | 7.0% |
Similar Demographics by In Labor Force | Age 20-64
Demographics Similar to Afghans by In Labor Force | Age 20-64
In terms of in labor force | age 20-64, the demographic groups most similar to Afghans are Immigrants from Northern Africa (80.3%, a difference of 0.0%), Immigrants from Cabo Verde (80.3%, a difference of 0.010%), Serbian (80.3%, a difference of 0.010%), Swedish (80.3%, a difference of 0.010%), and Tongan (80.3%, a difference of 0.020%).
| Demographics | Rating | Rank | In Labor Force | Age 20-64 |
| Immigrants | Sudan | 99.4 /100 | #50 | Exceptional 80.4% |
| Immigrants | Sri Lanka | 99.3 /100 | #51 | Exceptional 80.4% |
| Turks | 99.2 /100 | #52 | Exceptional 80.3% |
| Immigrants | Peru | 99.2 /100 | #53 | Exceptional 80.3% |
| Peruvians | 99.1 /100 | #54 | Exceptional 80.3% |
| Immigrants | Cabo Verde | 99.0 /100 | #55 | Exceptional 80.3% |
| Immigrants | Northern Africa | 99.0 /100 | #56 | Exceptional 80.3% |
| Afghans | 98.9 /100 | #57 | Exceptional 80.3% |
| Serbians | 98.9 /100 | #58 | Exceptional 80.3% |
| Swedes | 98.9 /100 | #59 | Exceptional 80.3% |
| Tongans | 98.8 /100 | #60 | Exceptional 80.3% |
| Burmese | 98.8 /100 | #61 | Exceptional 80.3% |
| Carpatho Rusyns | 98.8 /100 | #62 | Exceptional 80.3% |
| Immigrants | Korea | 98.8 /100 | #63 | Exceptional 80.3% |
| Immigrants | Albania | 98.7 /100 | #64 | Exceptional 80.3% |
Demographics Similar to Belizeans by In Labor Force | Age 20-64
In terms of in labor force | age 20-64, the demographic groups most similar to Belizeans are Immigrants from Dominica (78.1%, a difference of 0.040%), Mexican American Indian (78.2%, a difference of 0.050%), Immigrants from Bahamas (78.2%, a difference of 0.060%), Spanish (78.2%, a difference of 0.070%), and Puget Sound Salish (78.2%, a difference of 0.070%).
| Demographics | Rating | Rank | In Labor Force | Age 20-64 |
| Marshallese | 0.0 /100 | #272 | Tragic 78.3% |
| French American Indians | 0.0 /100 | #273 | Tragic 78.2% |
| Aleuts | 0.0 /100 | #274 | Tragic 78.2% |
| Spanish | 0.0 /100 | #275 | Tragic 78.2% |
| Puget Sound Salish | 0.0 /100 | #276 | Tragic 78.2% |
| Immigrants | Bahamas | 0.0 /100 | #277 | Tragic 78.2% |
| Mexican American Indians | 0.0 /100 | #278 | Tragic 78.2% |
| Belizeans | 0.0 /100 | #279 | Tragic 78.2% |
| Immigrants | Dominica | 0.0 /100 | #280 | Tragic 78.1% |
| Guyanese | 0.0 /100 | #281 | Tragic 78.1% |
| Immigrants | St. Vincent and the Grenadines | 0.0 /100 | #282 | Tragic 78.1% |
| Immigrants | Nonimmigrants | 0.0 /100 | #283 | Tragic 78.1% |
| Immigrants | Guyana | 0.0 /100 | #284 | Tragic 78.1% |
| Osage | 0.0 /100 | #285 | Tragic 78.0% |
| Immigrants | Belize | 0.0 /100 | #286 | Tragic 78.0% |