Salvisa, KY Map & Demographics
Salvisa Map
Salvisa Overview
$18,249
PER CAPITA INCOME
$67,167
AVG FAMILY INCOME
$67,167
AVG HOUSEHOLD INCOME
0.33
INEQUALITY / GINI INDEX
258
TOTAL POPULATION
172
MALE POPULATION
86
FEMALE POPULATION
200.00
MALES / 100 FEMALES
50.00
FEMALES / 100 MALES
29.7
MEDIAN AGE
3.6
AVG FAMILY SIZE
3.6
AVG HOUSEHOLD SIZE
133
LABOR FORCE [ PEOPLE ]
74.7%
PERCENT IN LABOR FORCE
20.3%
UNEMPLOYMENT RATE
Salvisa Zip Codes
Salvisa Area Codes
Income in Salvisa
Income Overview in Salvisa
Per Capita Income in Salvisa is $18,249, while median incomes of families and households are $67,167 and $67,167 respectively.
| Characteristic | Number | Measure |
| Per Capita Income | 258 | $18,249 |
| Median Family Income | 72 | $67,167 |
| Mean Family Income | 72 | $58,818 |
| Median Household Income | 72 | $67,167 |
| Mean Household Income | 72 | $58,818 |
| Income Deficit | 72 | $0 |
| Wage / Income Gap (%) | 258 | 0.00% |
| Wage / Income Gap ($) | 258 | 100.00¢ per $1 |
| Gini / Inequality Index | 258 | 0.33 |
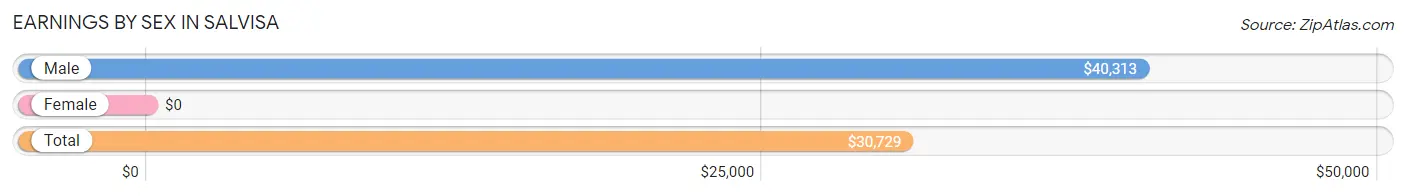
Earnings by Sex in Salvisa
| Sex | Number | Average Earnings |
| Male | 111 (72.6%) | $40,313 |
| Female | 42 (27.5%) | $0 |
| Total | 153 (100.0%) | $30,729 |
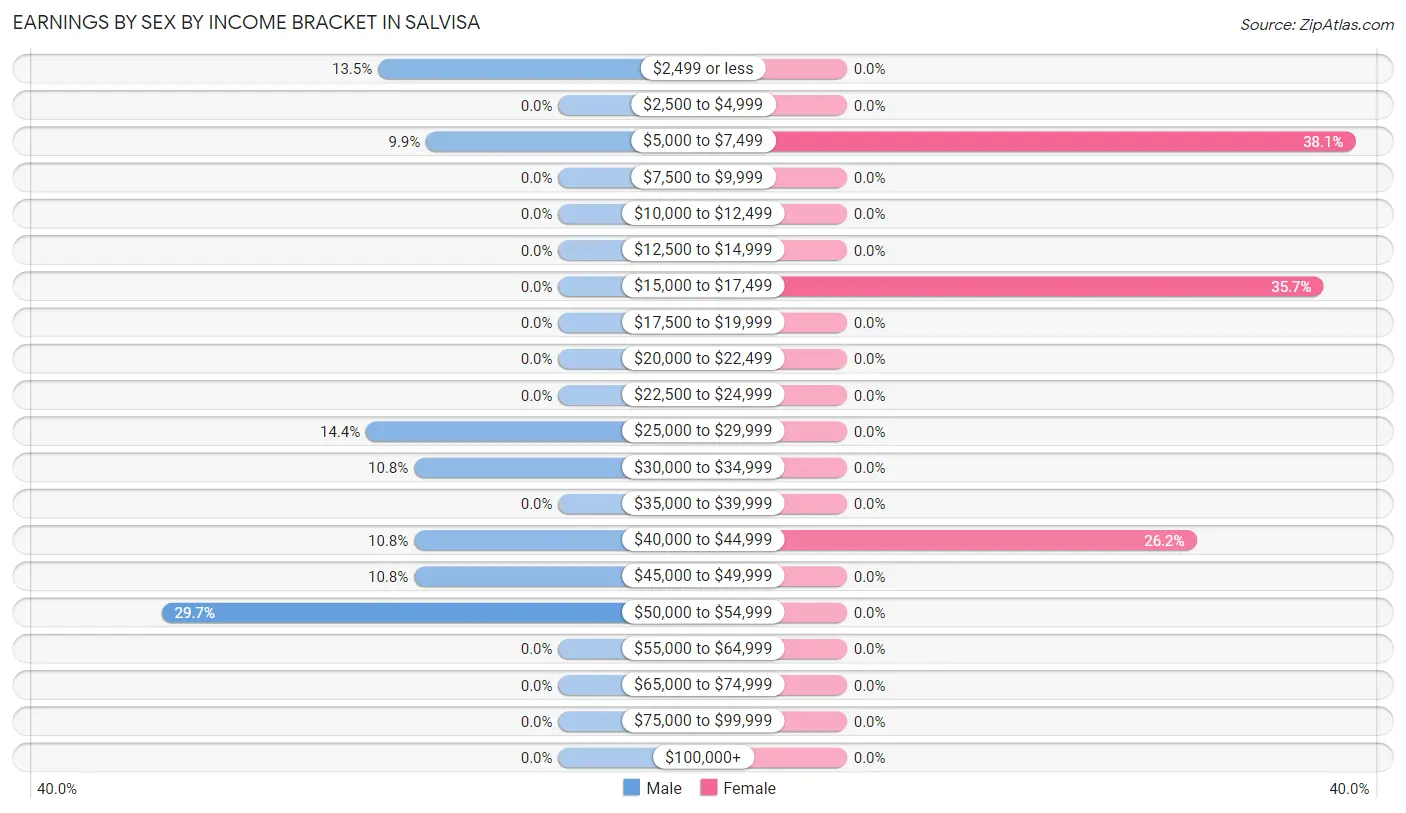
Earnings by Sex by Income Bracket in Salvisa
The most common earnings brackets in Salvisa are $50,000 to $54,999 for men (33 | 29.7%) and $5,000 to $7,499 for women (16 | 38.1%).
| Income | Male | Female |
| $2,499 or less | 15 (13.5%) | 0 (0.0%) |
| $2,500 to $4,999 | 0 (0.0%) | 0 (0.0%) |
| $5,000 to $7,499 | 11 (9.9%) | 16 (38.1%) |
| $7,500 to $9,999 | 0 (0.0%) | 0 (0.0%) |
| $10,000 to $12,499 | 0 (0.0%) | 0 (0.0%) |
| $12,500 to $14,999 | 0 (0.0%) | 0 (0.0%) |
| $15,000 to $17,499 | 0 (0.0%) | 15 (35.7%) |
| $17,500 to $19,999 | 0 (0.0%) | 0 (0.0%) |
| $20,000 to $22,499 | 0 (0.0%) | 0 (0.0%) |
| $22,500 to $24,999 | 0 (0.0%) | 0 (0.0%) |
| $25,000 to $29,999 | 16 (14.4%) | 0 (0.0%) |
| $30,000 to $34,999 | 12 (10.8%) | 0 (0.0%) |
| $35,000 to $39,999 | 0 (0.0%) | 0 (0.0%) |
| $40,000 to $44,999 | 12 (10.8%) | 11 (26.2%) |
| $45,000 to $49,999 | 12 (10.8%) | 0 (0.0%) |
| $50,000 to $54,999 | 33 (29.7%) | 0 (0.0%) |
| $55,000 to $64,999 | 0 (0.0%) | 0 (0.0%) |
| $65,000 to $74,999 | 0 (0.0%) | 0 (0.0%) |
| $75,000 to $99,999 | 0 (0.0%) | 0 (0.0%) |
| $100,000+ | 0 (0.0%) | 0 (0.0%) |
| Total | 111 (100.0%) | 42 (100.0%) |
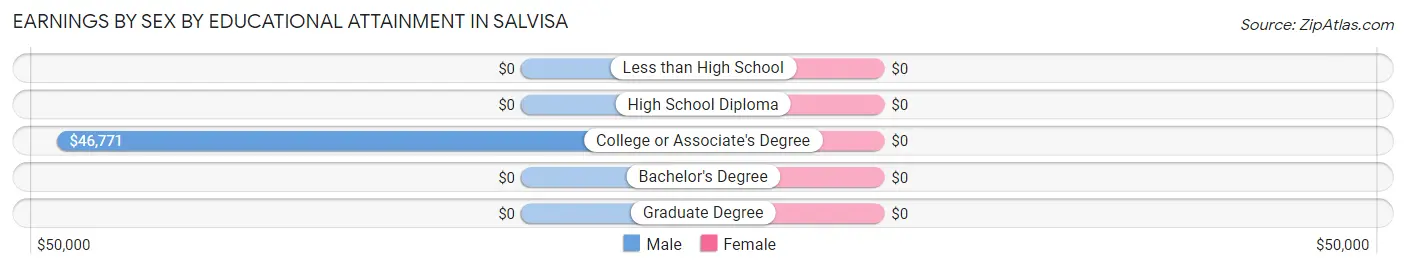
Earnings by Sex by Educational Attainment in Salvisa
| Educational Attainment | Male Income | Female Income |
| Less than High School | - | - |
| High School Diploma | - | - |
| College or Associate's Degree | $46,771 | $0 |
| Bachelor's Degree | - | - |
| Graduate Degree | - | - |
| Total | $41,875 | $0 |
Family Income in Salvisa
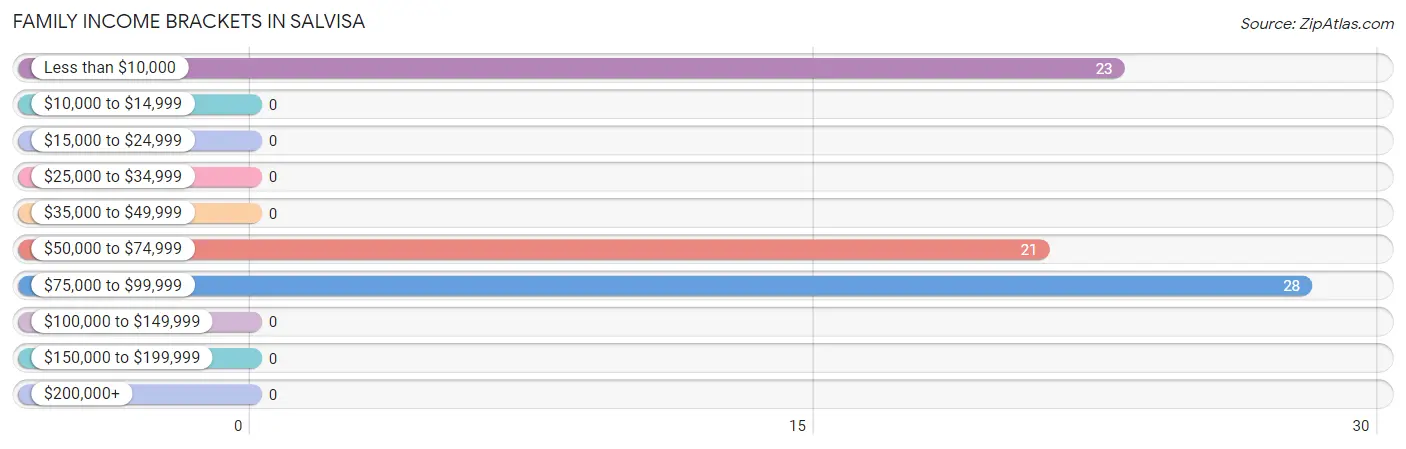
Family Income Brackets in Salvisa
According to the Salvisa family income data, there are 28 families falling into the $75,000 to $99,999 income range, which is the most common income bracket and makes up 38.9% of all families.
| Income Bracket | # Families | % Families |
| Less than $10,000 | 23 | 31.9% |
| $10,000 to $14,999 | 0 | 0.0% |
| $15,000 to $24,999 | 0 | 0.0% |
| $25,000 to $34,999 | 0 | 0.0% |
| $35,000 to $49,999 | 0 | 0.0% |
| $50,000 to $74,999 | 21 | 29.2% |
| $75,000 to $99,999 | 28 | 38.9% |
| $100,000 to $149,999 | 0 | 0.0% |
| $150,000 to $199,999 | 0 | 0.0% |
| $200,000+ | 0 | 0.0% |
Family Income by Famaliy Size in Salvisa
| Income Bracket | # Families | Median Income |
| 2-Person Families | 0 (0.0%) | $0 |
| 3-Person Families | 41 (56.9%) | $0 |
| 4-Person Families | 15 (20.8%) | $0 |
| 5-Person Families | 16 (22.2%) | $0 |
| 6-Person Families | 0 (0.0%) | $0 |
| 7+ Person Families | 0 (0.0%) | $0 |
| Total | 72 (100.0%) | $67,167 |
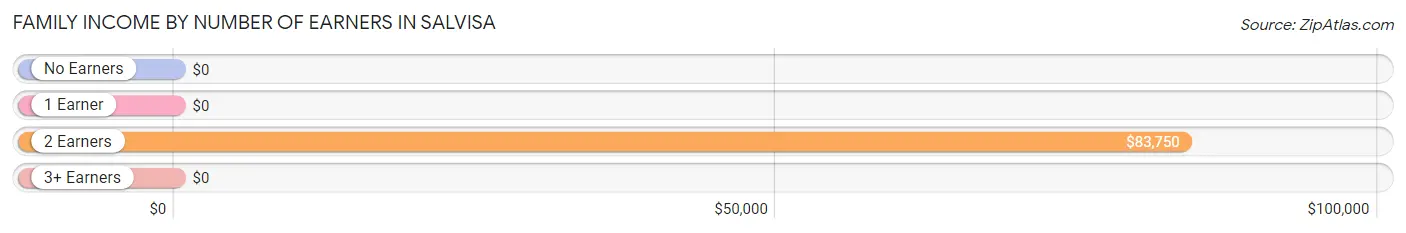
Family Income by Number of Earners in Salvisa
| Number of Earners | # Families | Median Income |
| No Earners | 0 (0.0%) | $0 |
| 1 Earner | 16 (22.2%) | $0 |
| 2 Earners | 56 (77.8%) | $83,750 |
| 3+ Earners | 0 (0.0%) | $0 |
| Total | 72 (100.0%) | $67,167 |
Household Income in Salvisa
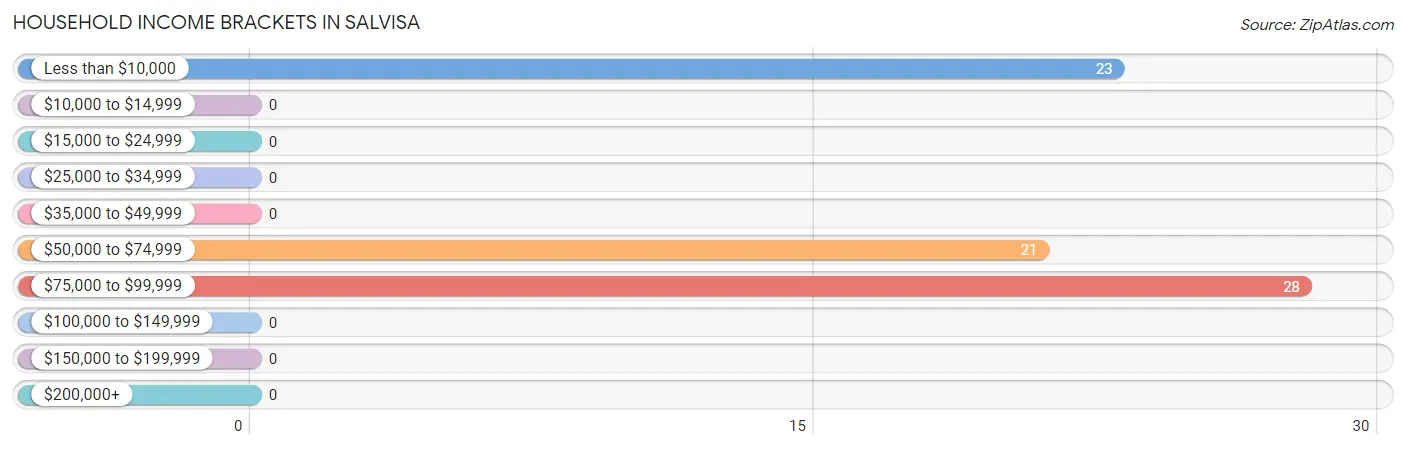
Household Income Brackets in Salvisa
With 28 households falling in the category, the $75,000 to $99,999 income range is the most frequent in Salvisa, accounting for 38.9% of all households.
| Income Bracket | # Households | % Households |
| Less than $10,000 | 23 | 31.9% |
| $10,000 to $14,999 | 0 | 0.0% |
| $15,000 to $24,999 | 0 | 0.0% |
| $25,000 to $34,999 | 0 | 0.0% |
| $35,000 to $49,999 | 0 | 0.0% |
| $50,000 to $74,999 | 21 | 29.2% |
| $75,000 to $99,999 | 28 | 38.9% |
| $100,000 to $149,999 | 0 | 0.0% |
| $150,000 to $199,999 | 0 | 0.0% |
| $200,000+ | 0 | 0.0% |
Household Income by Householder Age in Salvisa
| Income Bracket | # Households | Median Income |
| 15 to 24 Years | 0 (0.0%) | $0 |
| 25 to 44 Years | 47 (65.3%) | $0 |
| 45 to 64 Years | 19 (26.4%) | $0 |
| 65+ Years | 6 (8.3%) | $0 |
| Total | 72 (100.0%) | $67,167 |
Poverty in Salvisa
Income Below Poverty by Sex and Age in Salvisa
With 26.2% poverty level for males and 48.8% for females among the residents of Salvisa, 18 to 24 year old males and 6 to 11 year old females are the most vulnerable to poverty, with 15 males (100.0%) and 19 females (100.0%) in their respective age groups living below the poverty level.
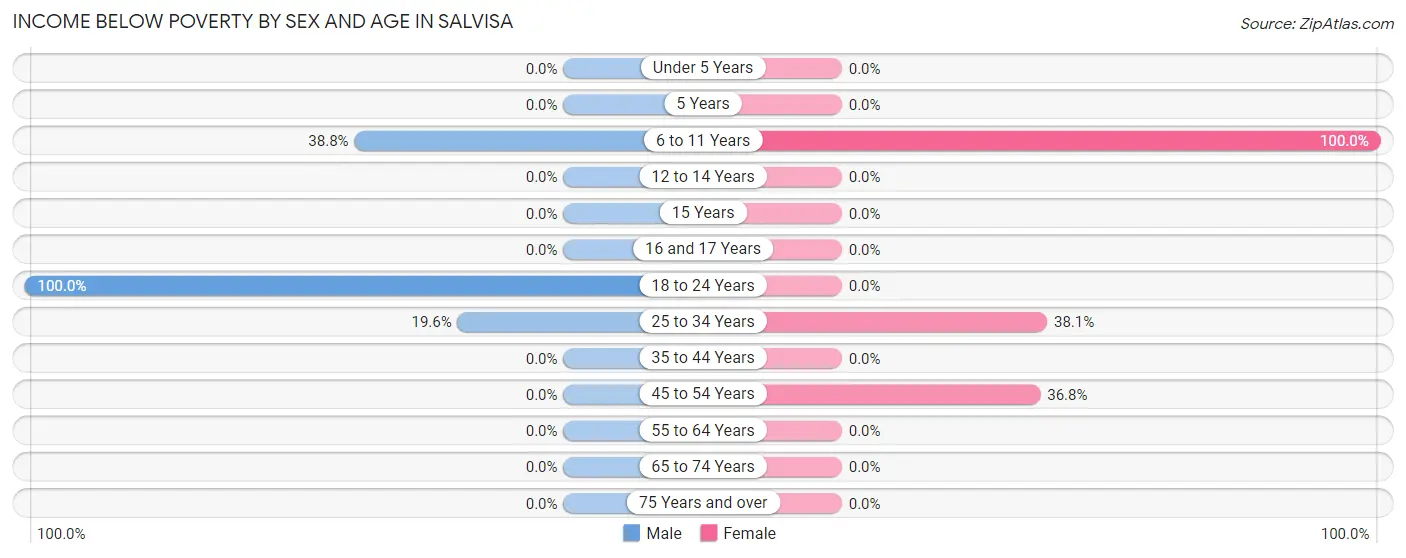
| Age Bracket | Male | Female |
| Under 5 Years | 0 (0.0%) | 0 (0.0%) |
| 5 Years | 0 (0.0%) | 0 (0.0%) |
| 6 to 11 Years | 19 (38.8%) | 19 (100.0%) |
| 12 to 14 Years | 0 (0.0%) | 0 (0.0%) |
| 15 Years | 0 (0.0%) | 0 (0.0%) |
| 16 and 17 Years | 0 (0.0%) | 0 (0.0%) |
| 18 to 24 Years | 15 (100.0%) | 0 (0.0%) |
| 25 to 34 Years | 11 (19.6%) | 16 (38.1%) |
| 35 to 44 Years | 0 (0.0%) | 0 (0.0%) |
| 45 to 54 Years | 0 (0.0%) | 7 (36.8%) |
| 55 to 64 Years | 0 (0.0%) | 0 (0.0%) |
| 65 to 74 Years | 0 (0.0%) | 0 (0.0%) |
| 75 Years and over | 0 (0.0%) | 0 (0.0%) |
| Total | 45 (26.2%) | 42 (48.8%) |
Income Above Poverty by Sex and Age in Salvisa
According to the poverty statistics in Salvisa, males aged under 5 years and females aged 65 to 74 years are the age groups that are most secure financially, with 100.0% of males and 100.0% of females in these age groups living above the poverty line.
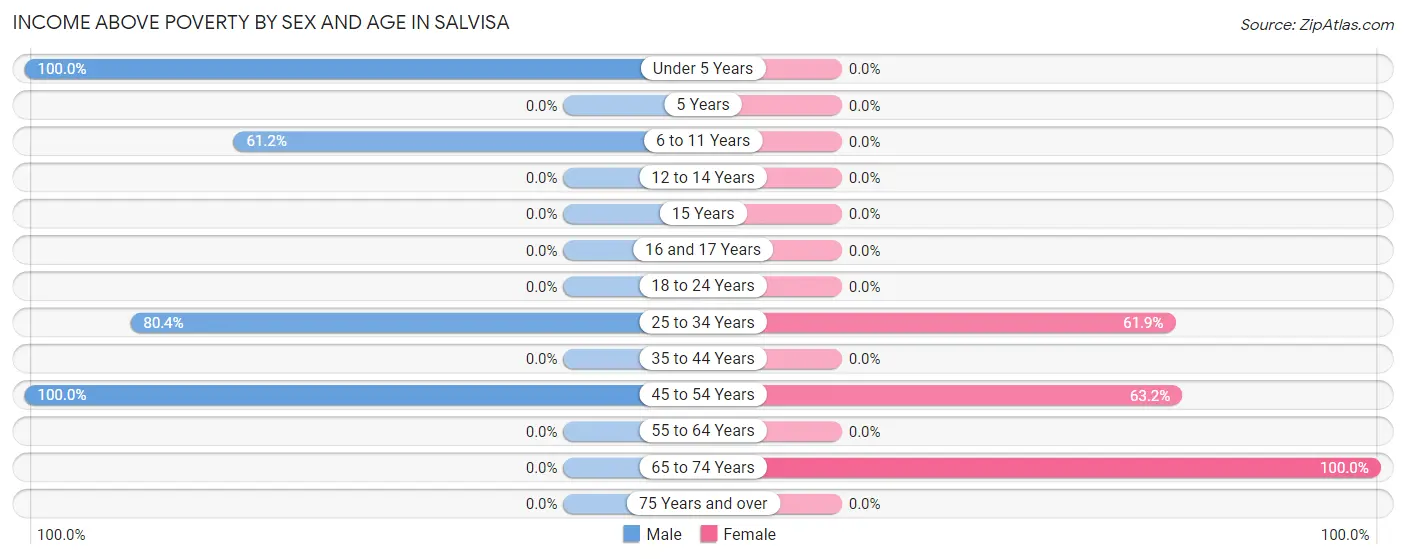
| Age Bracket | Male | Female |
| Under 5 Years | 12 (100.0%) | 0 (0.0%) |
| 5 Years | 0 (0.0%) | 0 (0.0%) |
| 6 to 11 Years | 30 (61.2%) | 0 (0.0%) |
| 12 to 14 Years | 0 (0.0%) | 0 (0.0%) |
| 15 Years | 0 (0.0%) | 0 (0.0%) |
| 16 and 17 Years | 0 (0.0%) | 0 (0.0%) |
| 18 to 24 Years | 0 (0.0%) | 0 (0.0%) |
| 25 to 34 Years | 45 (80.4%) | 26 (61.9%) |
| 35 to 44 Years | 0 (0.0%) | 0 (0.0%) |
| 45 to 54 Years | 40 (100.0%) | 12 (63.2%) |
| 55 to 64 Years | 0 (0.0%) | 0 (0.0%) |
| 65 to 74 Years | 0 (0.0%) | 6 (100.0%) |
| 75 Years and over | 0 (0.0%) | 0 (0.0%) |
| Total | 127 (73.8%) | 44 (51.2%) |
Income Below Poverty Among Married-Couple Families in Salvisa
| Children | Above Poverty | Below Poverty |
| No Children | 12 (100.0%) | 0 (0.0%) |
| 1 or 2 Children | 15 (100.0%) | 0 (0.0%) |
| 3 or 4 Children | 16 (100.0%) | 0 (0.0%) |
| 5 or more Children | 0 (0.0%) | 0 (0.0%) |
| Total | 43 (100.0%) | 0 (0.0%) |
Income Below Poverty Among Single-Parent Households in Salvisa
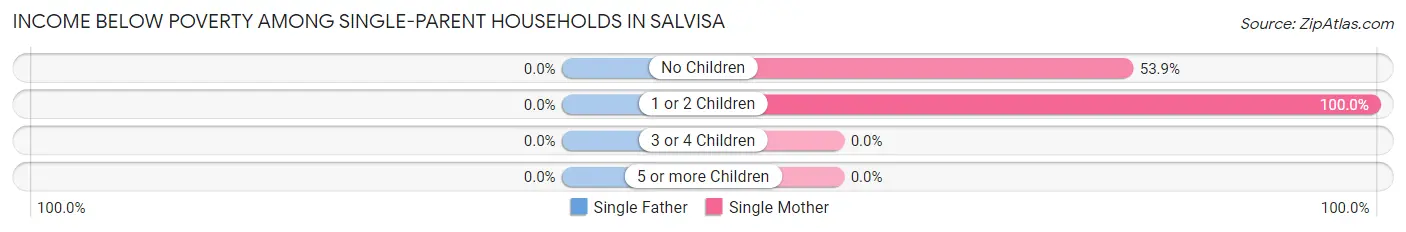
| Children | Single Father | Single Mother |
| No Children | 0 (0.0%) | 7 (53.8%) |
| 1 or 2 Children | 0 (0.0%) | 16 (100.0%) |
| 3 or 4 Children | 0 (0.0%) | 0 (0.0%) |
| 5 or more Children | 0 (0.0%) | 0 (0.0%) |
| Total | 0 (0.0%) | 23 (79.3%) |
Income Below Poverty Among Married-Couple vs Single-Parent Households in Salvisa
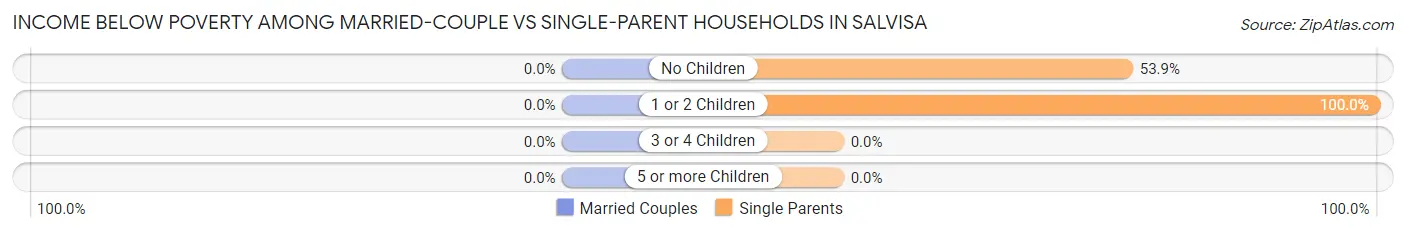
| Children | Married-Couple Families | Single-Parent Households |
| No Children | 0 (0.0%) | 7 (53.8%) |
| 1 or 2 Children | 0 (0.0%) | 16 (100.0%) |
| 3 or 4 Children | 0 (0.0%) | 0 (0.0%) |
| 5 or more Children | 0 (0.0%) | 0 (0.0%) |
| Total | 0 (0.0%) | 23 (79.3%) |
Race in Salvisa
The most populous races in Salvisa are , and White / Caucasian (258 | 100.0%).
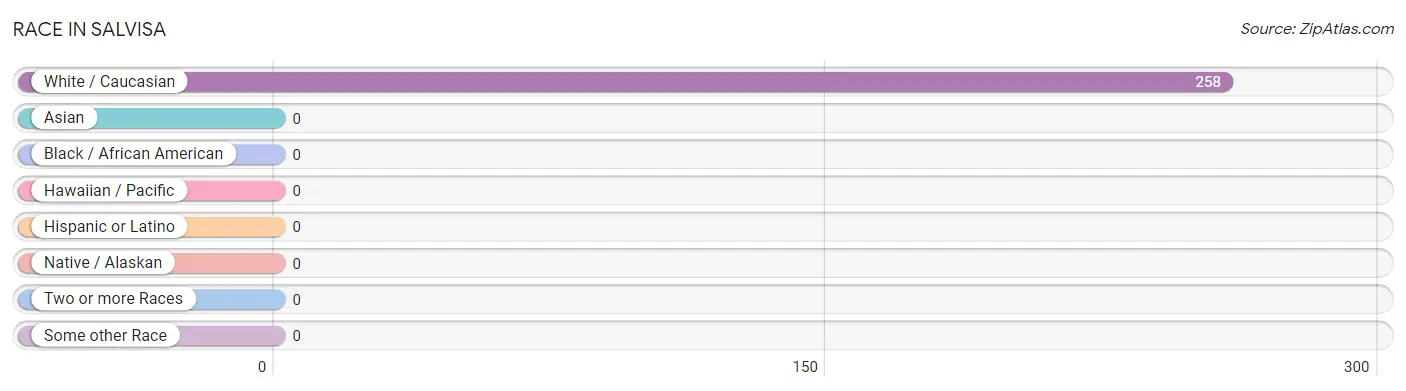
| Race | # Population | % Population |
| Asian | 0 | 0.0% |
| Black / African American | 0 | 0.0% |
| Hawaiian / Pacific | 0 | 0.0% |
| Hispanic or Latino | 0 | 0.0% |
| Native / Alaskan | 0 | 0.0% |
| White / Caucasian | 258 | 100.0% |
| Two or more Races | 0 | 0.0% |
| Some other Race | 0 | 0.0% |
| Total | 258 | 100.0% |
Ancestry in Salvisa
The most populous ancestries reported in Salvisa are English (114 | 44.2%), and Irish (15 | 5.8%), together accounting for 50.0% of all Salvisa residents.
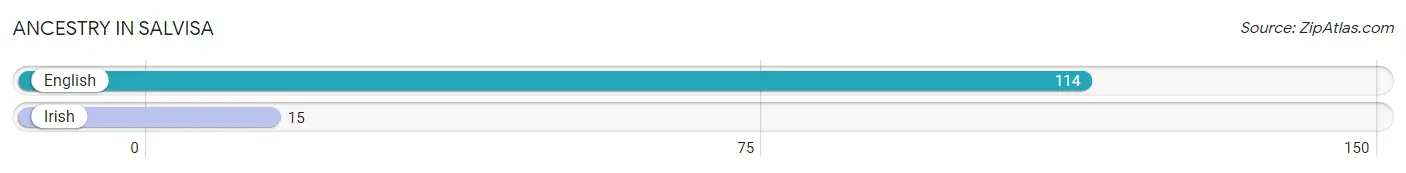
| Ancestry | # Population | % Population |
| English | 114 | 44.2% |
| Irish | 15 | 5.8% | View All 2 Rows |
Immigrants in Salvisa

| Immigration Origin | # Population | % Population | View All 0 Rows |
Sex and Age in Salvisa
Sex and Age in Salvisa
The most populous age groups in Salvisa are 5 to 9 Years (39 | 22.7%) for men and 30 to 34 Years (26 | 30.2%) for women.
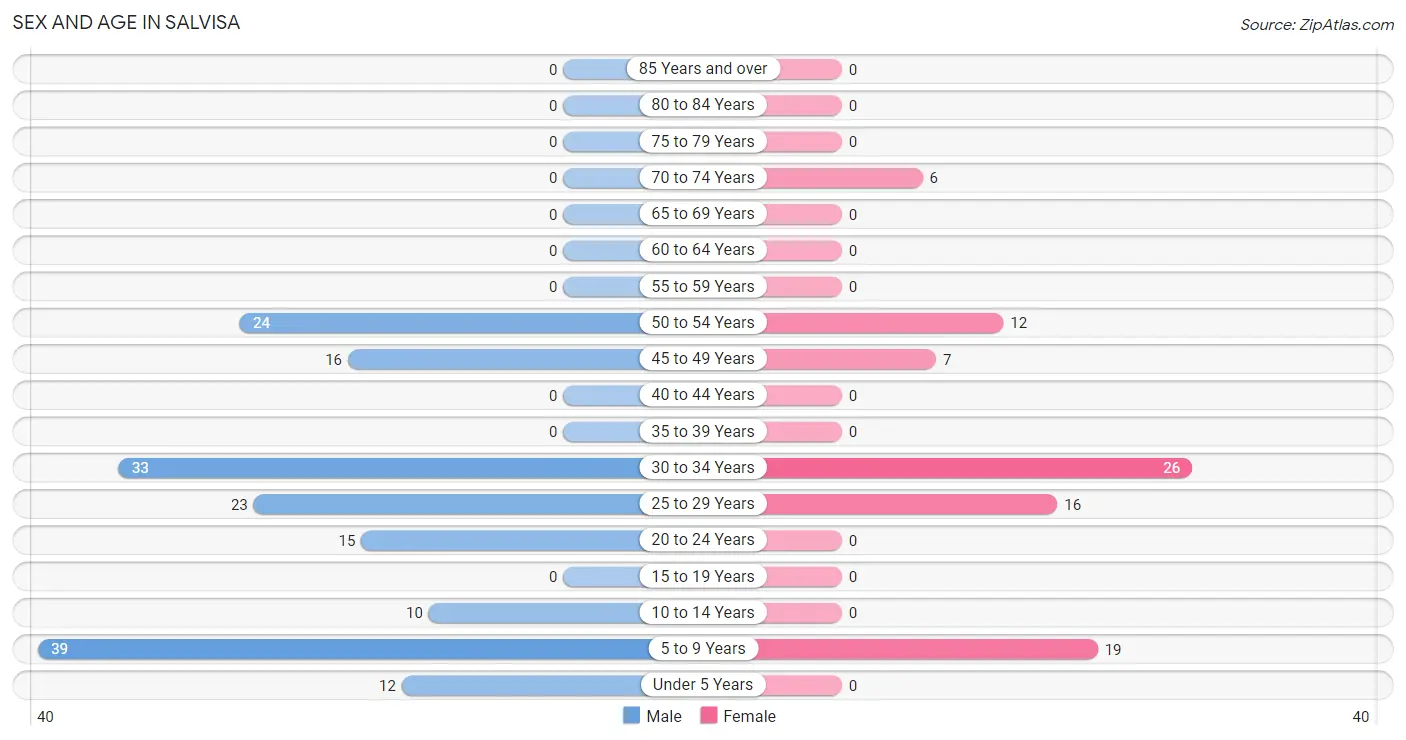
| Age Bracket | Male | Female |
| Under 5 Years | 12 (7.0%) | 0 (0.0%) |
| 5 to 9 Years | 39 (22.7%) | 19 (22.1%) |
| 10 to 14 Years | 10 (5.8%) | 0 (0.0%) |
| 15 to 19 Years | 0 (0.0%) | 0 (0.0%) |
| 20 to 24 Years | 15 (8.7%) | 0 (0.0%) |
| 25 to 29 Years | 23 (13.4%) | 16 (18.6%) |
| 30 to 34 Years | 33 (19.2%) | 26 (30.2%) |
| 35 to 39 Years | 0 (0.0%) | 0 (0.0%) |
| 40 to 44 Years | 0 (0.0%) | 0 (0.0%) |
| 45 to 49 Years | 16 (9.3%) | 7 (8.1%) |
| 50 to 54 Years | 24 (14.0%) | 12 (14.0%) |
| 55 to 59 Years | 0 (0.0%) | 0 (0.0%) |
| 60 to 64 Years | 0 (0.0%) | 0 (0.0%) |
| 65 to 69 Years | 0 (0.0%) | 0 (0.0%) |
| 70 to 74 Years | 0 (0.0%) | 6 (7.0%) |
| 75 to 79 Years | 0 (0.0%) | 0 (0.0%) |
| 80 to 84 Years | 0 (0.0%) | 0 (0.0%) |
| 85 Years and over | 0 (0.0%) | 0 (0.0%) |
| Total | 172 (100.0%) | 86 (100.0%) |
Families and Households in Salvisa
Median Family Size in Salvisa
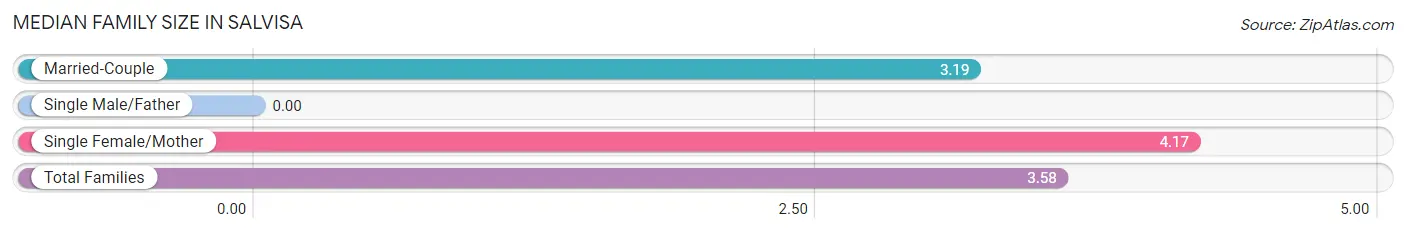
| Family Type | # Families | Family Size |
| Married-Couple | 43 (59.7%) | 3.19 |
| Single Male/Father | 0 (0.0%) | - |
| Single Female/Mother | 29 (40.3%) | 4.17 |
| Total Families | 72 (100.0%) | 3.58 |
Median Household Size in Salvisa
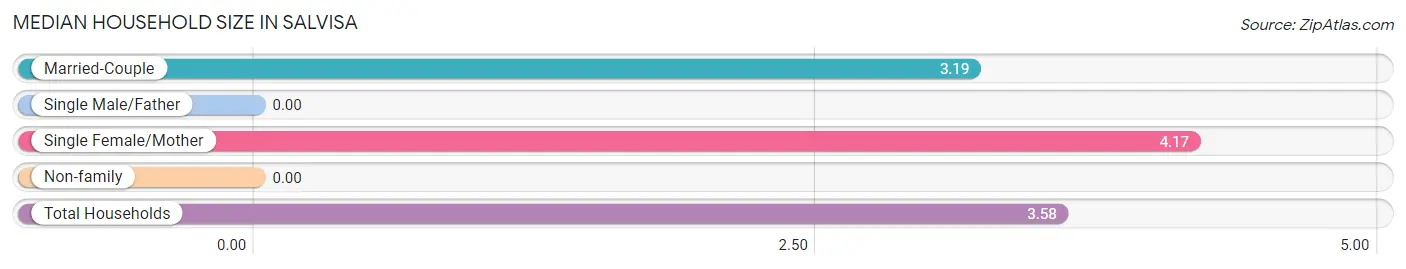
| Household Type | # Households | Household Size |
| Married-Couple | 43 (59.7%) | 3.19 |
| Single Male/Father | 0 (0.0%) | - |
| Single Female/Mother | 29 (40.3%) | 4.17 |
| Non-family | 0 (0.0%) | - |
| Total Households | 72 (100.0%) | 3.58 |
Household Size by Marriage Status in Salvisa
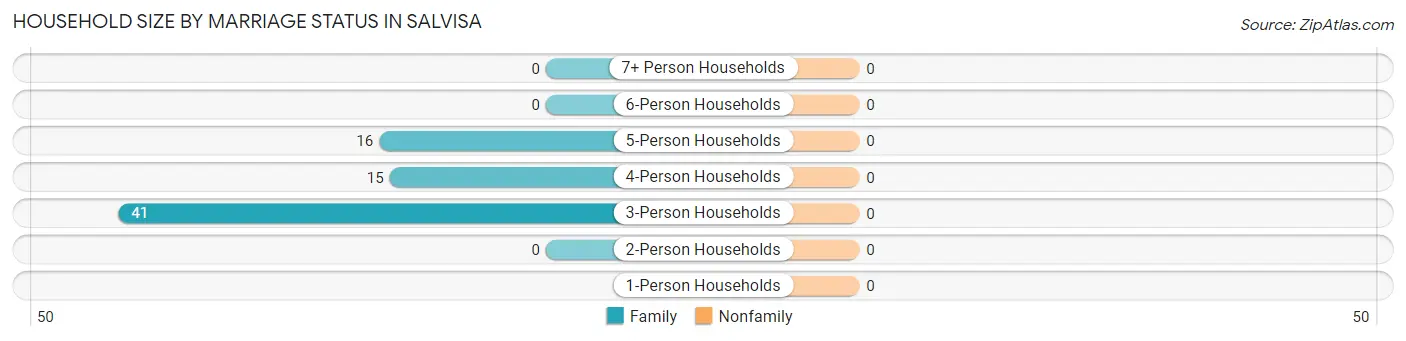
| Household Size | Family Households | Nonfamily Households |
| 1-Person Households | - | 0 (0.0%) |
| 2-Person Households | 0 (0.0%) | 0 (0.0%) |
| 3-Person Households | 41 (56.9%) | 0 (0.0%) |
| 4-Person Households | 15 (20.8%) | 0 (0.0%) |
| 5-Person Households | 16 (22.2%) | 0 (0.0%) |
| 6-Person Households | 0 (0.0%) | 0 (0.0%) |
| 7+ Person Households | 0 (0.0%) | 0 (0.0%) |
| Total | 72 (100.0%) | 0 (0.0%) |
Female Fertility in Salvisa
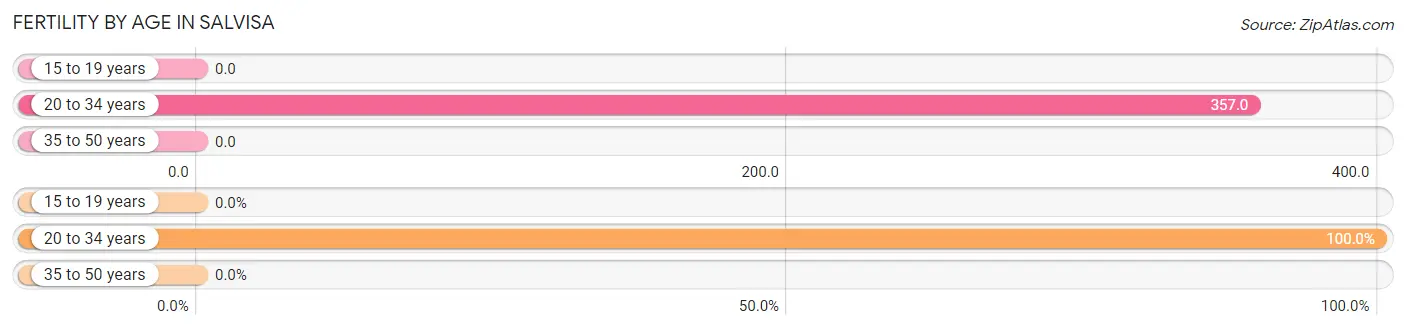
Fertility by Age in Salvisa
Average fertility rate in Salvisa is 306.0 births per 1,000 women. Women in the age bracket of 20 to 34 years have the highest fertility rate with 357.0 births per 1,000 women. Women in the age bracket of 20 to 34 years acount for 100.0% of all women with births.
| Age Bracket | Women with Births | Births / 1,000 Women |
| 15 to 19 years | 0 (0.0%) | 0.0 |
| 20 to 34 years | 15 (100.0%) | 357.0 |
| 35 to 50 years | 0 (0.0%) | 0.0 |
| Total | 15 (100.0%) | 306.0 |
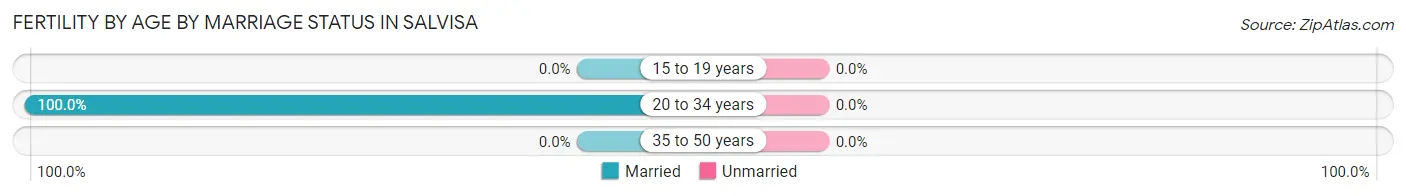
Fertility by Age by Marriage Status in Salvisa
| Age Bracket | Married | Unmarried |
| 15 to 19 years | 0 (0.0%) | 0 (0.0%) |
| 20 to 34 years | 15 (100.0%) | 0 (0.0%) |
| 35 to 50 years | 0 (0.0%) | 0 (0.0%) |
| Total | 15 (100.0%) | 0 (0.0%) |
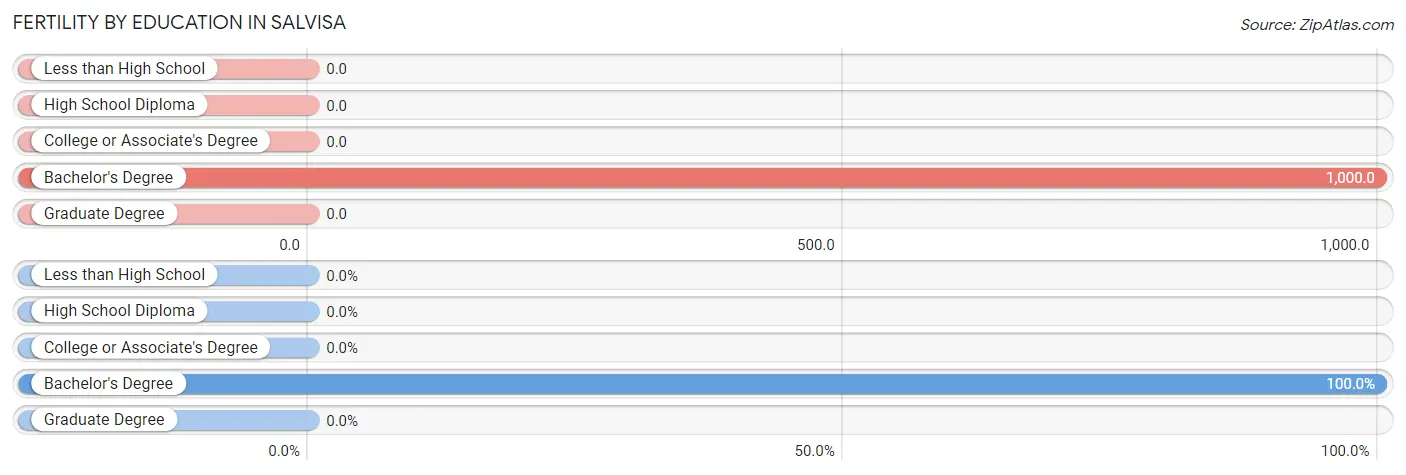
Fertility by Education in Salvisa
| Educational Attainment | Women with Births | Births / 1,000 Women |
| Less than High School | 0 (0.0%) | 0.0 |
| High School Diploma | 0 (0.0%) | 0.0 |
| College or Associate's Degree | 0 (0.0%) | 0.0 |
| Bachelor's Degree | 15 (100.0%) | 1,000.0 |
| Graduate Degree | 0 (0.0%) | 0.0 |
| Total | 15 (100.0%) | 306.0 |
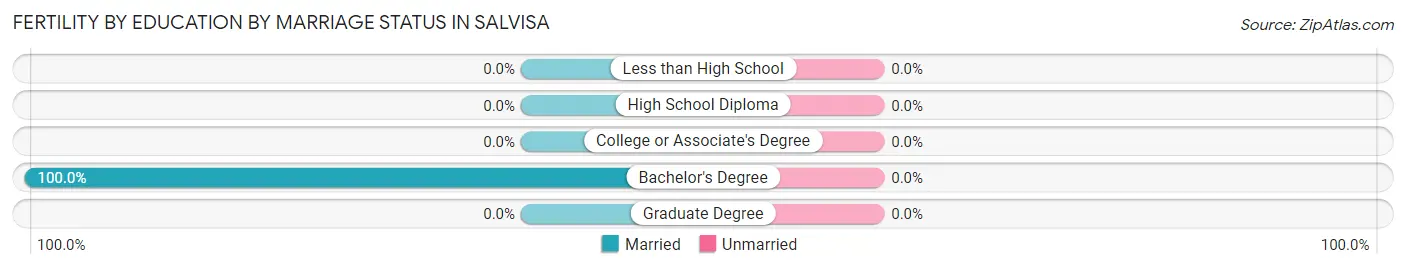
Fertility by Education by Marriage Status in Salvisa
| Educational Attainment | Married | Unmarried |
| Less than High School | 0 (0.0%) | 0 (0.0%) |
| High School Diploma | 0 (0.0%) | 0 (0.0%) |
| College or Associate's Degree | 0 (0.0%) | 0 (0.0%) |
| Bachelor's Degree | 15 (100.0%) | 0 (0.0%) |
| Graduate Degree | 0 (0.0%) | 0 (0.0%) |
| Total | 15 (100.0%) | 0 (0.0%) |
Employment Characteristics in Salvisa
Employment by Class of Employer in Salvisa
Among the 95 employed individuals in Salvisa, , and private company employees (95 | 100.0%) make up the most common classes of employment.
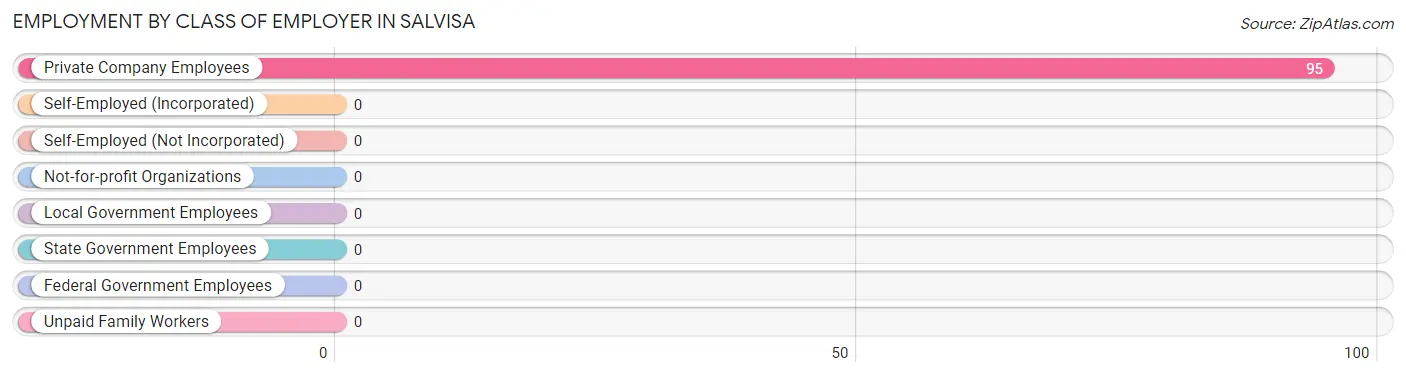
| Employer Class | # Employees | % Employees |
| Private Company Employees | 95 | 100.0% |
| Self-Employed (Incorporated) | 0 | 0.0% |
| Self-Employed (Not Incorporated) | 0 | 0.0% |
| Not-for-profit Organizations | 0 | 0.0% |
| Local Government Employees | 0 | 0.0% |
| State Government Employees | 0 | 0.0% |
| Federal Government Employees | 0 | 0.0% |
| Unpaid Family Workers | 0 | 0.0% |
| Total | 95 | 100.0% |
Employment Status by Age in Salvisa
According to the labor force statistics for Salvisa, out of the total population over 16 years of age (178), 74.7% or 133 individuals are in the labor force, with 20.3% or 27 of them unemployed. The age group with the highest labor force participation rate is 20 to 24 years, with 100.0% or 15 individuals in the labor force. Within the labor force, the 20 to 24 years age range has the highest percentage of unemployed individuals, with 100.0% or 15 of them being unemployed.
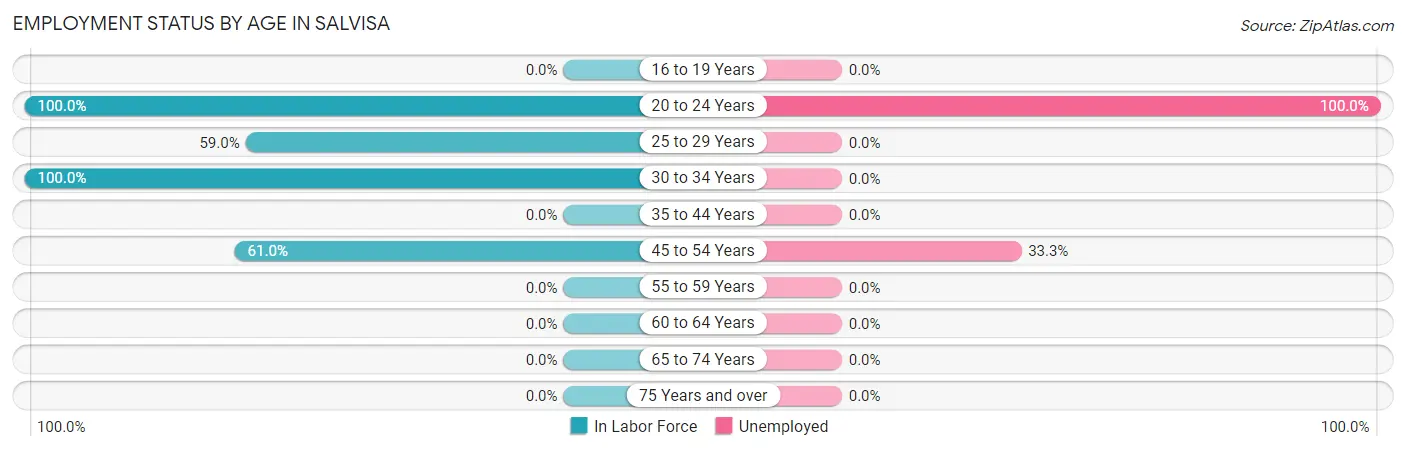
| Age Bracket | In Labor Force | Unemployed |
| 16 to 19 Years | 0 (0.0%) | 0 (0.0%) |
| 20 to 24 Years | 15 (100.0%) | 15 (100.0%) |
| 25 to 29 Years | 23 (59.0%) | 0 (0.0%) |
| 30 to 34 Years | 59 (100.0%) | 0 (0.0%) |
| 35 to 44 Years | 0 (0.0%) | 0 (0.0%) |
| 45 to 54 Years | 36 (61.0%) | 12 (33.3%) |
| 55 to 59 Years | 0 (0.0%) | 0 (0.0%) |
| 60 to 64 Years | 0 (0.0%) | 0 (0.0%) |
| 65 to 74 Years | 0 (0.0%) | 0 (0.0%) |
| 75 Years and over | 0 (0.0%) | 0 (0.0%) |
| Total | 133 (74.7%) | 27 (20.3%) |
Employment Status by Educational Attainment in Salvisa
According to labor force statistics for Salvisa, 75.2% of individuals (118) out of the total population between 25 and 64 years of age (157) are in the labor force, with 10.2% or 12 of them being unemployed. The group with the highest labor force participation rate are those with the educational attainment of college / associate degree, with 100.0% or 52 individuals in the labor force. Within the labor force, individuals with bachelor's degree or higher education have the highest percentage of unemployment, with 30.8% or 12 of them being unemployed.
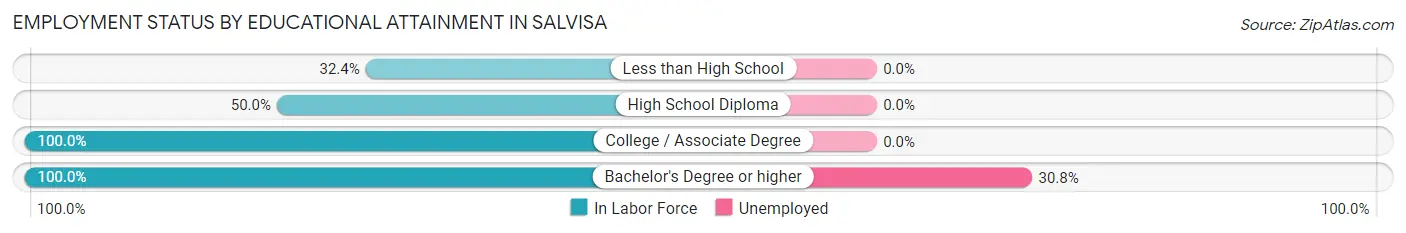
| Educational Attainment | In Labor Force | Unemployed |
| Less than High School | 11 (32.4%) | 0 (0.0%) |
| High School Diploma | 16 (50.0%) | 0 (0.0%) |
| College / Associate Degree | 52 (100.0%) | 0 (0.0%) |
| Bachelor's Degree or higher | 39 (100.0%) | 12 (30.8%) |
| Total | 118 (75.2%) | 16 (10.2%) |
Employment Occupations by Sex in Salvisa
Management, Business, Science and Arts Occupations
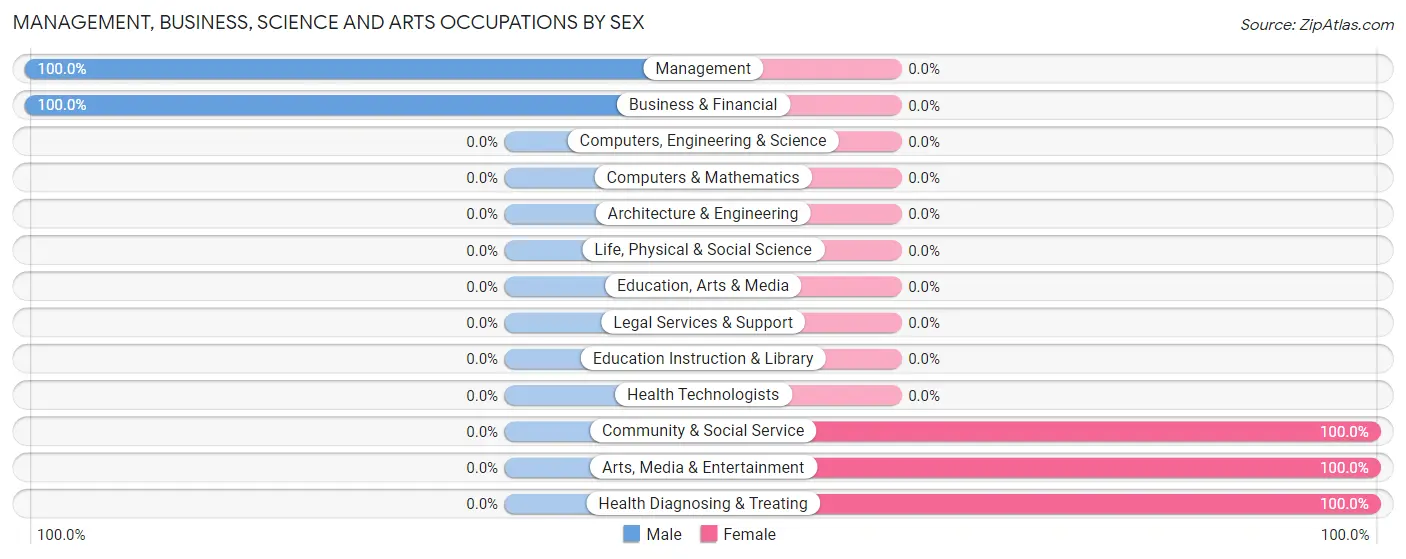
The most common Management, Business, Science and Arts occupations in Salvisa are Community & Social Service (15 | 14.1%), Arts, Media & Entertainment (15 | 14.1%), Business & Financial (12 | 11.3%), Management (11 | 10.4%), and Health Diagnosing & Treating (11 | 10.4%).
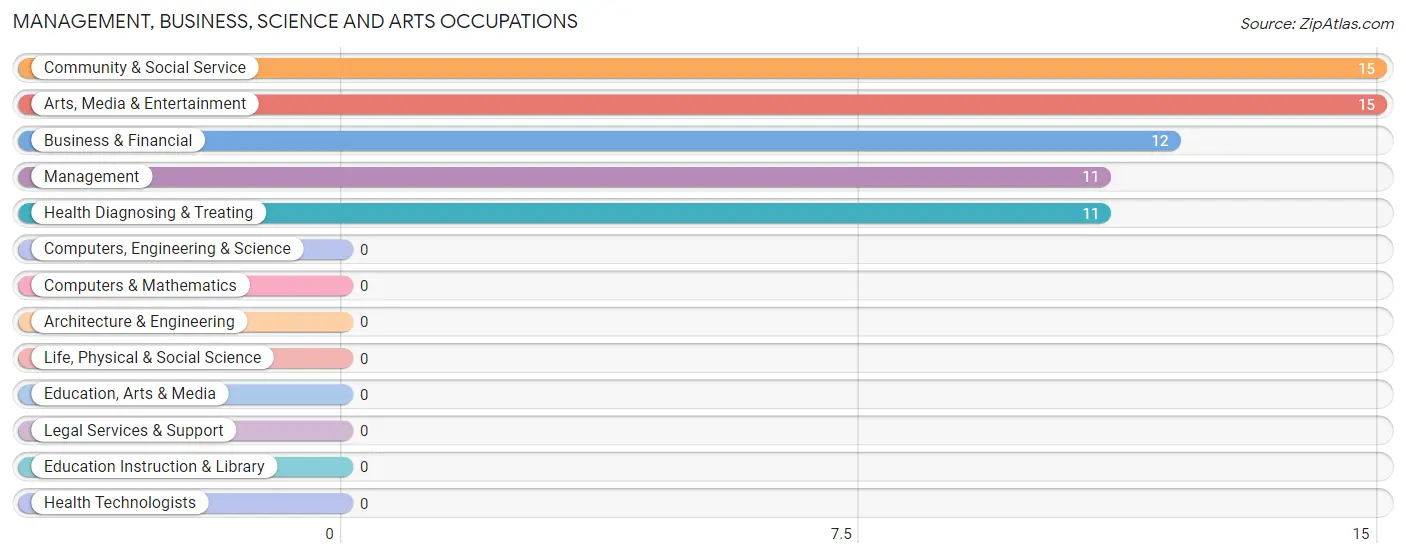
Management, Business, Science and Arts Occupations by Sex
Within the Management, Business, Science and Arts occupations in Salvisa, the most male-oriented occupations are Management (100.0%), and Business & Financial (100.0%), while the most female-oriented occupations are Community & Social Service (100.0%), Arts, Media & Entertainment (100.0%), and Health Diagnosing & Treating (100.0%).
| Occupation | Male | Female |
| Management | 11 (100.0%) | 0 (0.0%) |
| Business & Financial | 12 (100.0%) | 0 (0.0%) |
| Computers, Engineering & Science | 0 (0.0%) | 0 (0.0%) |
| Computers & Mathematics | 0 (0.0%) | 0 (0.0%) |
| Architecture & Engineering | 0 (0.0%) | 0 (0.0%) |
| Life, Physical & Social Science | 0 (0.0%) | 0 (0.0%) |
| Community & Social Service | 0 (0.0%) | 15 (100.0%) |
| Education, Arts & Media | 0 (0.0%) | 0 (0.0%) |
| Legal Services & Support | 0 (0.0%) | 0 (0.0%) |
| Education Instruction & Library | 0 (0.0%) | 0 (0.0%) |
| Arts, Media & Entertainment | 0 (0.0%) | 15 (100.0%) |
| Health Diagnosing & Treating | 0 (0.0%) | 11 (100.0%) |
| Health Technologists | 0 (0.0%) | 0 (0.0%) |
| Total (Category) | 23 (46.9%) | 26 (53.1%) |
| Total (Overall) | 80 (75.5%) | 26 (24.5%) |
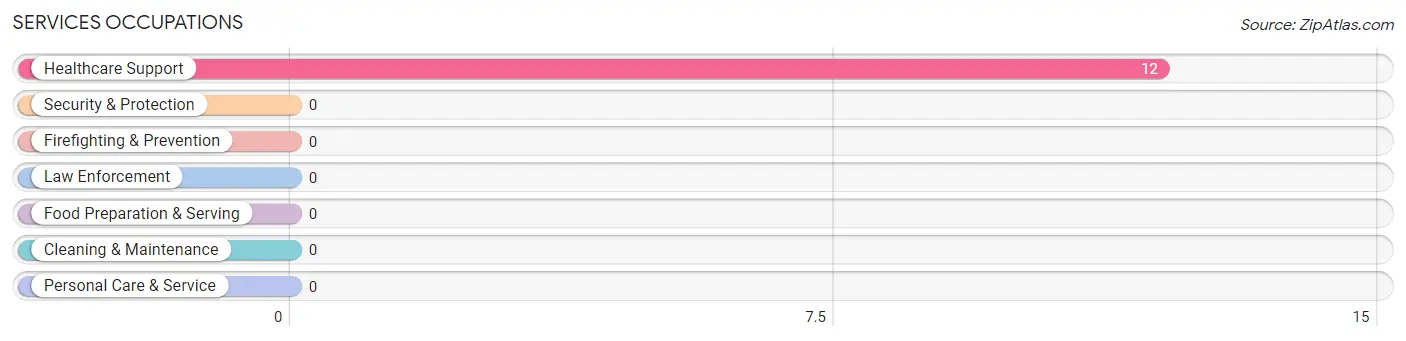
Services Occupations
The most common Services occupations in Salvisa are , and Healthcare Support (12 | 11.3%).
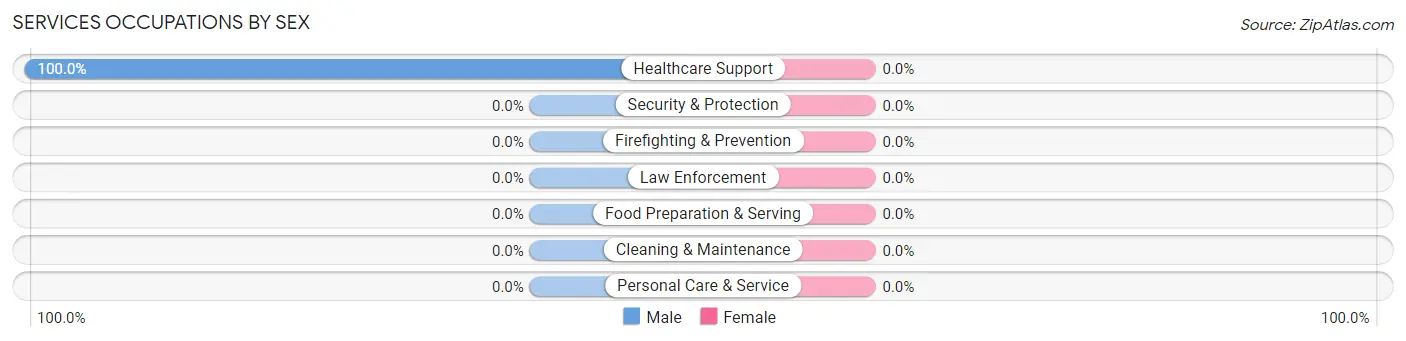
Services Occupations by Sex
| Occupation | Male | Female |
| Healthcare Support | 12 (100.0%) | 0 (0.0%) |
| Security & Protection | 0 (0.0%) | 0 (0.0%) |
| Firefighting & Prevention | 0 (0.0%) | 0 (0.0%) |
| Law Enforcement | 0 (0.0%) | 0 (0.0%) |
| Food Preparation & Serving | 0 (0.0%) | 0 (0.0%) |
| Cleaning & Maintenance | 0 (0.0%) | 0 (0.0%) |
| Personal Care & Service | 0 (0.0%) | 0 (0.0%) |
| Total (Category) | 12 (100.0%) | 0 (0.0%) |
| Total (Overall) | 80 (75.5%) | 26 (24.5%) |
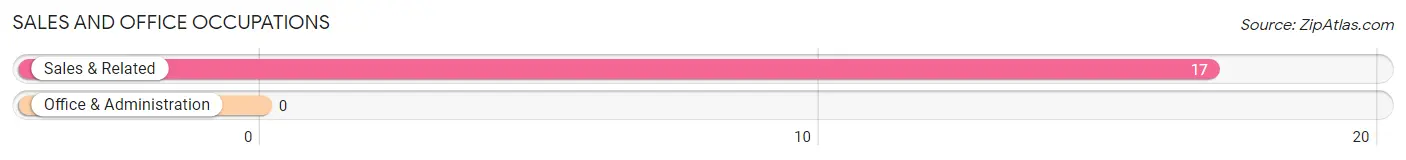
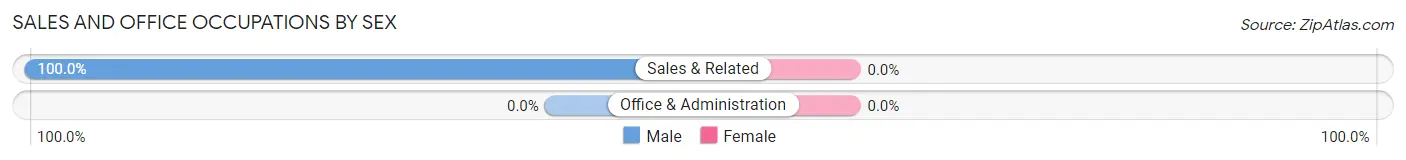
Sales and Office Occupations
The most common Sales and Office occupations in Salvisa are , and Sales & Related (17 | 16.0%).
Sales and Office Occupations by Sex
| Occupation | Male | Female |
| Sales & Related | 17 (100.0%) | 0 (0.0%) |
| Office & Administration | 0 (0.0%) | 0 (0.0%) |
| Total (Category) | 17 (100.0%) | 0 (0.0%) |
| Total (Overall) | 80 (75.5%) | 26 (24.5%) |
Natural Resources, Construction and Maintenance Occupations
Natural Resources, Construction and Maintenance Occupations by Sex
| Occupation | Male | Female |
| Farming, Fishing & Forestry | 0 (0.0%) | 0 (0.0%) |
| Construction & Extraction | 0 (0.0%) | 0 (0.0%) |
| Installation, Maintenance & Repair | 0 (0.0%) | 0 (0.0%) |
| Total (Category) | 0 (0.0%) | 0 (0.0%) |
| Total (Overall) | 80 (75.5%) | 26 (24.5%) |
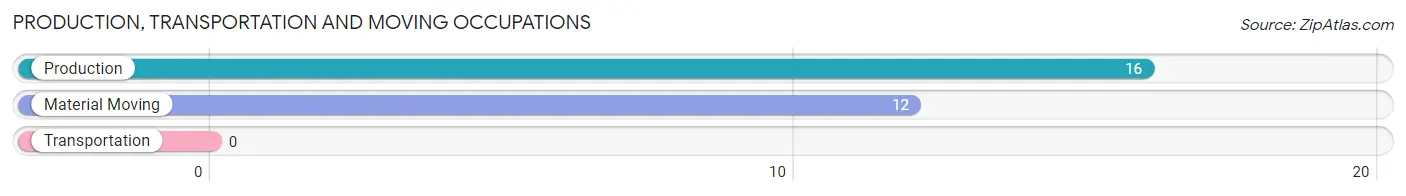
Production, Transportation and Moving Occupations
The most common Production, Transportation and Moving occupations in Salvisa are Production (16 | 15.1%), and Material Moving (12 | 11.3%).
Production, Transportation and Moving Occupations by Sex
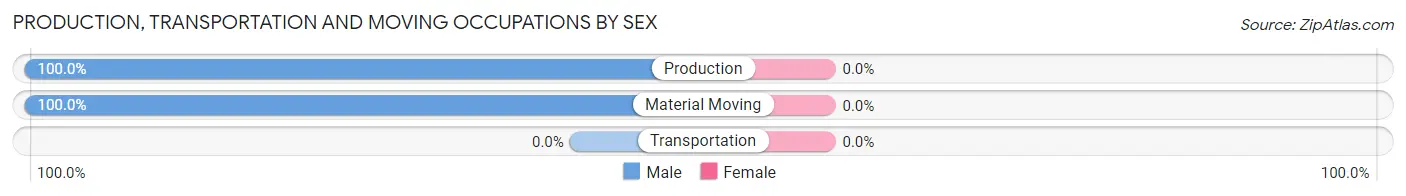
| Occupation | Male | Female |
| Production | 16 (100.0%) | 0 (0.0%) |
| Transportation | 0 (0.0%) | 0 (0.0%) |
| Material Moving | 12 (100.0%) | 0 (0.0%) |
| Total (Category) | 28 (100.0%) | 0 (0.0%) |
| Total (Overall) | 80 (75.5%) | 26 (24.5%) |
Employment Industries by Sex in Salvisa
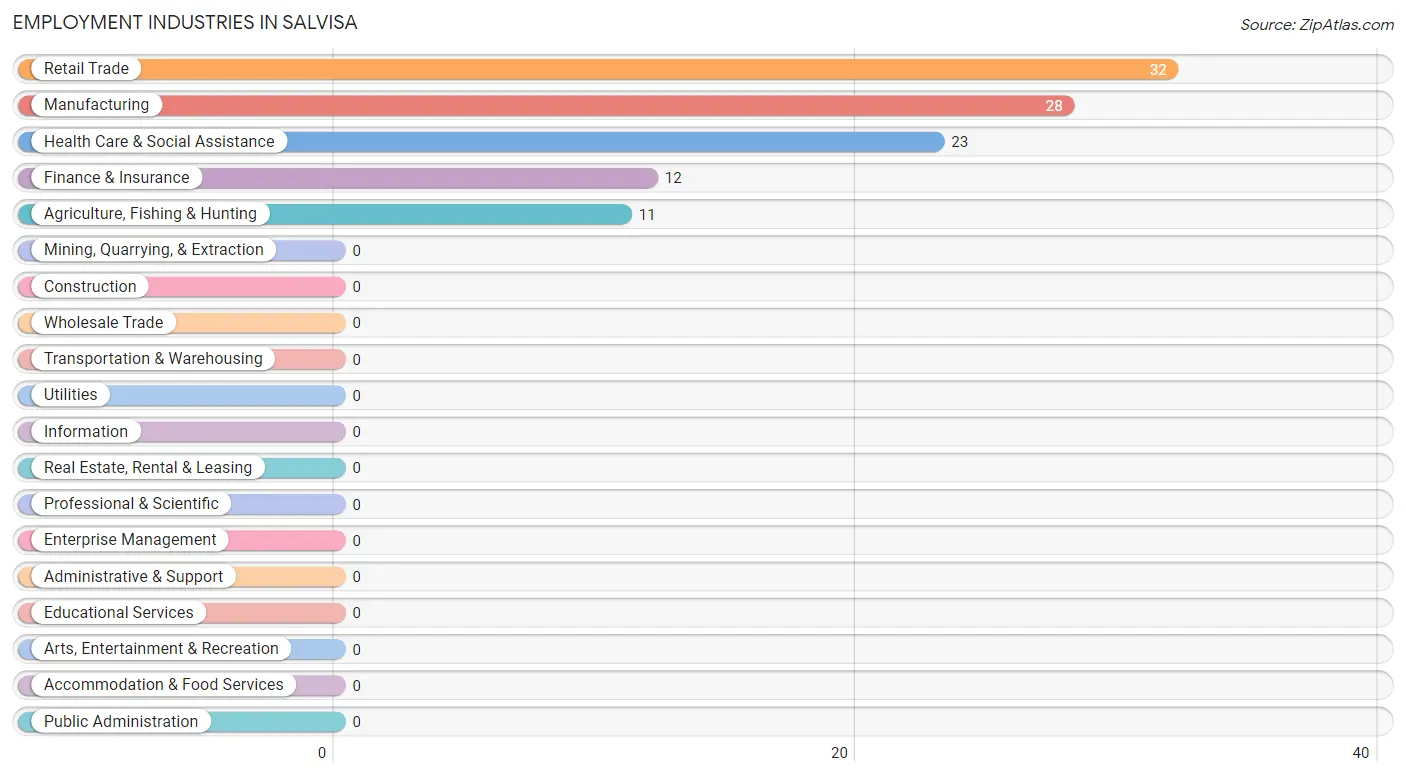
Employment Industries in Salvisa
The major employment industries in Salvisa include Retail Trade (32 | 30.2%), Manufacturing (28 | 26.4%), Health Care & Social Assistance (23 | 21.7%), Finance & Insurance (12 | 11.3%), and Agriculture, Fishing & Hunting (11 | 10.4%).
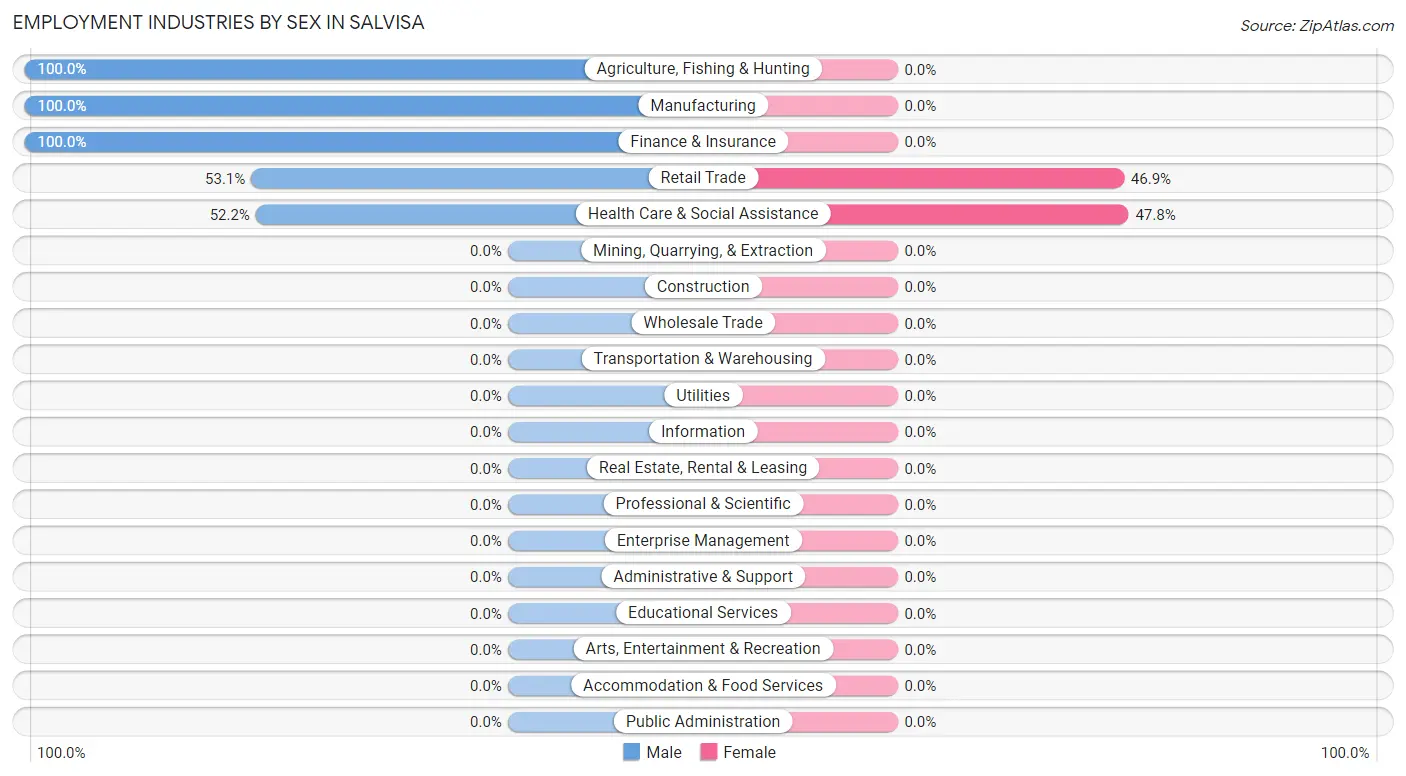
Employment Industries by Sex in Salvisa
The Salvisa industries that see more men than women are Agriculture, Fishing & Hunting (100.0%), Manufacturing (100.0%), and Finance & Insurance (100.0%), whereas the industries that tend to have a higher number of women are Health Care & Social Assistance (47.8%), and Retail Trade (46.9%).
| Industry | Male | Female |
| Agriculture, Fishing & Hunting | 11 (100.0%) | 0 (0.0%) |
| Mining, Quarrying, & Extraction | 0 (0.0%) | 0 (0.0%) |
| Construction | 0 (0.0%) | 0 (0.0%) |
| Manufacturing | 28 (100.0%) | 0 (0.0%) |
| Wholesale Trade | 0 (0.0%) | 0 (0.0%) |
| Retail Trade | 17 (53.1%) | 15 (46.9%) |
| Transportation & Warehousing | 0 (0.0%) | 0 (0.0%) |
| Utilities | 0 (0.0%) | 0 (0.0%) |
| Information | 0 (0.0%) | 0 (0.0%) |
| Finance & Insurance | 12 (100.0%) | 0 (0.0%) |
| Real Estate, Rental & Leasing | 0 (0.0%) | 0 (0.0%) |
| Professional & Scientific | 0 (0.0%) | 0 (0.0%) |
| Enterprise Management | 0 (0.0%) | 0 (0.0%) |
| Administrative & Support | 0 (0.0%) | 0 (0.0%) |
| Educational Services | 0 (0.0%) | 0 (0.0%) |
| Health Care & Social Assistance | 12 (52.2%) | 11 (47.8%) |
| Arts, Entertainment & Recreation | 0 (0.0%) | 0 (0.0%) |
| Accommodation & Food Services | 0 (0.0%) | 0 (0.0%) |
| Public Administration | 0 (0.0%) | 0 (0.0%) |
| Total | 80 (75.5%) | 26 (24.5%) |
Education in Salvisa
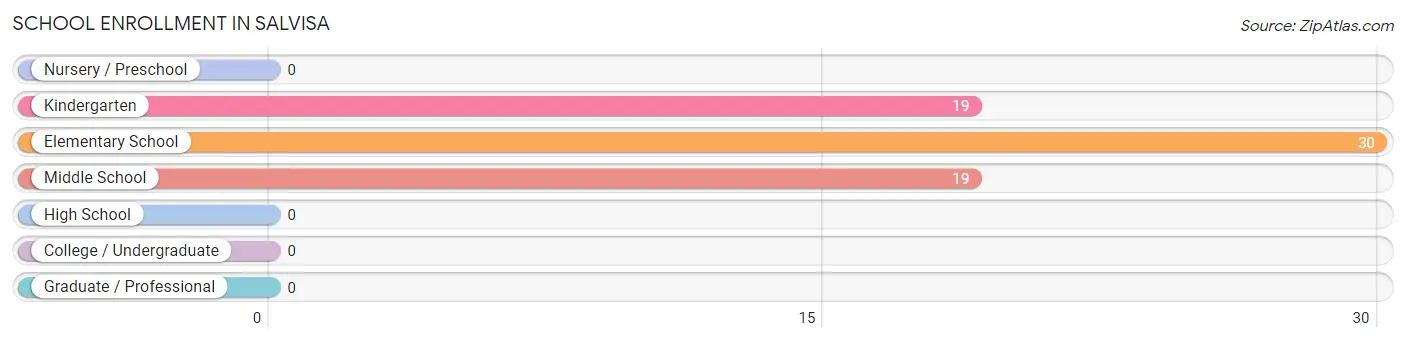
School Enrollment in Salvisa
The most common levels of schooling among the 68 students in Salvisa are elementary school (30 | 44.1%), kindergarten (19 | 27.9%), and middle school (19 | 27.9%).
| School Level | # Students | % Students |
| Nursery / Preschool | 0 | 0.0% |
| Kindergarten | 19 | 27.9% |
| Elementary School | 30 | 44.1% |
| Middle School | 19 | 27.9% |
| High School | 0 | 0.0% |
| College / Undergraduate | 0 | 0.0% |
| Graduate / Professional | 0 | 0.0% |
| Total | 68 | 100.0% |
School Enrollment by Age by Funding Source in Salvisa
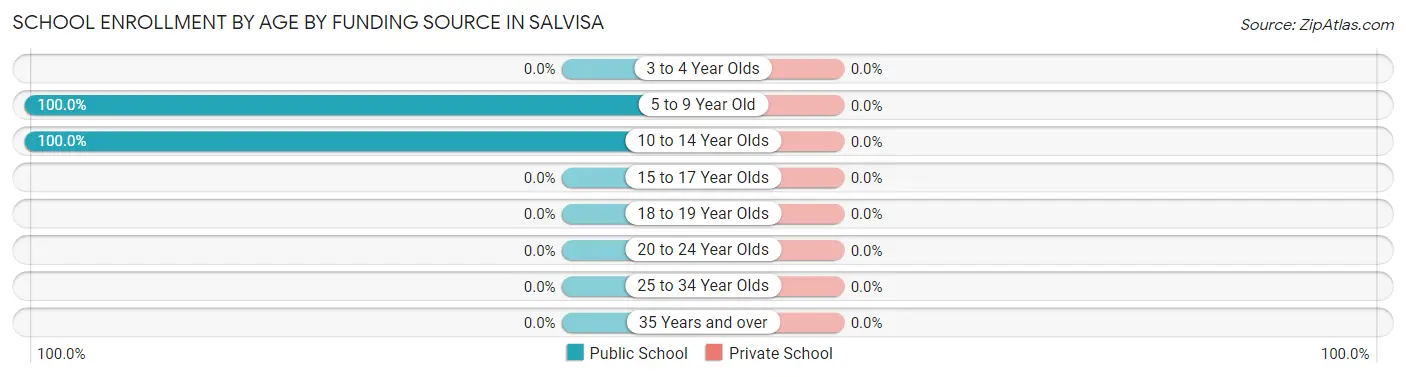
| Age Bracket | Public School | Private School |
| 3 to 4 Year Olds | 0 (0.0%) | 0 (0.0%) |
| 5 to 9 Year Old | 58 (100.0%) | 0 (0.0%) |
| 10 to 14 Year Olds | 10 (100.0%) | 0 (0.0%) |
| 15 to 17 Year Olds | 0 (0.0%) | 0 (0.0%) |
| 18 to 19 Year Olds | 0 (0.0%) | 0 (0.0%) |
| 20 to 24 Year Olds | 0 (0.0%) | 0 (0.0%) |
| 25 to 34 Year Olds | 0 (0.0%) | 0 (0.0%) |
| 35 Years and over | 0 (0.0%) | 0 (0.0%) |
| Total | 68 (100.0%) | 0 (0.0%) |
Educational Attainment by Field of Study in Salvisa
Social sciences (15 | 29.4%), bio, nature & agricultural (12 | 23.5%), education (12 | 23.5%), and communications (12 | 23.5%) are the most common fields of study among 51 individuals in Salvisa who have obtained a bachelor's degree or higher.
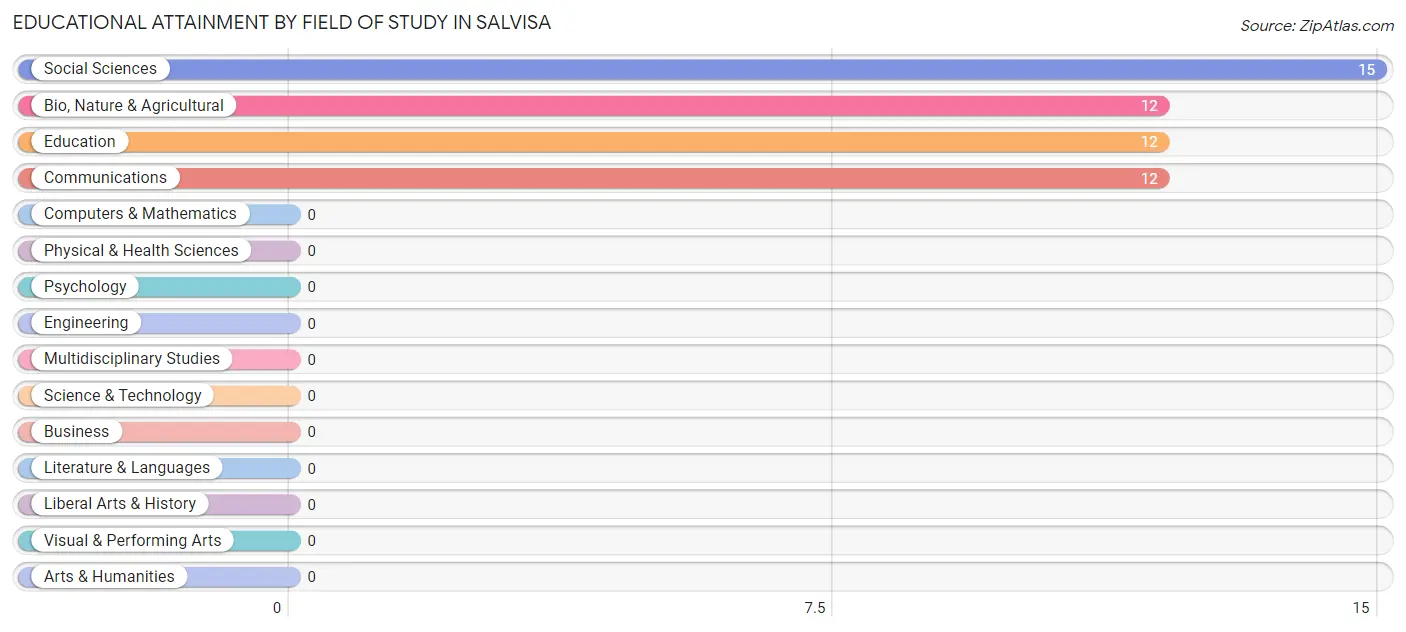
| Field of Study | # Graduates | % Graduates |
| Computers & Mathematics | 0 | 0.0% |
| Bio, Nature & Agricultural | 12 | 23.5% |
| Physical & Health Sciences | 0 | 0.0% |
| Psychology | 0 | 0.0% |
| Social Sciences | 15 | 29.4% |
| Engineering | 0 | 0.0% |
| Multidisciplinary Studies | 0 | 0.0% |
| Science & Technology | 0 | 0.0% |
| Business | 0 | 0.0% |
| Education | 12 | 23.5% |
| Literature & Languages | 0 | 0.0% |
| Liberal Arts & History | 0 | 0.0% |
| Visual & Performing Arts | 0 | 0.0% |
| Communications | 12 | 23.5% |
| Arts & Humanities | 0 | 0.0% |
| Total | 51 | 100.0% |
Transportation & Commute in Salvisa
Vehicle Availability by Sex in Salvisa
The most prevalent vehicle ownership categories in Salvisa are males with 2 vehicles (45, accounting for 65.2%) and females with 2 vehicles (26, making up 173.1%).
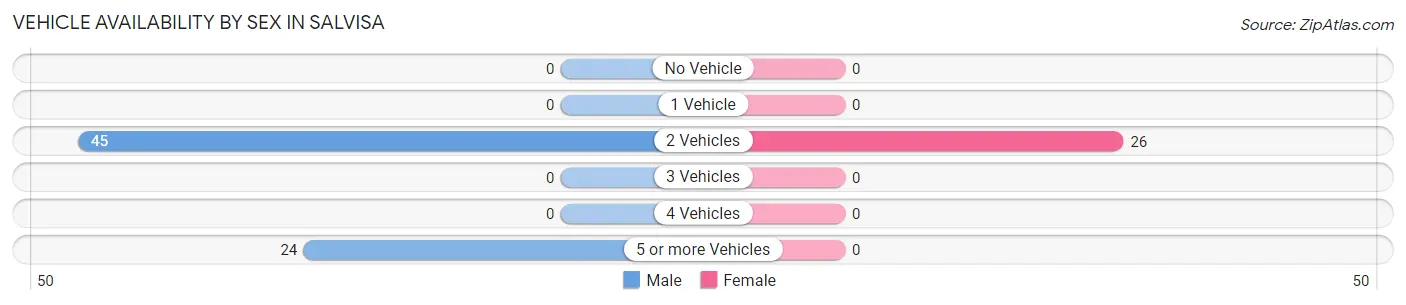
| Vehicles Available | Male | Female |
| No Vehicle | 0 (0.0%) | 0 (0.0%) |
| 1 Vehicle | 0 (0.0%) | 0 (0.0%) |
| 2 Vehicles | 45 (65.2%) | 26 (100.0%) |
| 3 Vehicles | 0 (0.0%) | 0 (0.0%) |
| 4 Vehicles | 0 (0.0%) | 0 (0.0%) |
| 5 or more Vehicles | 24 (34.8%) | 0 (0.0%) |
| Total | 69 (100.0%) | 26 (100.0%) |
Commute Time in Salvisa
The most frequently occuring commute durations in Salvisa are 15 to 19 minutes (56 commuters, 59.0%), 90 or more minutes (27 commuters, 28.4%), and 45 to 59 minutes (12 commuters, 12.6%).
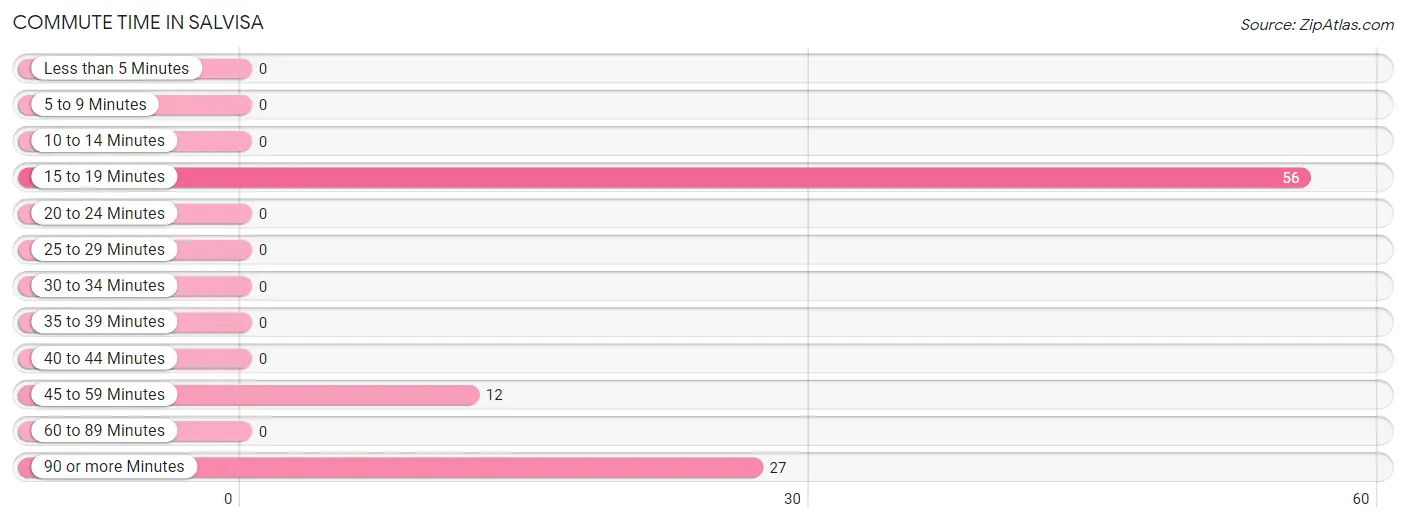
| Commute Time | # Commuters | % Commuters |
| Less than 5 Minutes | 0 | 0.0% |
| 5 to 9 Minutes | 0 | 0.0% |
| 10 to 14 Minutes | 0 | 0.0% |
| 15 to 19 Minutes | 56 | 59.0% |
| 20 to 24 Minutes | 0 | 0.0% |
| 25 to 29 Minutes | 0 | 0.0% |
| 30 to 34 Minutes | 0 | 0.0% |
| 35 to 39 Minutes | 0 | 0.0% |
| 40 to 44 Minutes | 0 | 0.0% |
| 45 to 59 Minutes | 12 | 12.6% |
| 60 to 89 Minutes | 0 | 0.0% |
| 90 or more Minutes | 27 | 28.4% |
Commute Time by Sex in Salvisa
The most common commute times in Salvisa are 15 to 19 minutes (45 commuters, 65.2%) for males and 90 or more minutes (15 commuters, 57.7%) for females.
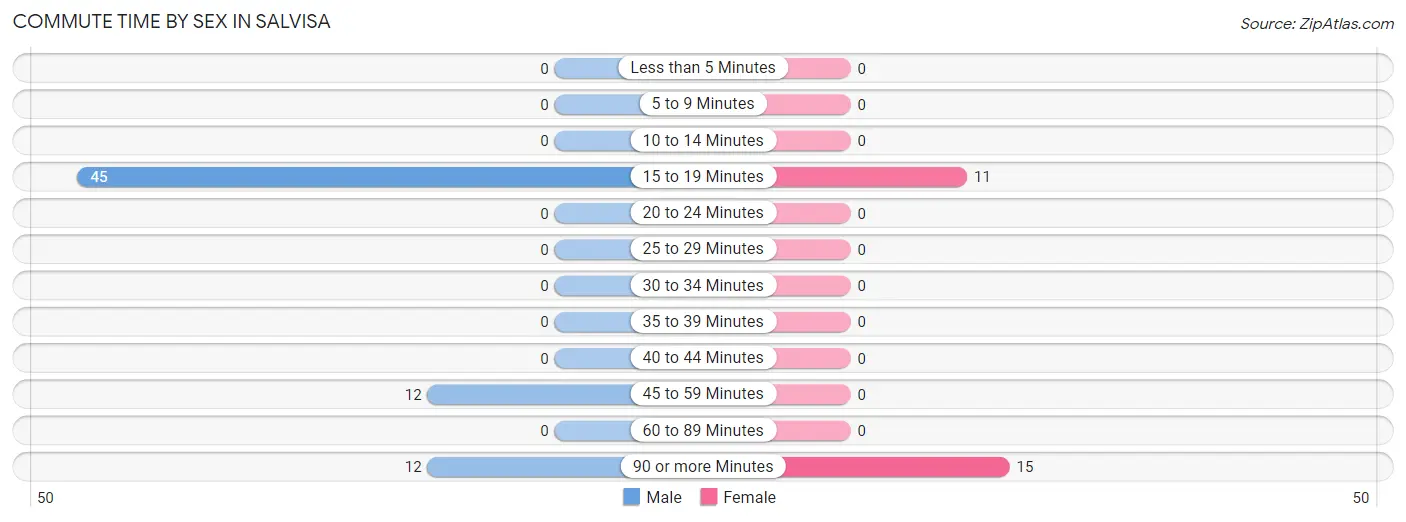
| Commute Time | Male | Female |
| Less than 5 Minutes | 0 (0.0%) | 0 (0.0%) |
| 5 to 9 Minutes | 0 (0.0%) | 0 (0.0%) |
| 10 to 14 Minutes | 0 (0.0%) | 0 (0.0%) |
| 15 to 19 Minutes | 45 (65.2%) | 11 (42.3%) |
| 20 to 24 Minutes | 0 (0.0%) | 0 (0.0%) |
| 25 to 29 Minutes | 0 (0.0%) | 0 (0.0%) |
| 30 to 34 Minutes | 0 (0.0%) | 0 (0.0%) |
| 35 to 39 Minutes | 0 (0.0%) | 0 (0.0%) |
| 40 to 44 Minutes | 0 (0.0%) | 0 (0.0%) |
| 45 to 59 Minutes | 12 (17.4%) | 0 (0.0%) |
| 60 to 89 Minutes | 0 (0.0%) | 0 (0.0%) |
| 90 or more Minutes | 12 (17.4%) | 15 (57.7%) |
Time of Departure to Work by Sex in Salvisa
The most frequent times of departure to work in Salvisa are 6:30 AM to 6:59 AM (24, 34.8%) for males and 8:00 AM to 8:29 AM (15, 57.7%) for females.
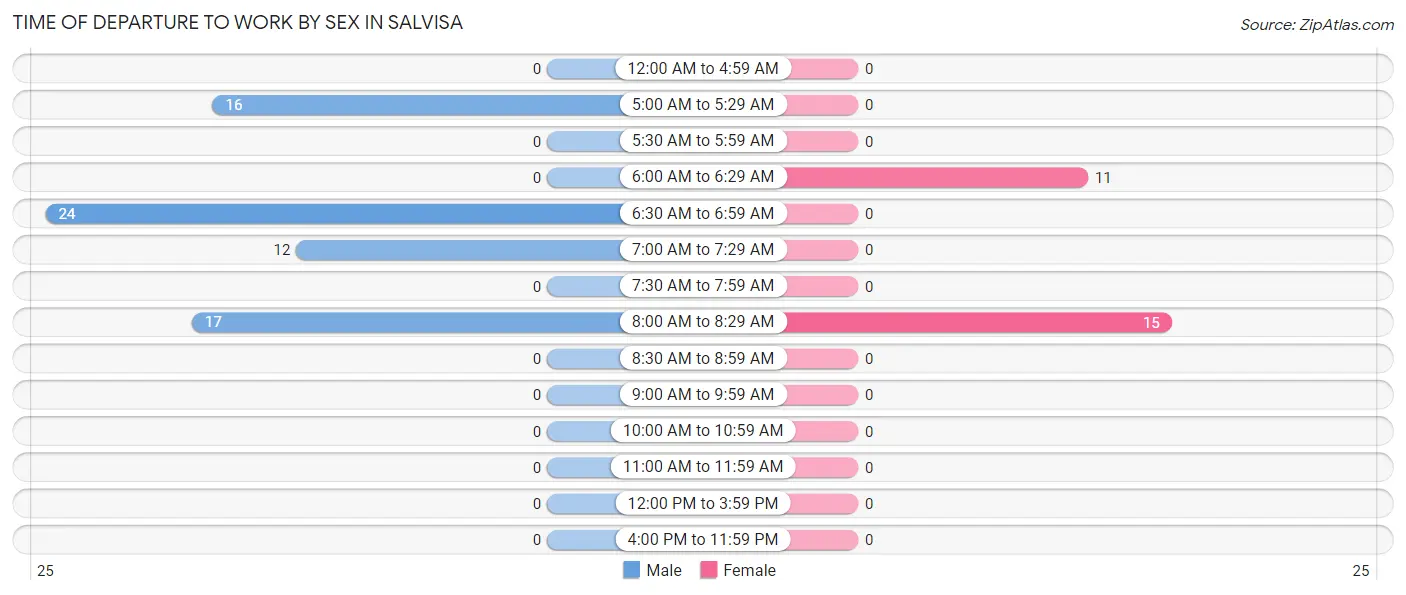
| Time of Departure | Male | Female |
| 12:00 AM to 4:59 AM | 0 (0.0%) | 0 (0.0%) |
| 5:00 AM to 5:29 AM | 16 (23.2%) | 0 (0.0%) |
| 5:30 AM to 5:59 AM | 0 (0.0%) | 0 (0.0%) |
| 6:00 AM to 6:29 AM | 0 (0.0%) | 11 (42.3%) |
| 6:30 AM to 6:59 AM | 24 (34.8%) | 0 (0.0%) |
| 7:00 AM to 7:29 AM | 12 (17.4%) | 0 (0.0%) |
| 7:30 AM to 7:59 AM | 0 (0.0%) | 0 (0.0%) |
| 8:00 AM to 8:29 AM | 17 (24.6%) | 15 (57.7%) |
| 8:30 AM to 8:59 AM | 0 (0.0%) | 0 (0.0%) |
| 9:00 AM to 9:59 AM | 0 (0.0%) | 0 (0.0%) |
| 10:00 AM to 10:59 AM | 0 (0.0%) | 0 (0.0%) |
| 11:00 AM to 11:59 AM | 0 (0.0%) | 0 (0.0%) |
| 12:00 PM to 3:59 PM | 0 (0.0%) | 0 (0.0%) |
| 4:00 PM to 11:59 PM | 0 (0.0%) | 0 (0.0%) |
| Total | 69 (100.0%) | 26 (100.0%) |
Housing Occupancy in Salvisa
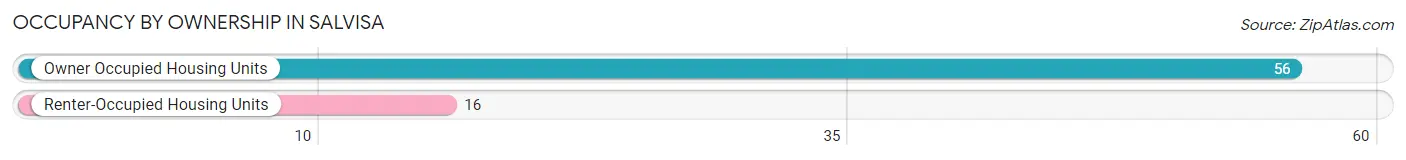
Occupancy by Ownership in Salvisa
Of the total 72 dwellings in Salvisa, owner-occupied units account for 56 (77.8%), while renter-occupied units make up 16 (22.2%).
| Occupancy | # Housing Units | % Housing Units |
| Owner Occupied Housing Units | 56 | 77.8% |
| Renter-Occupied Housing Units | 16 | 22.2% |
| Total Occupied Housing Units | 72 | 100.0% |
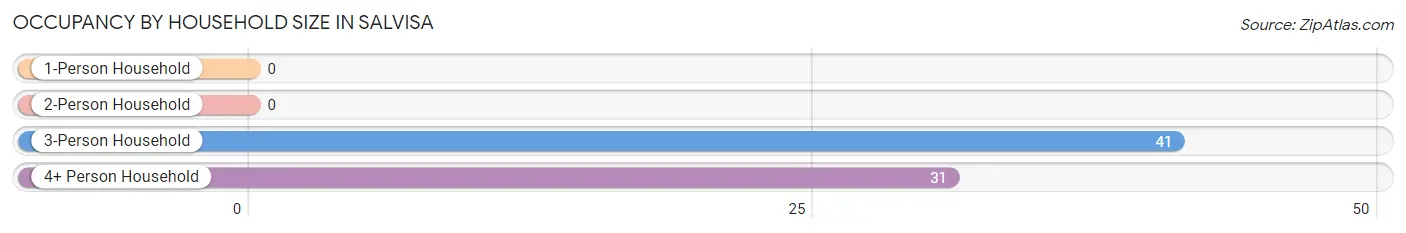
Occupancy by Household Size in Salvisa
| Household Size | # Housing Units | % Housing Units |
| 1-Person Household | 0 | 0.0% |
| 2-Person Household | 0 | 0.0% |
| 3-Person Household | 41 | 56.9% |
| 4+ Person Household | 31 | 43.1% |
| Total Housing Units | 72 | 100.0% |
Occupancy by Ownership by Household Size in Salvisa
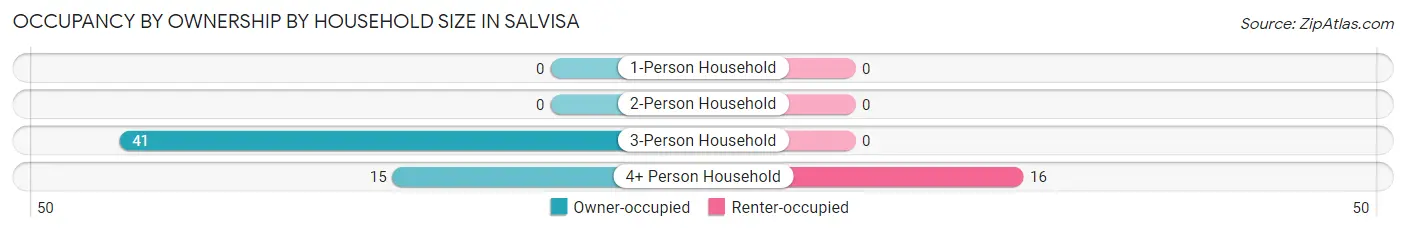
| Household Size | Owner-occupied | Renter-occupied |
| 1-Person Household | 0 (0.0%) | 0 (0.0%) |
| 2-Person Household | 0 (0.0%) | 0 (0.0%) |
| 3-Person Household | 41 (100.0%) | 0 (0.0%) |
| 4+ Person Household | 15 (48.4%) | 16 (51.6%) |
| Total Housing Units | 56 (77.8%) | 16 (22.2%) |
Occupancy by Educational Attainment in Salvisa
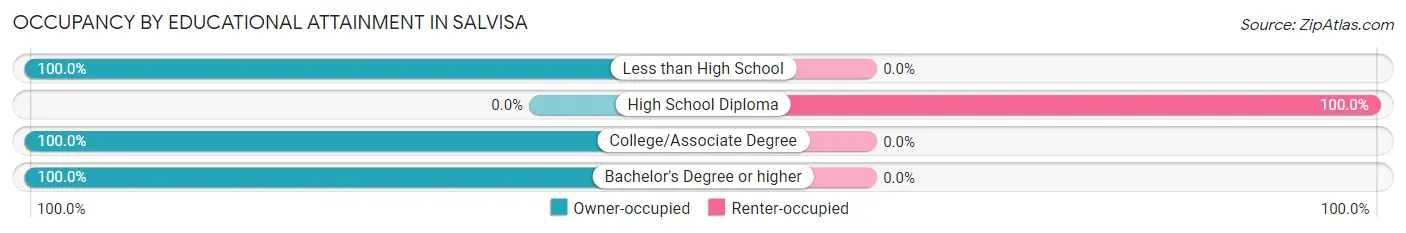
| Household Size | Owner-occupied | Renter-occupied |
| Less than High School | 23 (100.0%) | 0 (0.0%) |
| High School Diploma | 0 (0.0%) | 16 (100.0%) |
| College/Associate Degree | 18 (100.0%) | 0 (0.0%) |
| Bachelor's Degree or higher | 15 (100.0%) | 0 (0.0%) |
Occupancy by Age of Householder in Salvisa
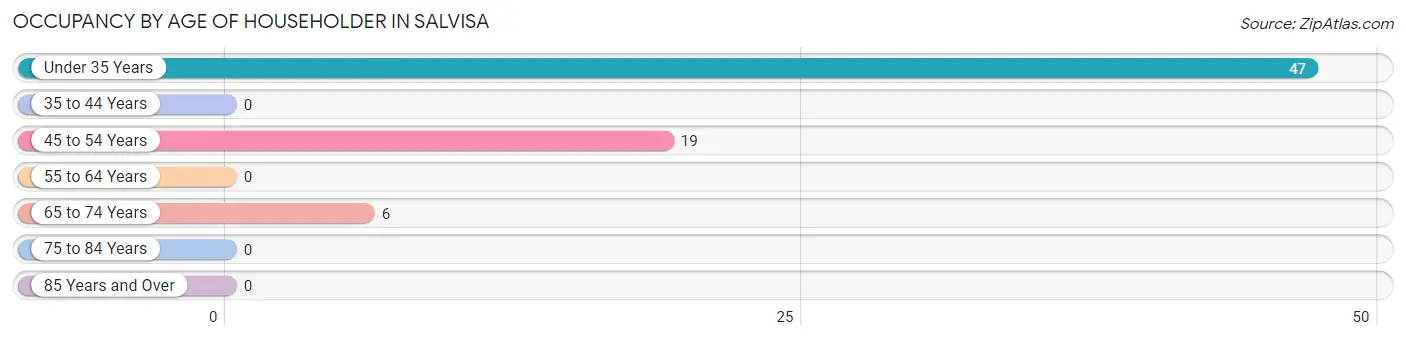
| Age Bracket | # Households | % Households |
| Under 35 Years | 47 | 65.3% |
| 35 to 44 Years | 0 | 0.0% |
| 45 to 54 Years | 19 | 26.4% |
| 55 to 64 Years | 0 | 0.0% |
| 65 to 74 Years | 6 | 8.3% |
| 75 to 84 Years | 0 | 0.0% |
| 85 Years and Over | 0 | 0.0% |
| Total | 72 | 100.0% |
Housing Finances in Salvisa
Median Income by Occupancy in Salvisa
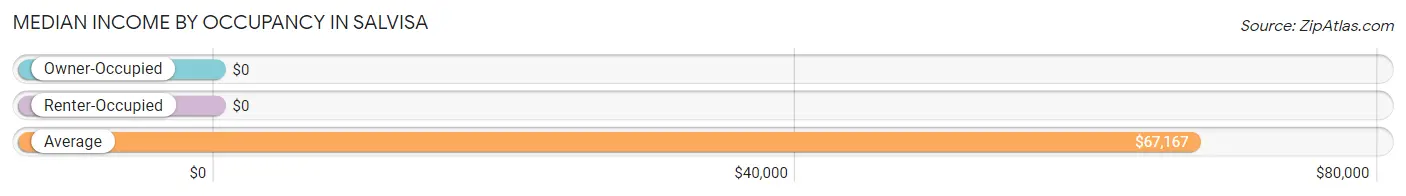
| Occupancy Type | # Households | Median Income |
| Owner-Occupied | 56 (77.8%) | $0 |
| Renter-Occupied | 16 (22.2%) | $0 |
| Average | 72 (100.0%) | $67,167 |
Occupancy by Householder Income Bracket in Salvisa
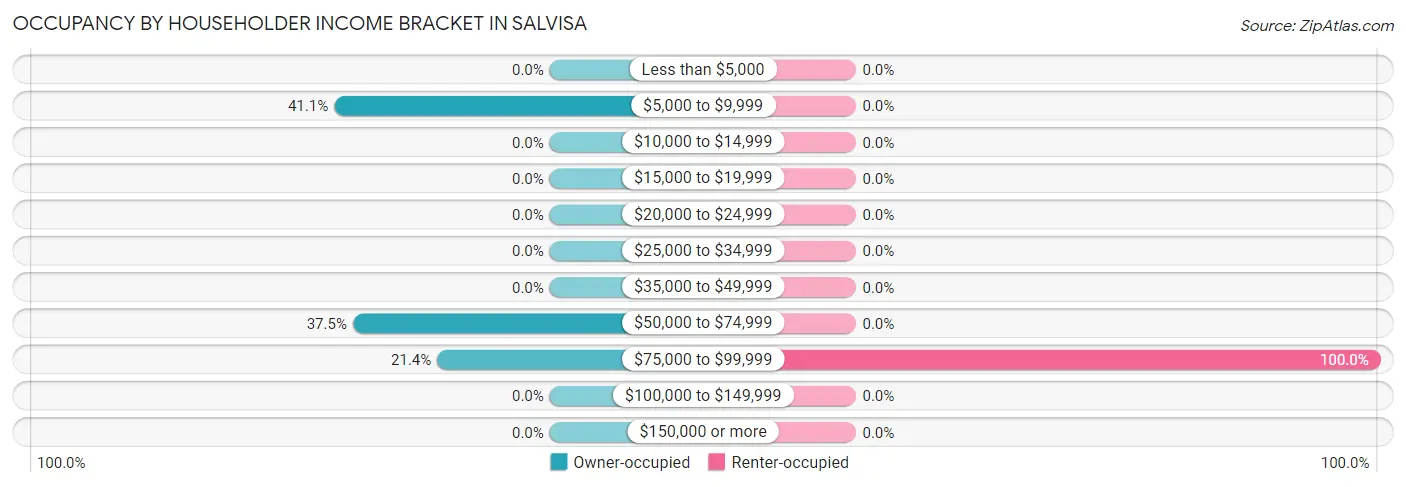
| Income Bracket | Owner-occupied | Renter-occupied |
| Less than $5,000 | 0 (0.0%) | 0 (0.0%) |
| $5,000 to $9,999 | 23 (41.1%) | 0 (0.0%) |
| $10,000 to $14,999 | 0 (0.0%) | 0 (0.0%) |
| $15,000 to $19,999 | 0 (0.0%) | 0 (0.0%) |
| $20,000 to $24,999 | 0 (0.0%) | 0 (0.0%) |
| $25,000 to $34,999 | 0 (0.0%) | 0 (0.0%) |
| $35,000 to $49,999 | 0 (0.0%) | 0 (0.0%) |
| $50,000 to $74,999 | 21 (37.5%) | 0 (0.0%) |
| $75,000 to $99,999 | 12 (21.4%) | 16 (100.0%) |
| $100,000 to $149,999 | 0 (0.0%) | 0 (0.0%) |
| $150,000 or more | 0 (0.0%) | 0 (0.0%) |
| Total | 56 (100.0%) | 16 (100.0%) |
Monthly Housing Cost Tiers in Salvisa
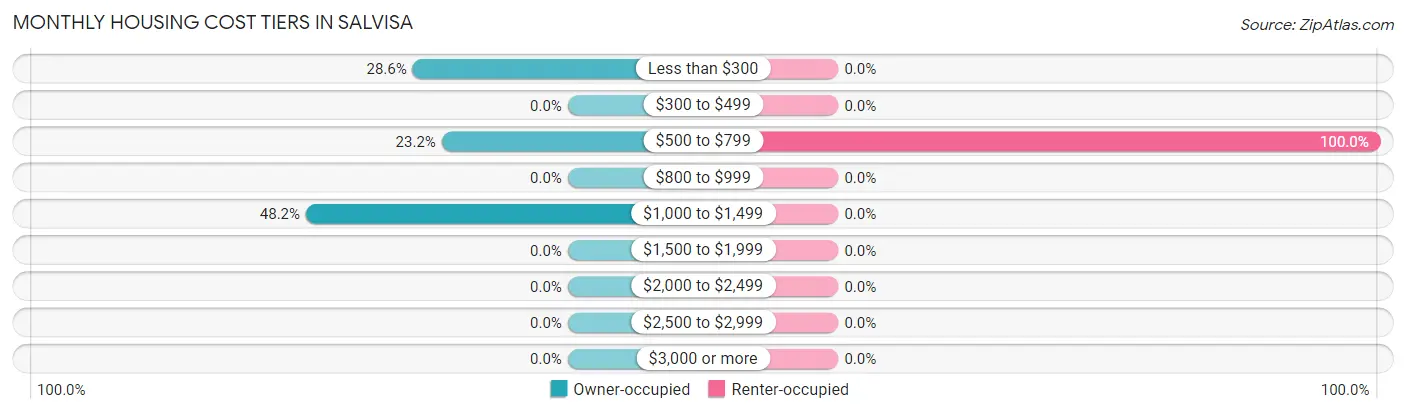
| Monthly Cost | Owner-occupied | Renter-occupied |
| Less than $300 | 16 (28.6%) | 0 (0.0%) |
| $300 to $499 | 0 (0.0%) | 0 (0.0%) |
| $500 to $799 | 13 (23.2%) | 16 (100.0%) |
| $800 to $999 | 0 (0.0%) | 0 (0.0%) |
| $1,000 to $1,499 | 27 (48.2%) | 0 (0.0%) |
| $1,500 to $1,999 | 0 (0.0%) | 0 (0.0%) |
| $2,000 to $2,499 | 0 (0.0%) | 0 (0.0%) |
| $2,500 to $2,999 | 0 (0.0%) | 0 (0.0%) |
| $3,000 or more | 0 (0.0%) | 0 (0.0%) |
| Total | 56 (100.0%) | 16 (100.0%) |
Physical Housing Characteristics in Salvisa
Housing Structures in Salvisa
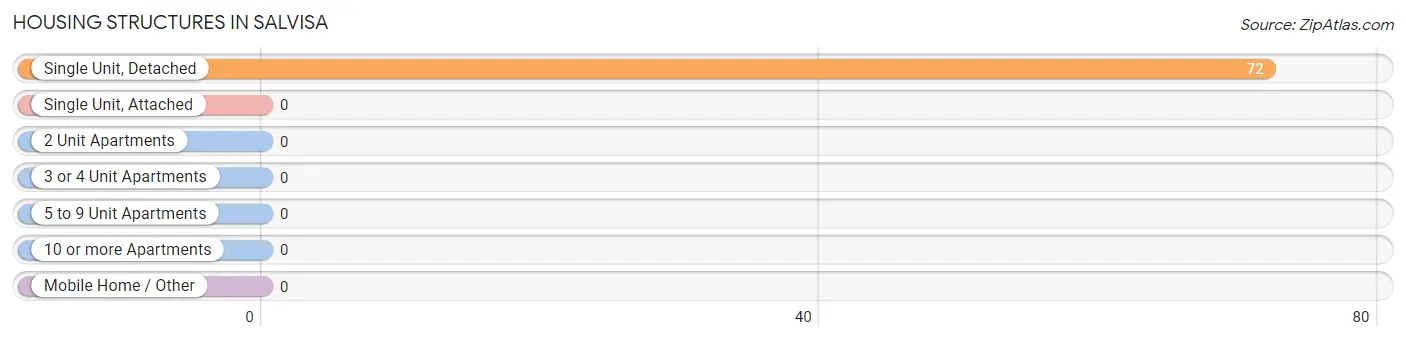
| Structure Type | # Housing Units | % Housing Units |
| Single Unit, Detached | 72 | 100.0% |
| Single Unit, Attached | 0 | 0.0% |
| 2 Unit Apartments | 0 | 0.0% |
| 3 or 4 Unit Apartments | 0 | 0.0% |
| 5 to 9 Unit Apartments | 0 | 0.0% |
| 10 or more Apartments | 0 | 0.0% |
| Mobile Home / Other | 0 | 0.0% |
| Total | 72 | 100.0% |
Housing Structures by Occupancy in Salvisa
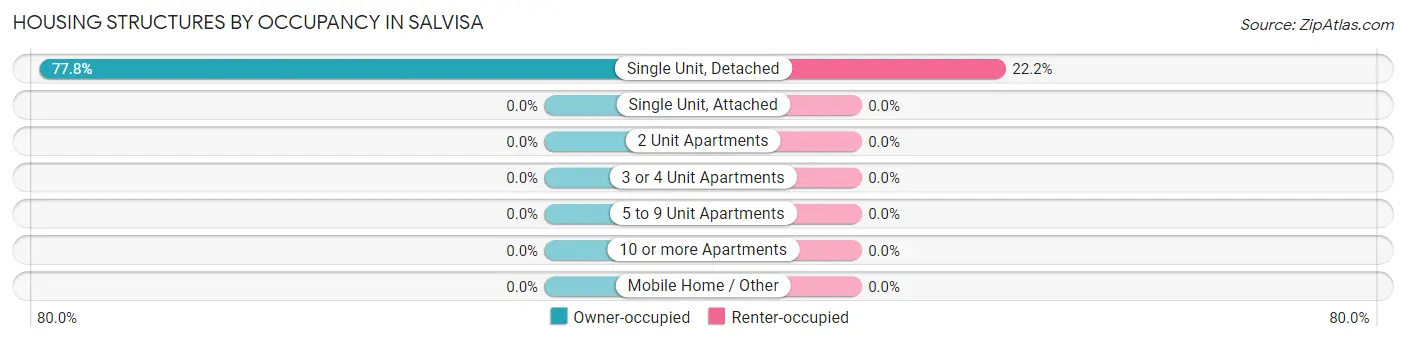
| Structure Type | Owner-occupied | Renter-occupied |
| Single Unit, Detached | 56 (77.8%) | 16 (22.2%) |
| Single Unit, Attached | 0 (0.0%) | 0 (0.0%) |
| 2 Unit Apartments | 0 (0.0%) | 0 (0.0%) |
| 3 or 4 Unit Apartments | 0 (0.0%) | 0 (0.0%) |
| 5 to 9 Unit Apartments | 0 (0.0%) | 0 (0.0%) |
| 10 or more Apartments | 0 (0.0%) | 0 (0.0%) |
| Mobile Home / Other | 0 (0.0%) | 0 (0.0%) |
| Total | 56 (77.8%) | 16 (22.2%) |
Housing Structures by Number of Rooms in Salvisa
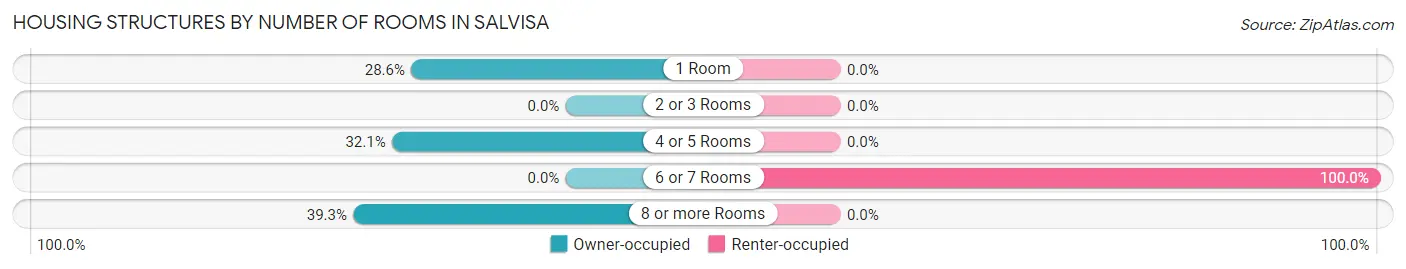
| Number of Rooms | Owner-occupied | Renter-occupied |
| 1 Room | 16 (28.6%) | 0 (0.0%) |
| 2 or 3 Rooms | 0 (0.0%) | 0 (0.0%) |
| 4 or 5 Rooms | 18 (32.1%) | 0 (0.0%) |
| 6 or 7 Rooms | 0 (0.0%) | 16 (100.0%) |
| 8 or more Rooms | 22 (39.3%) | 0 (0.0%) |
| Total | 56 (100.0%) | 16 (100.0%) |
Housing Structure by Heating Type in Salvisa
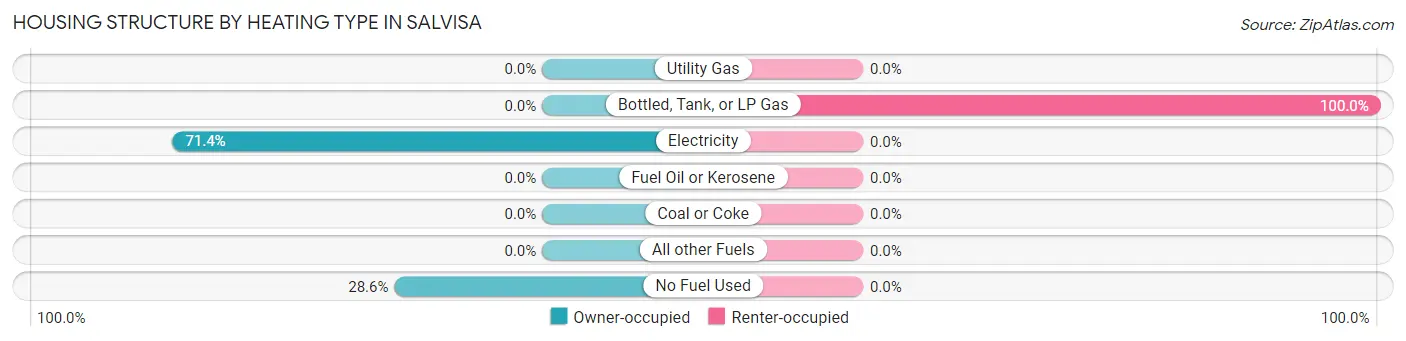
| Heating Type | Owner-occupied | Renter-occupied |
| Utility Gas | 0 (0.0%) | 0 (0.0%) |
| Bottled, Tank, or LP Gas | 0 (0.0%) | 16 (100.0%) |
| Electricity | 40 (71.4%) | 0 (0.0%) |
| Fuel Oil or Kerosene | 0 (0.0%) | 0 (0.0%) |
| Coal or Coke | 0 (0.0%) | 0 (0.0%) |
| All other Fuels | 0 (0.0%) | 0 (0.0%) |
| No Fuel Used | 16 (28.6%) | 0 (0.0%) |
| Total | 56 (100.0%) | 16 (100.0%) |
Household Vehicle Usage in Salvisa
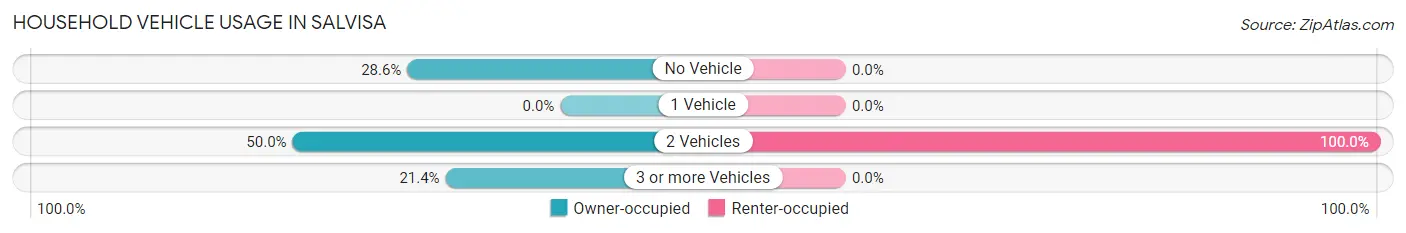
| Vehicles per Household | Owner-occupied | Renter-occupied |
| No Vehicle | 16 (28.6%) | 0 (0.0%) |
| 1 Vehicle | 0 (0.0%) | 0 (0.0%) |
| 2 Vehicles | 28 (50.0%) | 16 (100.0%) |
| 3 or more Vehicles | 12 (21.4%) | 0 (0.0%) |
| Total | 56 (100.0%) | 16 (100.0%) |
Real Estate & Mortgages in Salvisa
Real Estate and Mortgage Overview in Salvisa
| Characteristic | Without Mortgage | With Mortgage |
| Housing Units | 23 | 33 |
| Median Property Value | - | - |
| Median Household Income | - | - |
| Monthly Housing Costs | - | - |
| Real Estate Taxes | - | - |
Property Value by Mortgage Status in Salvisa
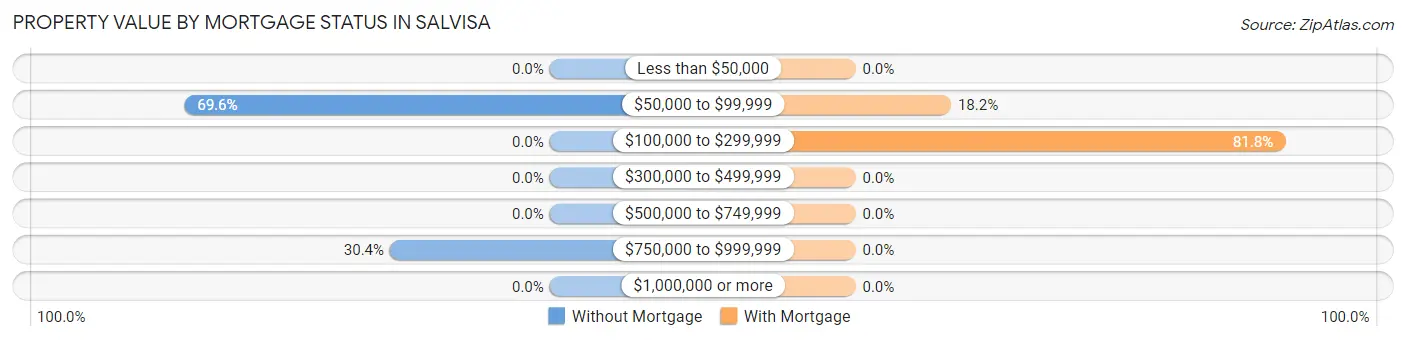
| Property Value | Without Mortgage | With Mortgage |
| Less than $50,000 | 0 (0.0%) | 0 (0.0%) |
| $50,000 to $99,999 | 16 (69.6%) | 6 (18.2%) |
| $100,000 to $299,999 | 0 (0.0%) | 27 (81.8%) |
| $300,000 to $499,999 | 0 (0.0%) | 0 (0.0%) |
| $500,000 to $749,999 | 0 (0.0%) | 0 (0.0%) |
| $750,000 to $999,999 | 7 (30.4%) | 0 (0.0%) |
| $1,000,000 or more | 0 (0.0%) | 0 (0.0%) |
| Total | 23 (100.0%) | 33 (100.0%) |
Household Income by Mortgage Status in Salvisa
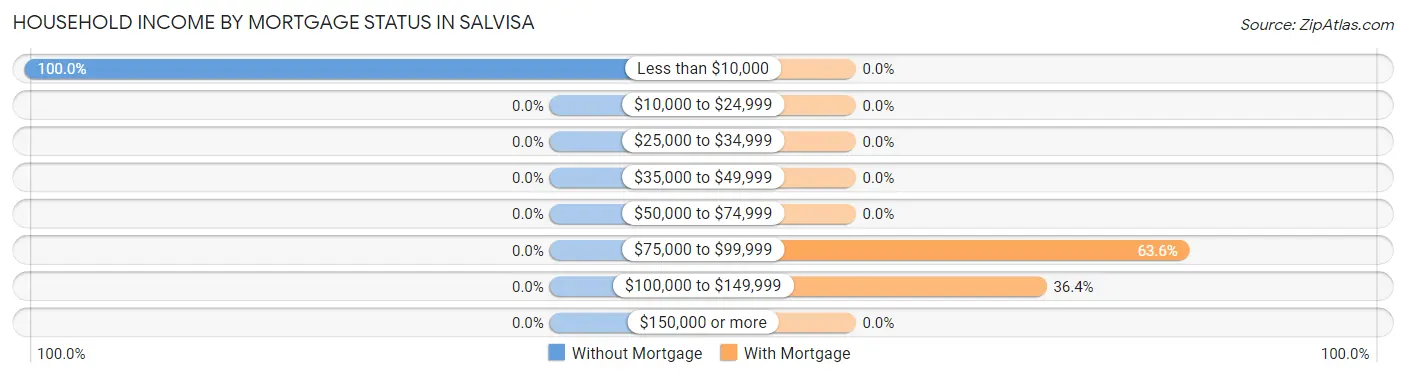
| Household Income | Without Mortgage | With Mortgage |
| Less than $10,000 | 23 (100.0%) | 0 (0.0%) |
| $10,000 to $24,999 | 0 (0.0%) | 0 (0.0%) |
| $25,000 to $34,999 | 0 (0.0%) | 0 (0.0%) |
| $35,000 to $49,999 | 0 (0.0%) | 0 (0.0%) |
| $50,000 to $74,999 | 0 (0.0%) | 0 (0.0%) |
| $75,000 to $99,999 | 0 (0.0%) | 21 (63.6%) |
| $100,000 to $149,999 | 0 (0.0%) | 12 (36.4%) |
| $150,000 or more | 0 (0.0%) | 0 (0.0%) |
| Total | 23 (100.0%) | 33 (100.0%) |
Property Value to Household Income Ratio in Salvisa
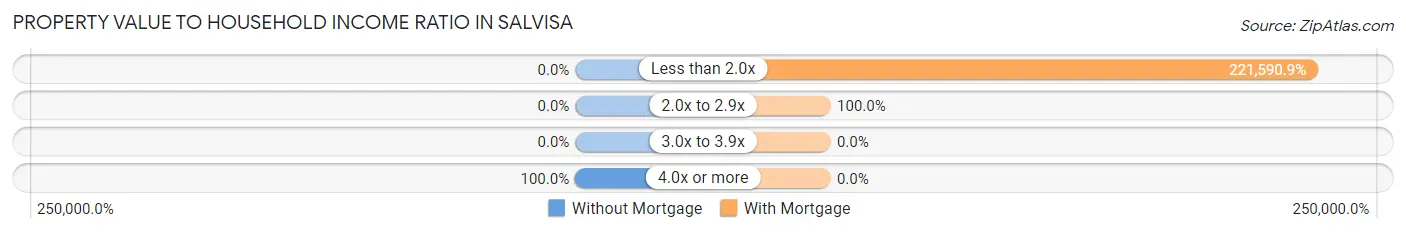
| Value-to-Income Ratio | Without Mortgage | With Mortgage |
| Less than 2.0x | 0 (0.0%) | 73,125 (221,590.9%) |
| 2.0x to 2.9x | 0 (0.0%) | 33 (100.0%) |
| 3.0x to 3.9x | 0 (0.0%) | 0 (0.0%) |
| 4.0x or more | 23 (100.0%) | 0 (0.0%) |
| Total | 23 (100.0%) | 33 (100.0%) |
Real Estate Taxes by Mortgage Status in Salvisa
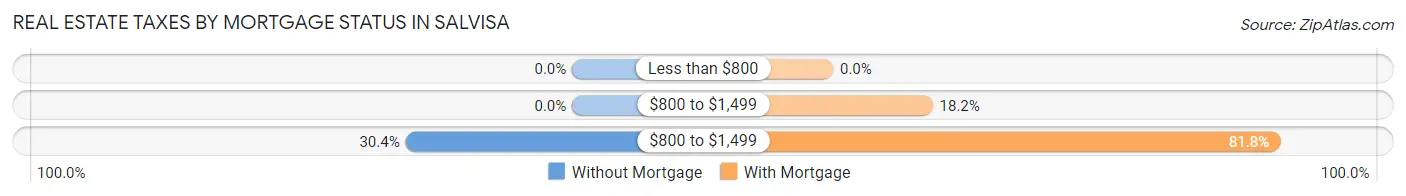
| Property Taxes | Without Mortgage | With Mortgage |
| Less than $800 | 0 (0.0%) | 0 (0.0%) |
| $800 to $1,499 | 0 (0.0%) | 6 (18.2%) |
| $800 to $1,499 | 7 (30.4%) | 27 (81.8%) |
| Total | 23 (100.0%) | 33 (100.0%) |
Health & Disability in Salvisa
Health Insurance Coverage by Age in Salvisa
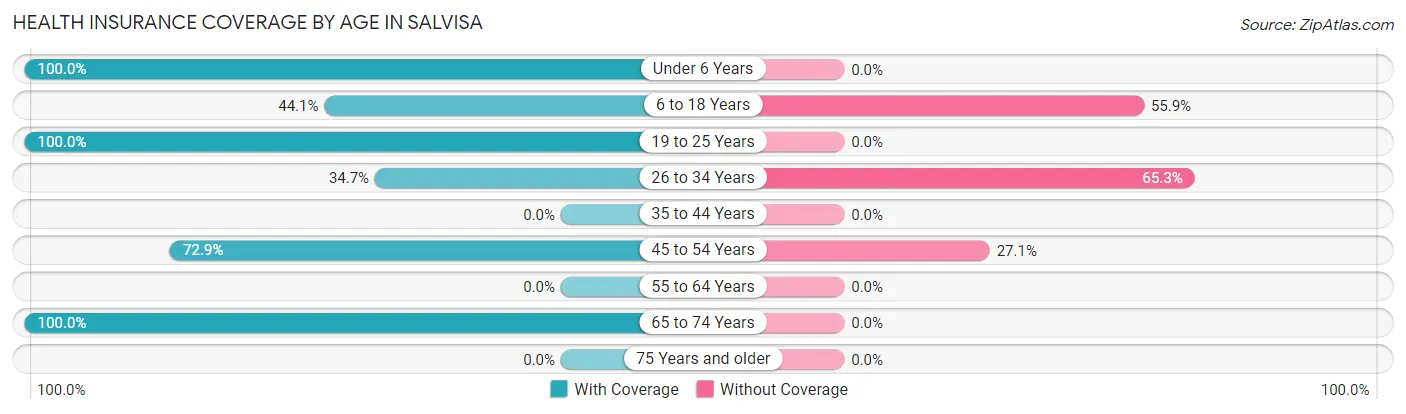
| Age Bracket | With Coverage | Without Coverage |
| Under 6 Years | 12 (100.0%) | 0 (0.0%) |
| 6 to 18 Years | 30 (44.1%) | 38 (55.9%) |
| 19 to 25 Years | 38 (100.0%) | 0 (0.0%) |
| 26 to 34 Years | 26 (34.7%) | 49 (65.3%) |
| 35 to 44 Years | 0 (0.0%) | 0 (0.0%) |
| 45 to 54 Years | 43 (72.9%) | 16 (27.1%) |
| 55 to 64 Years | 0 (0.0%) | 0 (0.0%) |
| 65 to 74 Years | 6 (100.0%) | 0 (0.0%) |
| 75 Years and older | 0 (0.0%) | 0 (0.0%) |
| Total | 155 (60.1%) | 103 (39.9%) |
Health Insurance Coverage by Citizenship Status in Salvisa
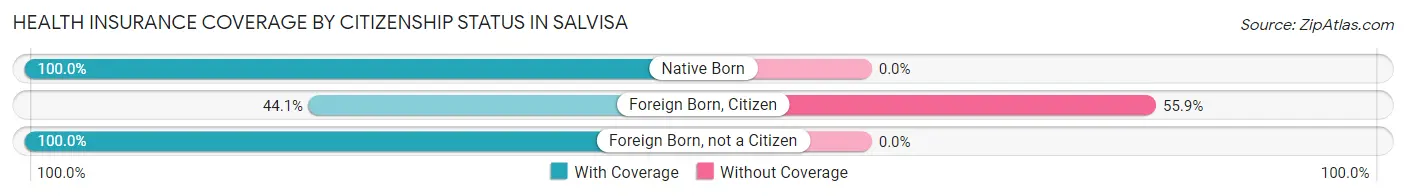
| Citizenship Status | With Coverage | Without Coverage |
| Native Born | 12 (100.0%) | 0 (0.0%) |
| Foreign Born, Citizen | 30 (44.1%) | 38 (55.9%) |
| Foreign Born, not a Citizen | 38 (100.0%) | 0 (0.0%) |
Health Insurance Coverage by Household Income in Salvisa
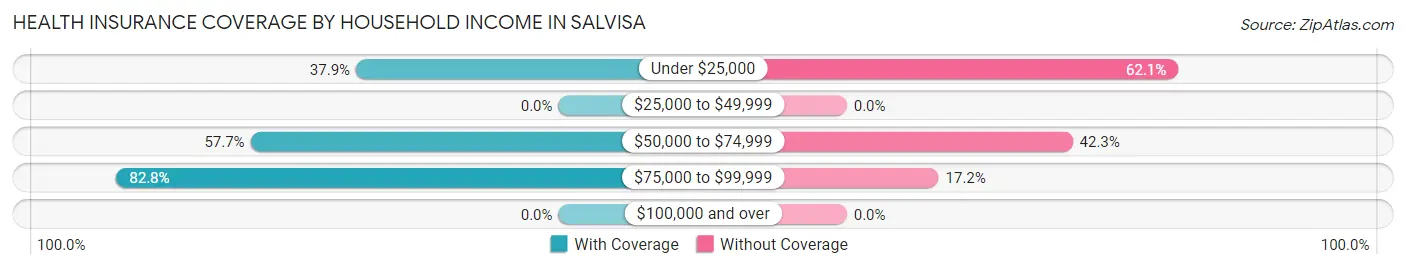
| Household Income | With Coverage | Without Coverage |
| Under $25,000 | 33 (37.9%) | 54 (62.1%) |
| $25,000 to $49,999 | 0 (0.0%) | 0 (0.0%) |
| $50,000 to $74,999 | 45 (57.7%) | 33 (42.3%) |
| $75,000 to $99,999 | 77 (82.8%) | 16 (17.2%) |
| $100,000 and over | 0 (0.0%) | 0 (0.0%) |
Public vs Private Health Insurance Coverage by Age in Salvisa
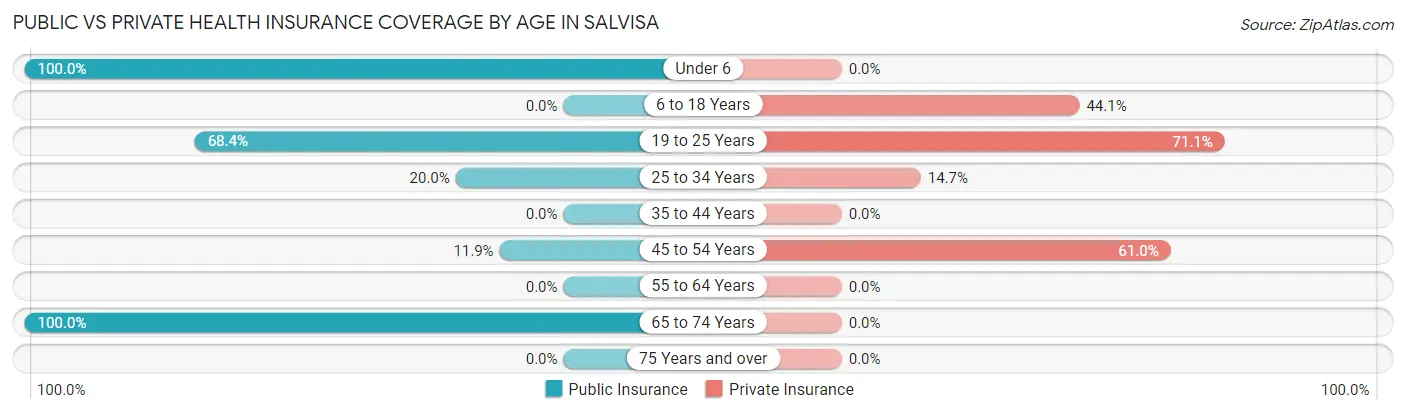
| Age Bracket | Public Insurance | Private Insurance |
| Under 6 | 12 (100.0%) | 0 (0.0%) |
| 6 to 18 Years | 0 (0.0%) | 30 (44.1%) |
| 19 to 25 Years | 26 (68.4%) | 27 (71.1%) |
| 25 to 34 Years | 15 (20.0%) | 11 (14.7%) |
| 35 to 44 Years | 0 (0.0%) | 0 (0.0%) |
| 45 to 54 Years | 7 (11.9%) | 36 (61.0%) |
| 55 to 64 Years | 0 (0.0%) | 0 (0.0%) |
| 65 to 74 Years | 6 (100.0%) | 0 (0.0%) |
| 75 Years and over | 0 (0.0%) | 0 (0.0%) |
| Total | 66 (25.6%) | 104 (40.3%) |
Disability Status by Sex by Age in Salvisa
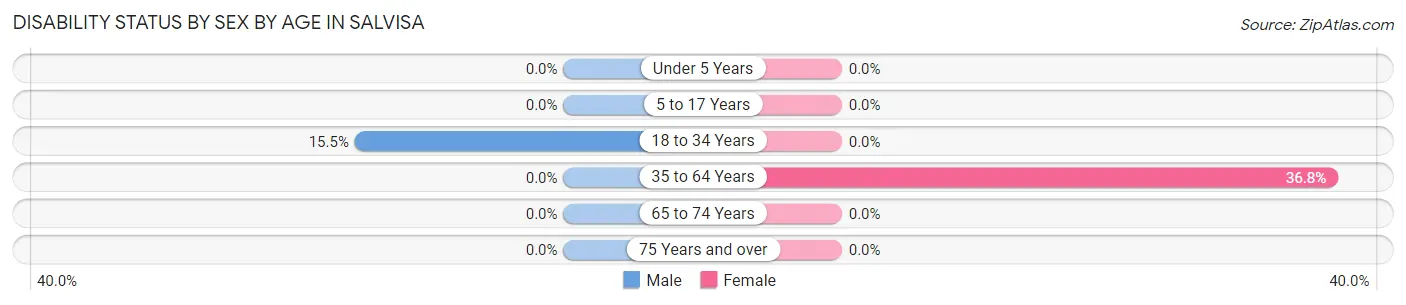
| Age Bracket | Male | Female |
| Under 5 Years | 0 (0.0%) | 0 (0.0%) |
| 5 to 17 Years | 0 (0.0%) | 0 (0.0%) |
| 18 to 34 Years | 11 (15.5%) | 0 (0.0%) |
| 35 to 64 Years | 0 (0.0%) | 7 (36.8%) |
| 65 to 74 Years | 0 (0.0%) | 0 (0.0%) |
| 75 Years and over | 0 (0.0%) | 0 (0.0%) |
Disability Class by Sex by Age in Salvisa
Disability Class: Hearing Difficulty
| Age Bracket | Male | Female |
| Under 5 Years | 0 (0.0%) | 0 (0.0%) |
| 5 to 17 Years | 0 (0.0%) | 0 (0.0%) |
| 18 to 34 Years | 0 (0.0%) | 0 (0.0%) |
| 35 to 64 Years | 0 (0.0%) | 0 (0.0%) |
| 65 to 74 Years | 0 (0.0%) | 0 (0.0%) |
| 75 Years and over | 0 (0.0%) | 0 (0.0%) |
Disability Class: Vision Difficulty
| Age Bracket | Male | Female |
| Under 5 Years | 0 (0.0%) | 0 (0.0%) |
| 5 to 17 Years | 0 (0.0%) | 0 (0.0%) |
| 18 to 34 Years | 0 (0.0%) | 0 (0.0%) |
| 35 to 64 Years | 0 (0.0%) | 0 (0.0%) |
| 65 to 74 Years | 0 (0.0%) | 0 (0.0%) |
| 75 Years and over | 0 (0.0%) | 0 (0.0%) |
Disability Class: Cognitive Difficulty
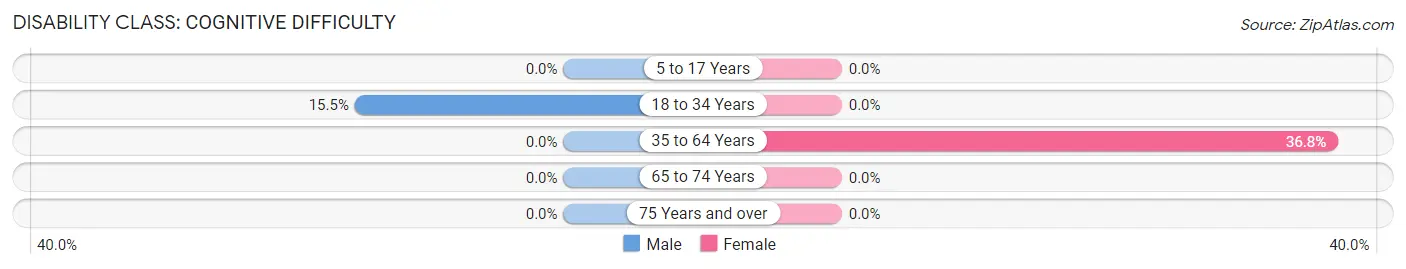
| Age Bracket | Male | Female |
| 5 to 17 Years | 0 (0.0%) | 0 (0.0%) |
| 18 to 34 Years | 11 (15.5%) | 0 (0.0%) |
| 35 to 64 Years | 0 (0.0%) | 7 (36.8%) |
| 65 to 74 Years | 0 (0.0%) | 0 (0.0%) |
| 75 Years and over | 0 (0.0%) | 0 (0.0%) |
Disability Class: Ambulatory Difficulty
| Age Bracket | Male | Female |
| 5 to 17 Years | 0 (0.0%) | 0 (0.0%) |
| 18 to 34 Years | 0 (0.0%) | 0 (0.0%) |
| 35 to 64 Years | 0 (0.0%) | 0 (0.0%) |
| 65 to 74 Years | 0 (0.0%) | 0 (0.0%) |
| 75 Years and over | 0 (0.0%) | 0 (0.0%) |
Disability Class: Self-Care Difficulty
| Age Bracket | Male | Female |
| 5 to 17 Years | 0 (0.0%) | 0 (0.0%) |
| 18 to 34 Years | 0 (0.0%) | 0 (0.0%) |
| 35 to 64 Years | 0 (0.0%) | 0 (0.0%) |
| 65 to 74 Years | 0 (0.0%) | 0 (0.0%) |
| 75 Years and over | 0 (0.0%) | 0 (0.0%) |
Technology Access in Salvisa
Computing Device Access in Salvisa
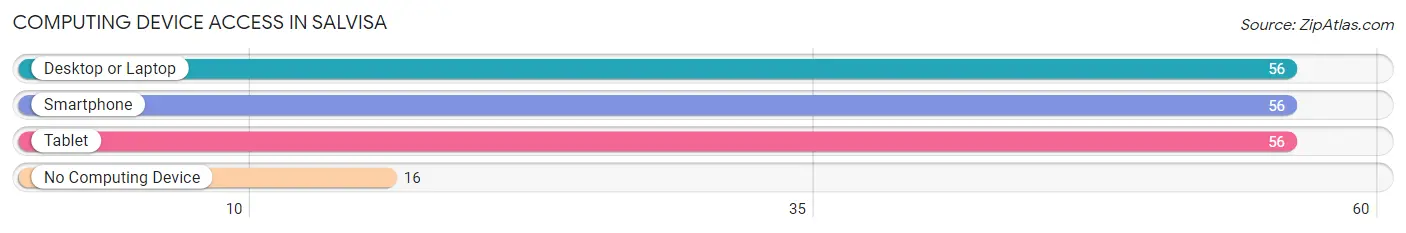
| Device Type | # Households | % Households |
| Desktop or Laptop | 56 | 77.8% |
| Smartphone | 56 | 77.8% |
| Tablet | 56 | 77.8% |
| No Computing Device | 16 | 22.2% |
| Total | 72 | 100.0% |
Internet Access in Salvisa
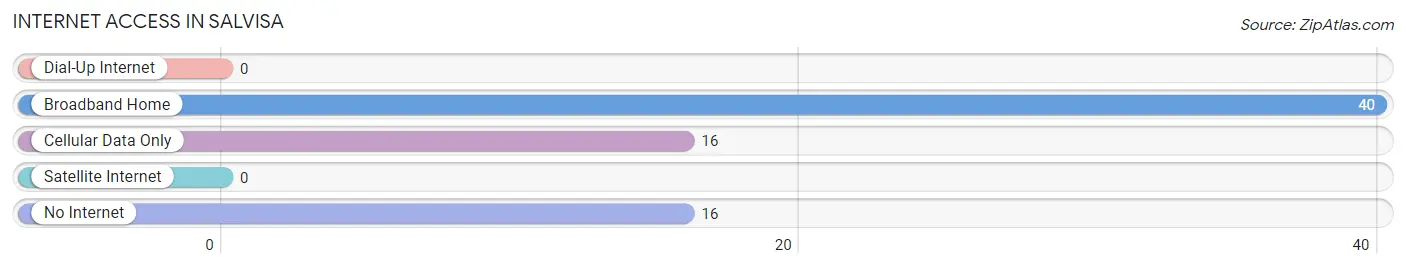
| Internet Type | # Households | % Households |
| Dial-Up Internet | 0 | 0.0% |
| Broadband Home | 40 | 55.6% |
| Cellular Data Only | 16 | 22.2% |
| Satellite Internet | 0 | 0.0% |
| No Internet | 16 | 22.2% |
| Total | 72 | 100.0% |
Salvisa Summary
Salvisa is a small unincorporated community located in Mercer County, Kentucky, United States. It is situated along the Kentucky River, approximately 15 miles northeast of Harrodsburg. The population of Salvisa was estimated to be around 500 in 2020.
History
The area that is now Salvisa was first settled in the late 1700s by a group of settlers from Virginia. The town was originally known as “Salvisa Station” and was a stop on the Louisville and Nashville Railroad. The town was officially incorporated in 1837 and was named after the Salvisa Creek, which runs through the area.
In the late 1800s, Salvisa was a thriving agricultural community. The town was home to several mills, including a grist mill, a saw mill, and a woolen mill. The town also had a post office, a general store, and a blacksmith shop.
In the early 1900s, Salvisa began to decline as the railroad industry began to decline. The town’s population decreased and many of the businesses closed. In the 1950s, the town was revitalized when the Kentucky River was dammed to create Lake Herrington. The lake brought new visitors to the area and the town began to grow again.
Geography
Salvisa is located in Mercer County, Kentucky, approximately 15 miles northeast of Harrodsburg. The town is situated along the Kentucky River and is surrounded by rolling hills and farmland. The climate in Salvisa is humid subtropical, with hot summers and mild winters.
Economy
The economy of Salvisa is largely based on agriculture and tourism. The town is home to several farms, which produce corn, soybeans, wheat, and hay. The town is also home to several wineries, which produce a variety of wines.
Tourism is an important part of the economy in Salvisa. The town is home to several attractions, including the Kentucky River Museum, the Salvisa Historical Society, and the Salvisa Ruritan Club. The town also hosts several festivals throughout the year, including the Salvisa Days Festival and the Salvisa Music Festival.
Demographics
The population of Salvisa was estimated to be around 500 in 2020. The town is predominantly white, with a small African American population. The median household income in Salvisa is $45,000, and the median home value is $150,000.
Conclusion
Salvisa is a small unincorporated community located in Mercer County, Kentucky. The town has a rich history and is home to several attractions, including the Kentucky River Museum and the Salvisa Historical Society. The economy of Salvisa is largely based on agriculture and tourism, and the population of the town was estimated to be around 500 in 2020.
Common Questions
What is Per Capita Income in Salvisa?
Per Capita income in Salvisa is $18,249.
What is the Median Family Income in Salvisa?
Median Family Income in Salvisa is $67,167.
What is the Median Household income in Salvisa?
Median Household Income in Salvisa is $67,167.
What is Inequality or Gini Index in Salvisa?
Inequality or Gini Index in Salvisa is 0.33.
What is the Total Population of Salvisa?
Total Population of Salvisa is 258.
What is the Total Male Population of Salvisa?
Total Male Population of Salvisa is 172.
What is the Total Female Population of Salvisa?
Total Female Population of Salvisa is 86.
What is the Ratio of Males per 100 Females in Salvisa?
There are 200.00 Males per 100 Females in Salvisa.
What is the Ratio of Females per 100 Males in Salvisa?
There are 50.00 Females per 100 Males in Salvisa.
What is the Median Population Age in Salvisa?
Median Population Age in Salvisa is 29.7 Years.
What is the Average Family Size in Salvisa
Average Family Size in Salvisa is 3.6 People.
What is the Average Household Size in Salvisa
Average Household Size in Salvisa is 3.6 People.
How Large is the Labor Force in Salvisa?
There are 133 People in the Labor Forcein in Salvisa.
What is the Percentage of People in the Labor Force in Salvisa?
74.7% of People are in the Labor Force in Salvisa.
What is the Unemployment Rate in Salvisa?
Unemployment Rate in Salvisa is 20.3%.