Park City, KY Map & Demographics
Park City Map
Park City Overview
$24,918
PER CAPITA INCOME
$75,000
AVG FAMILY INCOME
$50,625
AVG HOUSEHOLD INCOME
1.4%
WAGE / INCOME GAP [ % ]
98.6¢/ $1
WAGE / INCOME GAP [ $ ]
0.39
INEQUALITY / GINI INDEX
700
TOTAL POPULATION
358
MALE POPULATION
342
FEMALE POPULATION
104.68
MALES / 100 FEMALES
95.53
FEMALES / 100 MALES
36.5
MEDIAN AGE
3.4
AVG FAMILY SIZE
2.5
AVG HOUSEHOLD SIZE
353
LABOR FORCE [ PEOPLE ]
65.0%
PERCENT IN LABOR FORCE
Park City Zip Codes
Park City Area Codes
Income in Park City
Income Overview in Park City
Per Capita Income in Park City is $24,918, while median incomes of families and households are $75,000 and $50,625 respectively.
| Characteristic | Number | Measure |
| Per Capita Income | 700 | $24,918 |
| Median Family Income | 152 | $75,000 |
| Mean Family Income | 152 | $79,519 |
| Median Household Income | 283 | $50,625 |
| Mean Household Income | 283 | $56,982 |
| Income Deficit | 152 | $0 |
| Wage / Income Gap (%) | 700 | 1.38% |
| Wage / Income Gap ($) | 700 | 98.62¢ per $1 |
| Gini / Inequality Index | 700 | 0.39 |
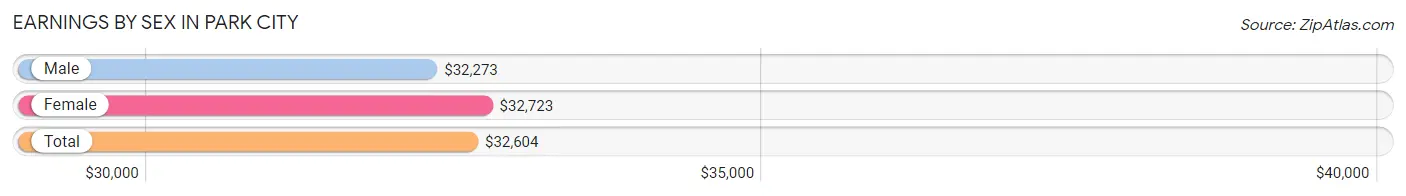
Earnings by Sex in Park City
Average Earnings in Park City are $32,604, $32,273 for men and $32,723 for women, a difference of 1.4%.
| Sex | Number | Average Earnings |
| Male | 218 (58.1%) | $32,273 |
| Female | 157 (41.9%) | $32,723 |
| Total | 375 (100.0%) | $32,604 |
Earnings by Sex by Income Bracket in Park City
The most common earnings brackets in Park City are $20,000 to $22,499 for men (66 | 30.3%) and $30,000 to $34,999 for women (33 | 21.0%).
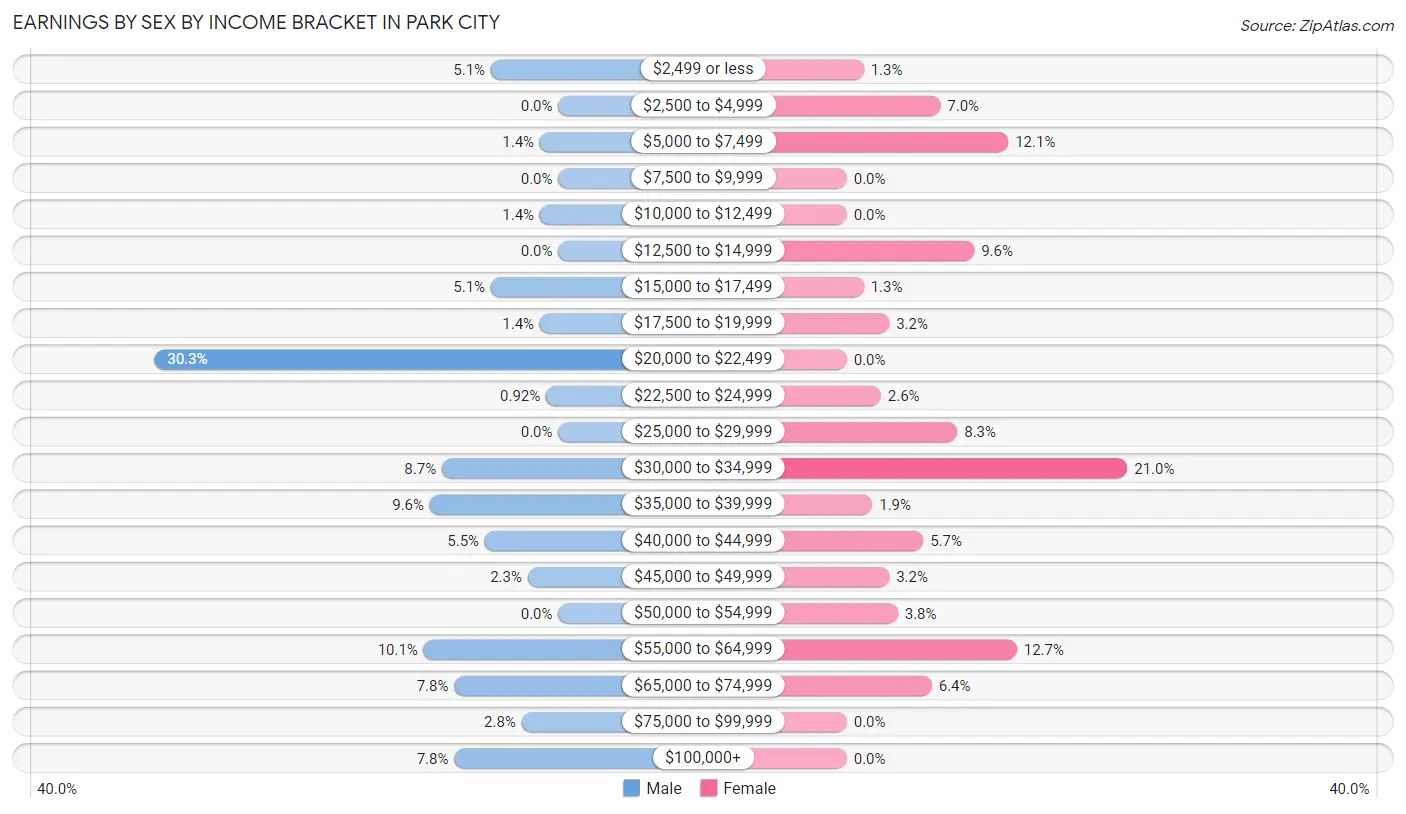
| Income | Male | Female |
| $2,499 or less | 11 (5.1%) | 2 (1.3%) |
| $2,500 to $4,999 | 0 (0.0%) | 11 (7.0%) |
| $5,000 to $7,499 | 3 (1.4%) | 19 (12.1%) |
| $7,500 to $9,999 | 0 (0.0%) | 0 (0.0%) |
| $10,000 to $12,499 | 3 (1.4%) | 0 (0.0%) |
| $12,500 to $14,999 | 0 (0.0%) | 15 (9.6%) |
| $15,000 to $17,499 | 11 (5.1%) | 2 (1.3%) |
| $17,500 to $19,999 | 3 (1.4%) | 5 (3.2%) |
| $20,000 to $22,499 | 66 (30.3%) | 0 (0.0%) |
| $22,500 to $24,999 | 2 (0.9%) | 4 (2.5%) |
| $25,000 to $29,999 | 0 (0.0%) | 13 (8.3%) |
| $30,000 to $34,999 | 19 (8.7%) | 33 (21.0%) |
| $35,000 to $39,999 | 21 (9.6%) | 3 (1.9%) |
| $40,000 to $44,999 | 12 (5.5%) | 9 (5.7%) |
| $45,000 to $49,999 | 5 (2.3%) | 5 (3.2%) |
| $50,000 to $54,999 | 0 (0.0%) | 6 (3.8%) |
| $55,000 to $64,999 | 22 (10.1%) | 20 (12.7%) |
| $65,000 to $74,999 | 17 (7.8%) | 10 (6.4%) |
| $75,000 to $99,999 | 6 (2.8%) | 0 (0.0%) |
| $100,000+ | 17 (7.8%) | 0 (0.0%) |
| Total | 218 (100.0%) | 157 (100.0%) |
Earnings by Sex by Educational Attainment in Park City
Average earnings in Park City are $34,375 for men and $33,571 for women, a difference of 2.3%. Men with an educational attainment of high school diploma enjoy the highest average annual earnings of $35,588, while those with college or associate's degree education earn the least with $22,019. Women with an educational attainment of graduate degree earn the most with the average annual earnings of $63,438, while those with college or associate's degree education have the smallest earnings of $27,639.
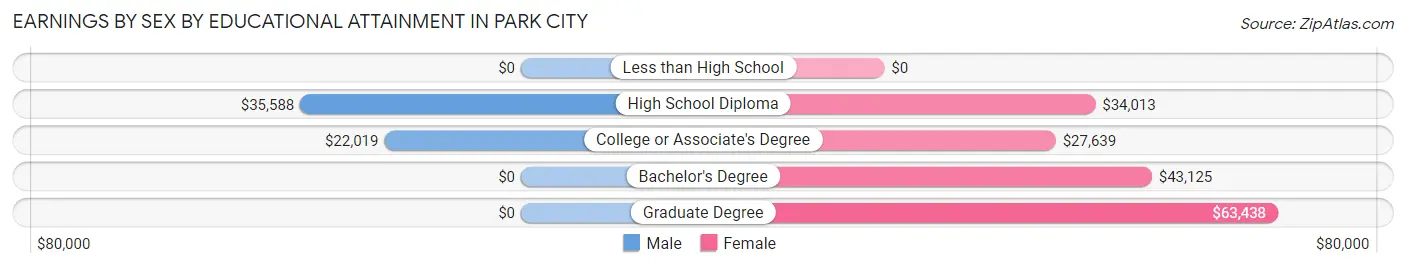
| Educational Attainment | Male Income | Female Income |
| Less than High School | - | - |
| High School Diploma | $35,588 | $34,013 |
| College or Associate's Degree | $22,019 | $27,639 |
| Bachelor's Degree | - | - |
| Graduate Degree | - | - |
| Total | $34,375 | $33,571 |
Family Income in Park City
Family Income Brackets in Park City
According to the Park City family income data, there are 50 families falling into the $50,000 to $74,999 income range, which is the most common income bracket and makes up 32.9% of all families.
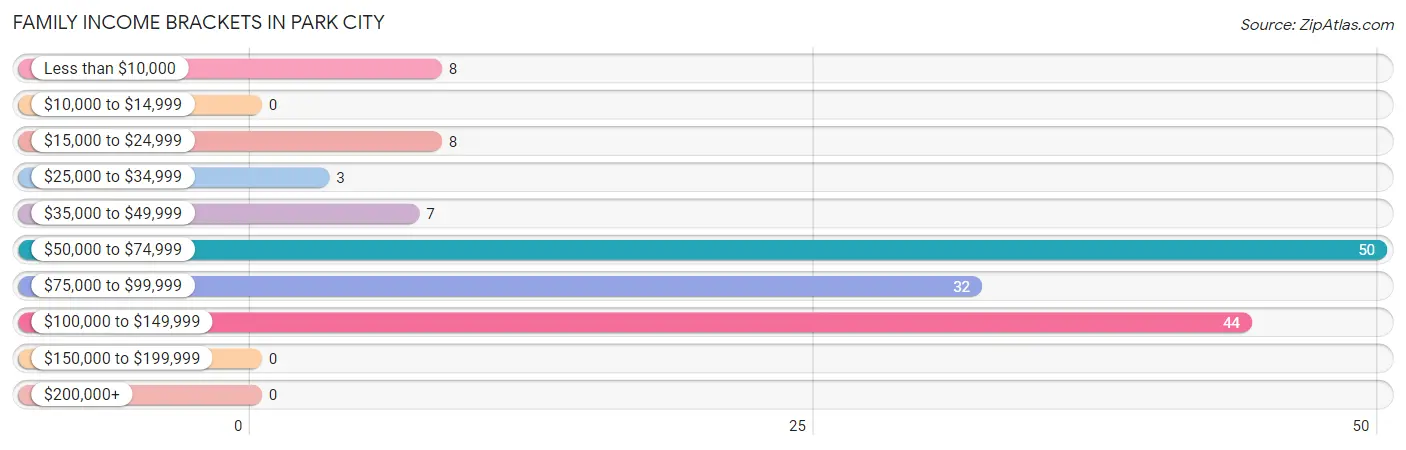
| Income Bracket | # Families | % Families |
| Less than $10,000 | 8 | 5.3% |
| $10,000 to $14,999 | 0 | 0.0% |
| $15,000 to $24,999 | 8 | 5.3% |
| $25,000 to $34,999 | 3 | 2.0% |
| $35,000 to $49,999 | 7 | 4.6% |
| $50,000 to $74,999 | 50 | 32.9% |
| $75,000 to $99,999 | 32 | 21.1% |
| $100,000 to $149,999 | 44 | 28.9% |
| $150,000 to $199,999 | 0 | 0.0% |
| $200,000+ | 0 | 0.0% |
Family Income by Famaliy Size in Park City
3-person families (44 | 28.9%) account for the highest median family income in Park City with $90,833 per family, while 2-person families (51 | 33.6%) have the highest median income of $36,597 per family member.
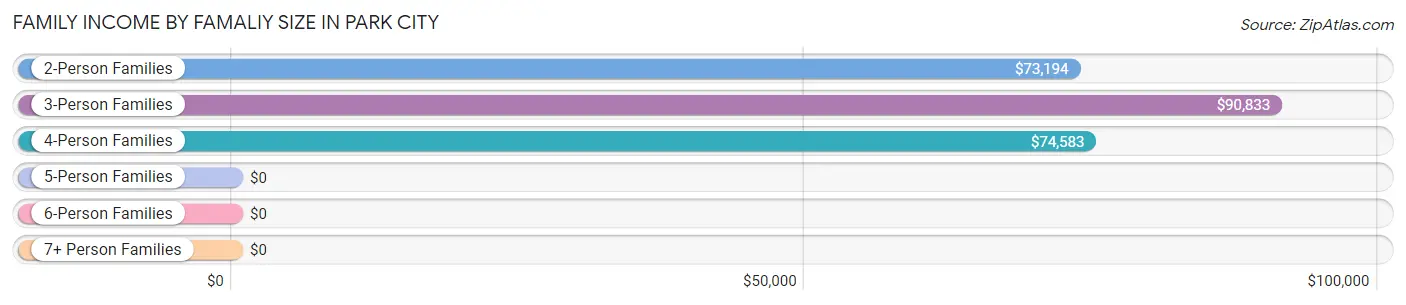
| Income Bracket | # Families | Median Income |
| 2-Person Families | 51 (33.6%) | $73,194 |
| 3-Person Families | 44 (28.9%) | $90,833 |
| 4-Person Families | 51 (33.6%) | $74,583 |
| 5-Person Families | 6 (4.0%) | $0 |
| 6-Person Families | 0 (0.0%) | $0 |
| 7+ Person Families | 0 (0.0%) | $0 |
| Total | 152 (100.0%) | $75,000 |
Family Income by Number of Earners in Park City
The median family income in Park City is $75,000, with families comprising 3+ earners (18) having the highest median family income of $91,042, while families with no earners (12) have the lowest median family income of $51,250, accounting for 11.8% and 7.9% of families, respectively.
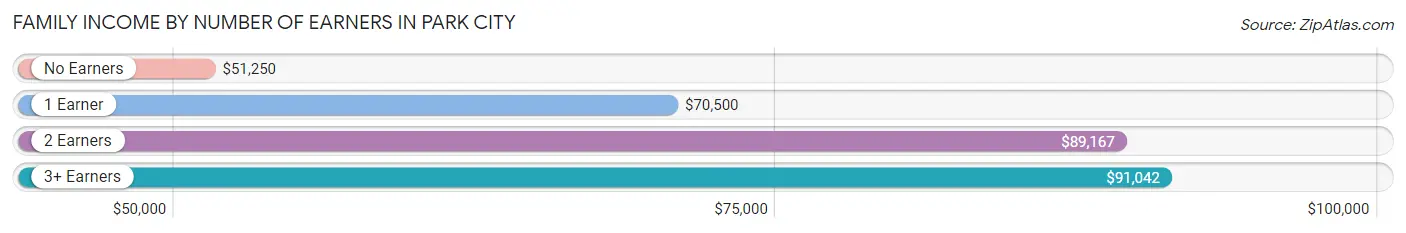
| Number of Earners | # Families | Median Income |
| No Earners | 12 (7.9%) | $51,250 |
| 1 Earner | 60 (39.5%) | $70,500 |
| 2 Earners | 62 (40.8%) | $89,167 |
| 3+ Earners | 18 (11.8%) | $91,042 |
| Total | 152 (100.0%) | $75,000 |
Household Income in Park City
Household Income Brackets in Park City
With 60 households falling in the category, the $50,000 to $74,999 income range is the most frequent in Park City, accounting for 21.2% of all households.
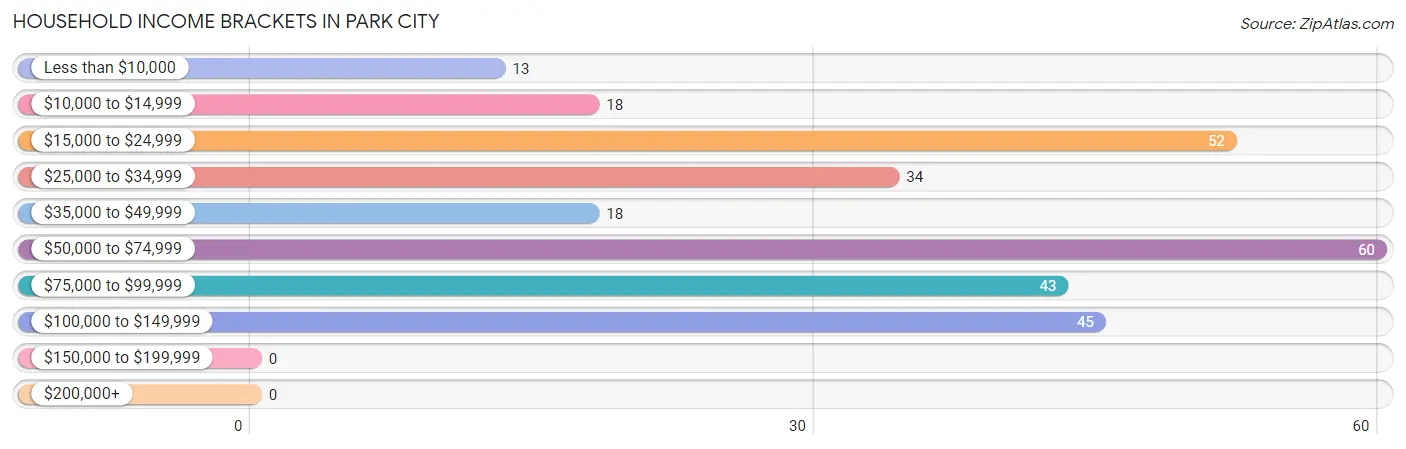
| Income Bracket | # Households | % Households |
| Less than $10,000 | 13 | 4.6% |
| $10,000 to $14,999 | 18 | 6.4% |
| $15,000 to $24,999 | 52 | 18.4% |
| $25,000 to $34,999 | 34 | 12.0% |
| $35,000 to $49,999 | 18 | 6.4% |
| $50,000 to $74,999 | 60 | 21.2% |
| $75,000 to $99,999 | 43 | 15.2% |
| $100,000 to $149,999 | 45 | 15.9% |
| $150,000 to $199,999 | 0 | 0.0% |
| $200,000+ | 0 | 0.0% |
Household Income by Householder Age in Park City
The median household income in Park City is $50,625, with the highest median household income of $79,167 found in the 45 to 64 years age bracket for the primary householder. A total of 116 households (41.0%) fall into this category. Meanwhile, the 15 to 24 years age bracket for the primary householder has the lowest median household income of $0, with 6 households (2.1%) in this group.
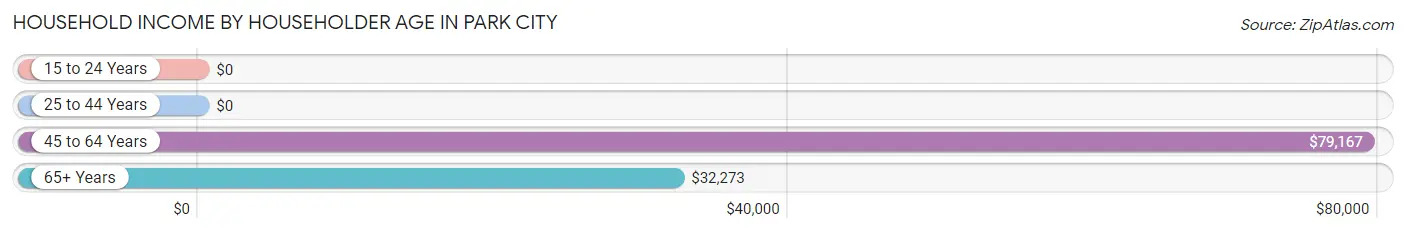
| Income Bracket | # Households | Median Income |
| 15 to 24 Years | 6 (2.1%) | $0 |
| 25 to 44 Years | 117 (41.3%) | $0 |
| 45 to 64 Years | 116 (41.0%) | $79,167 |
| 65+ Years | 44 (15.5%) | $32,273 |
| Total | 283 (100.0%) | $50,625 |
Poverty in Park City
Income Below Poverty by Sex and Age in Park City
With 8.1% poverty level for males and 16.9% for females among the residents of Park City, 5 year old males and under 5 year old females are the most vulnerable to poverty, with 8 males (100.0%) and 3 females (100.0%) in their respective age groups living below the poverty level.
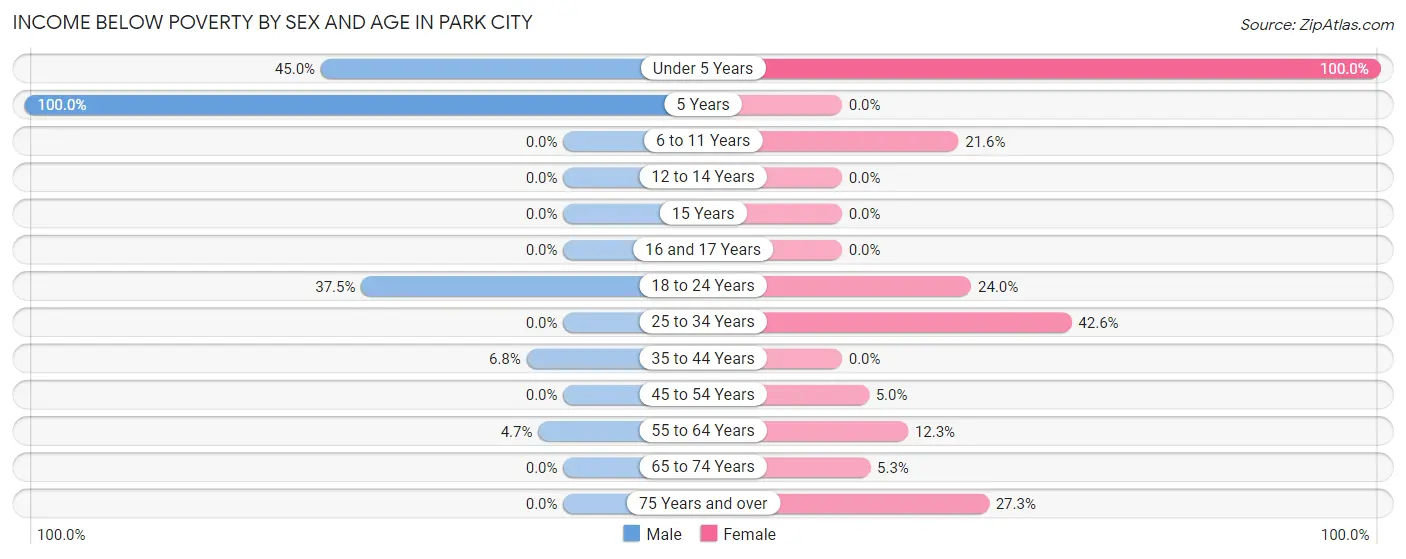
| Age Bracket | Male | Female |
| Under 5 Years | 9 (45.0%) | 3 (100.0%) |
| 5 Years | 8 (100.0%) | 0 (0.0%) |
| 6 to 11 Years | 0 (0.0%) | 8 (21.6%) |
| 12 to 14 Years | 0 (0.0%) | 0 (0.0%) |
| 15 Years | 0 (0.0%) | 0 (0.0%) |
| 16 and 17 Years | 0 (0.0%) | 0 (0.0%) |
| 18 to 24 Years | 6 (37.5%) | 6 (24.0%) |
| 25 to 34 Years | 0 (0.0%) | 26 (42.6%) |
| 35 to 44 Years | 3 (6.8%) | 0 (0.0%) |
| 45 to 54 Years | 0 (0.0%) | 3 (5.0%) |
| 55 to 64 Years | 2 (4.6%) | 7 (12.3%) |
| 65 to 74 Years | 0 (0.0%) | 1 (5.3%) |
| 75 Years and over | 0 (0.0%) | 3 (27.3%) |
| Total | 28 (8.1%) | 57 (16.9%) |
Income Above Poverty by Sex and Age in Park City
According to the poverty statistics in Park City, males aged 6 to 11 years and females aged 5 years are the age groups that are most secure financially, with 100.0% of males and 100.0% of females in these age groups living above the poverty line.
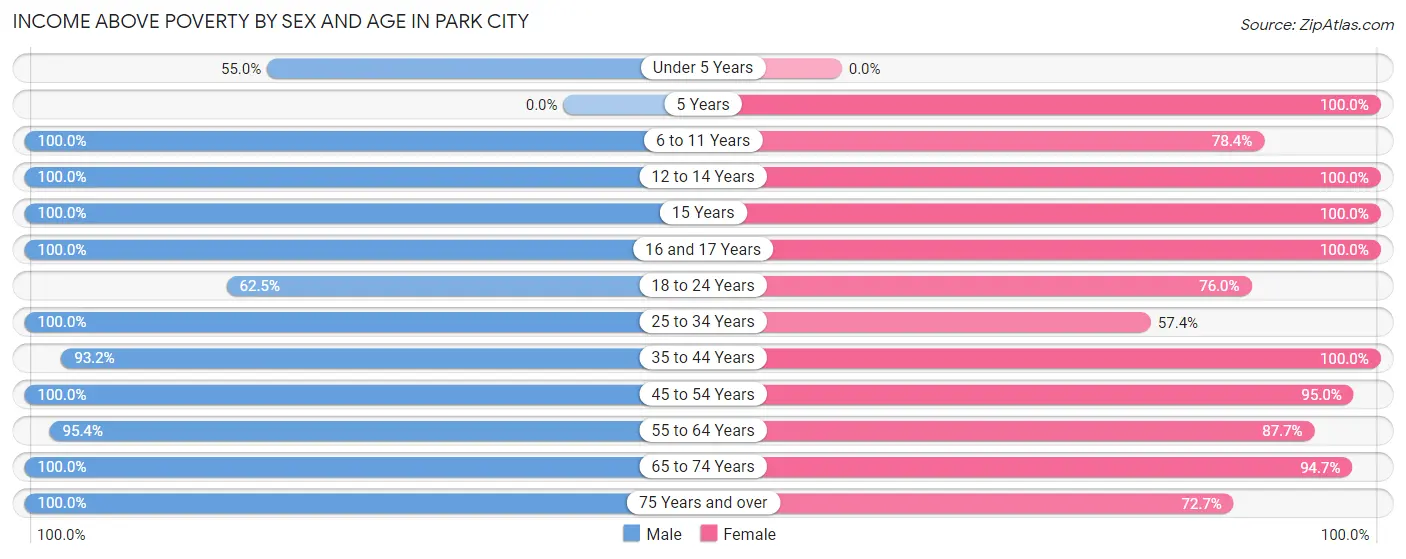
| Age Bracket | Male | Female |
| Under 5 Years | 11 (55.0%) | 0 (0.0%) |
| 5 Years | 0 (0.0%) | 10 (100.0%) |
| 6 to 11 Years | 23 (100.0%) | 29 (78.4%) |
| 12 to 14 Years | 15 (100.0%) | 14 (100.0%) |
| 15 Years | 6 (100.0%) | 5 (100.0%) |
| 16 and 17 Years | 21 (100.0%) | 6 (100.0%) |
| 18 to 24 Years | 10 (62.5%) | 19 (76.0%) |
| 25 to 34 Years | 48 (100.0%) | 35 (57.4%) |
| 35 to 44 Years | 41 (93.2%) | 29 (100.0%) |
| 45 to 54 Years | 71 (100.0%) | 57 (95.0%) |
| 55 to 64 Years | 41 (95.4%) | 50 (87.7%) |
| 65 to 74 Years | 11 (100.0%) | 18 (94.7%) |
| 75 Years and over | 21 (100.0%) | 8 (72.7%) |
| Total | 319 (91.9%) | 280 (83.1%) |
Income Below Poverty Among Married-Couple Families in Park City
The poverty statistics for married-couple families in Park City show that 2.4% or 3 of the total 127 families live below the poverty line. Families with 1 or 2 children have the highest poverty rate of 4.4%, comprising of 3 families. On the other hand, families with no children have the lowest poverty rate of 0.0%, which includes 0 families.
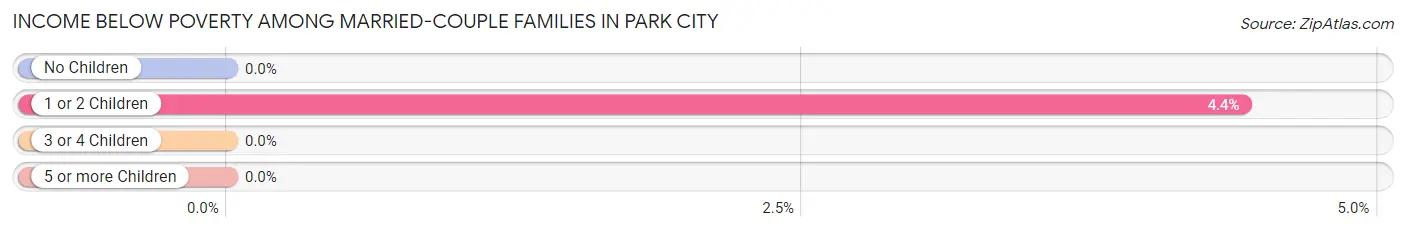
| Children | Above Poverty | Below Poverty |
| No Children | 57 (100.0%) | 0 (0.0%) |
| 1 or 2 Children | 65 (95.6%) | 3 (4.4%) |
| 3 or 4 Children | 2 (100.0%) | 0 (0.0%) |
| 5 or more Children | 0 (0.0%) | 0 (0.0%) |
| Total | 124 (97.6%) | 3 (2.4%) |
Income Below Poverty Among Single-Parent Households in Park City
According to the poverty data in Park City, 100.0% or 2 single-father households and 47.8% or 11 single-mother households are living below the poverty line. Among single-father households, those with 1 or 2 children have the highest poverty rate, with 2 households (100.0%) experiencing poverty. Likewise, among single-mother households, those with 1 or 2 children have the highest poverty rate, with 8 households (57.1%) falling below the poverty line.
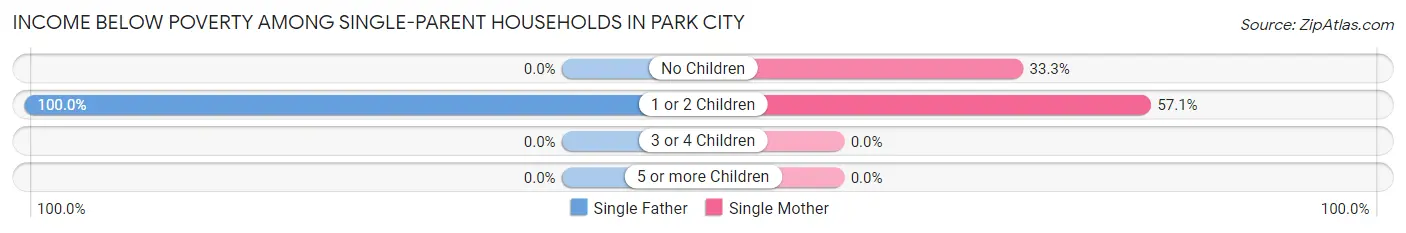
| Children | Single Father | Single Mother |
| No Children | 0 (0.0%) | 3 (33.3%) |
| 1 or 2 Children | 2 (100.0%) | 8 (57.1%) |
| 3 or 4 Children | 0 (0.0%) | 0 (0.0%) |
| 5 or more Children | 0 (0.0%) | 0 (0.0%) |
| Total | 2 (100.0%) | 11 (47.8%) |
Income Below Poverty Among Married-Couple vs Single-Parent Households in Park City
The poverty data for Park City shows that 3 of the married-couple family households (2.4%) and 13 of the single-parent households (52.0%) are living below the poverty level. Within the married-couple family households, those with 1 or 2 children have the highest poverty rate, with 3 households (4.4%) falling below the poverty line. Among the single-parent households, those with 1 or 2 children have the highest poverty rate, with 10 household (62.5%) living below poverty.
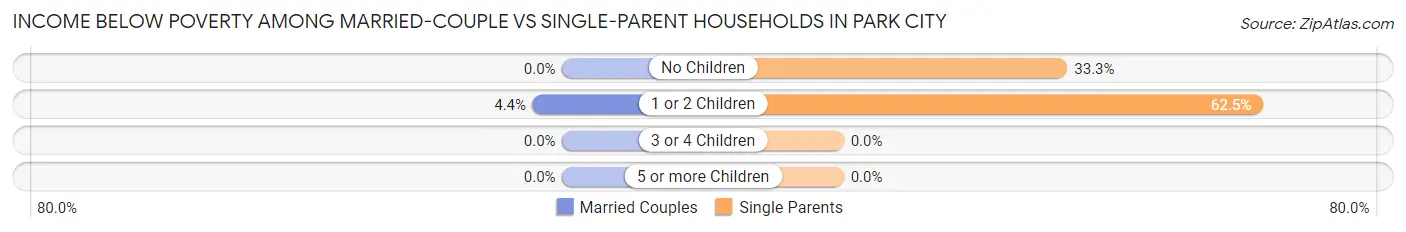
| Children | Married-Couple Families | Single-Parent Households |
| No Children | 0 (0.0%) | 3 (33.3%) |
| 1 or 2 Children | 3 (4.4%) | 10 (62.5%) |
| 3 or 4 Children | 0 (0.0%) | 0 (0.0%) |
| 5 or more Children | 0 (0.0%) | 0 (0.0%) |
| Total | 3 (2.4%) | 13 (52.0%) |
Race in Park City
The most populous races in Park City are White / Caucasian (635 | 90.7%), Two or more Races (51 | 7.3%), and Hispanic or Latino (9 | 1.3%).
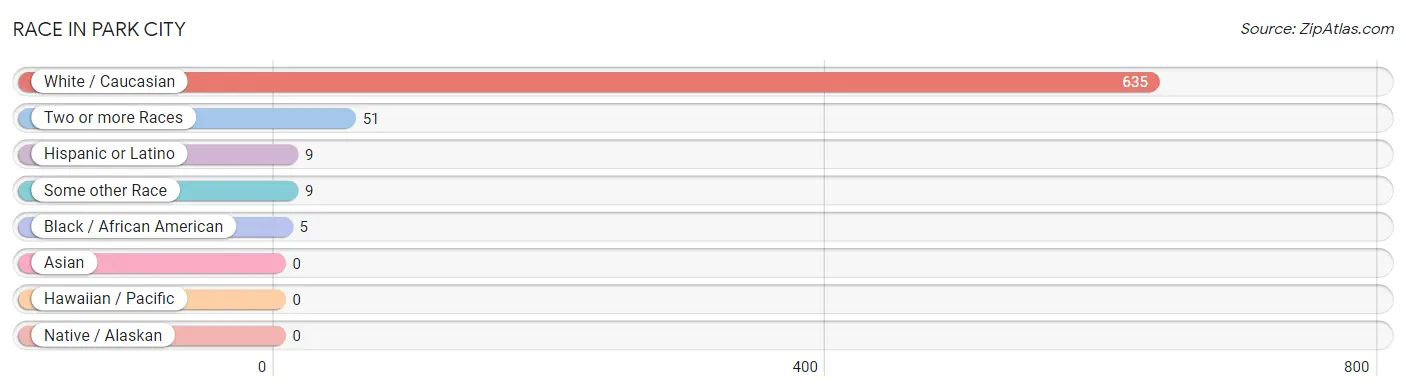
| Race | # Population | % Population |
| Asian | 0 | 0.0% |
| Black / African American | 5 | 0.7% |
| Hawaiian / Pacific | 0 | 0.0% |
| Hispanic or Latino | 9 | 1.3% |
| Native / Alaskan | 0 | 0.0% |
| White / Caucasian | 635 | 90.7% |
| Two or more Races | 51 | 7.3% |
| Some other Race | 9 | 1.3% |
| Total | 700 | 100.0% |
Ancestry in Park City
The most populous ancestries reported in Park City are American (192 | 27.4%), Irish (45 | 6.4%), English (28 | 4.0%), German (28 | 4.0%), and Italian (27 | 3.9%), together accounting for 45.7% of all Park City residents.
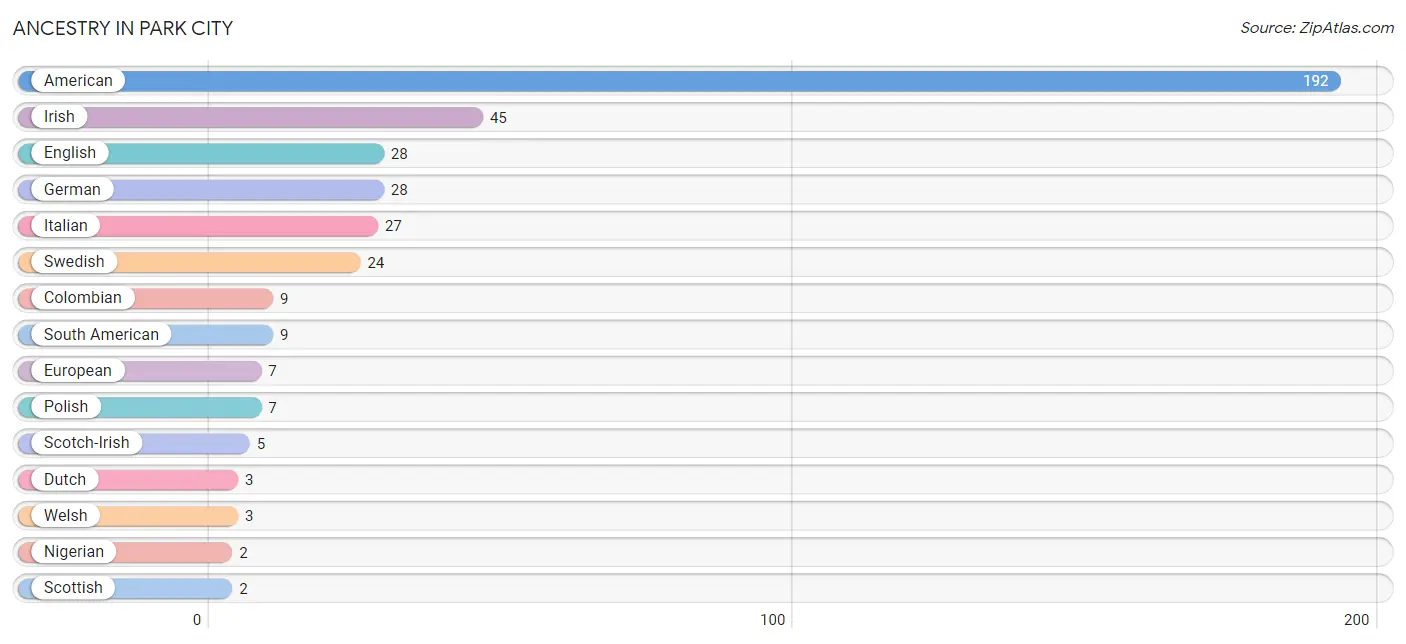
| Ancestry | # Population | % Population |
| American | 192 | 27.4% |
| Colombian | 9 | 1.3% |
| Dutch | 3 | 0.4% |
| English | 28 | 4.0% |
| European | 7 | 1.0% |
| French Canadian | 1 | 0.1% |
| German | 28 | 4.0% |
| Irish | 45 | 6.4% |
| Italian | 27 | 3.9% |
| Nigerian | 2 | 0.3% |
| Polish | 7 | 1.0% |
| Scotch-Irish | 5 | 0.7% |
| Scottish | 2 | 0.3% |
| South American | 9 | 1.3% |
| Subsaharan African | 2 | 0.3% |
| Swedish | 24 | 3.4% |
| Swiss | 1 | 0.1% |
| Welsh | 3 | 0.4% | View All 18 Rows |
Immigrants in Park City
The most numerous immigrant groups reported in Park City came from Colombia (6 | 0.9%), Latin America (6 | 0.9%), South America (6 | 0.9%), Africa (2 | 0.3%), and Nigeria (2 | 0.3%), together accounting for 3.2% of all Park City residents.
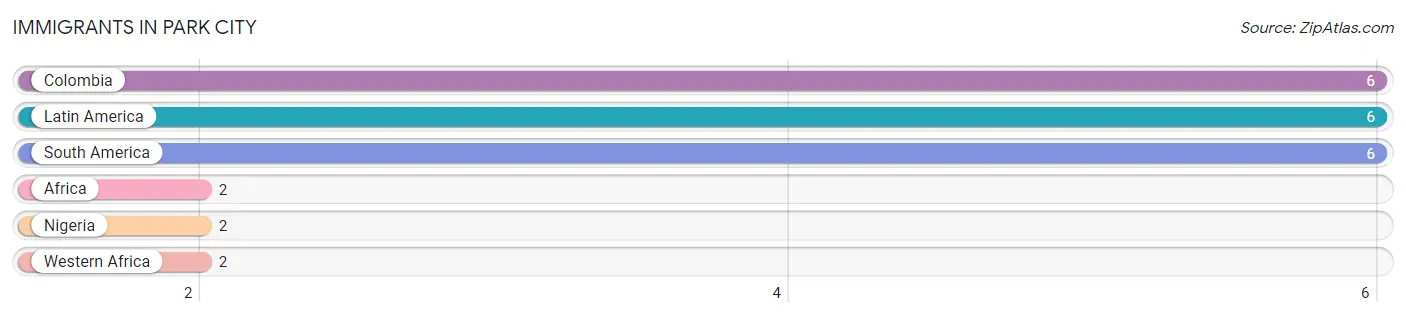
| Immigration Origin | # Population | % Population |
| Africa | 2 | 0.3% |
| Colombia | 6 | 0.9% |
| Latin America | 6 | 0.9% |
| Nigeria | 2 | 0.3% |
| South America | 6 | 0.9% |
| Western Africa | 2 | 0.3% | View All 6 Rows |
Sex and Age in Park City
Sex and Age in Park City
The most populous age groups in Park City are 45 to 49 Years (47 | 13.1%) for men and 55 to 59 Years (44 | 12.9%) for women.
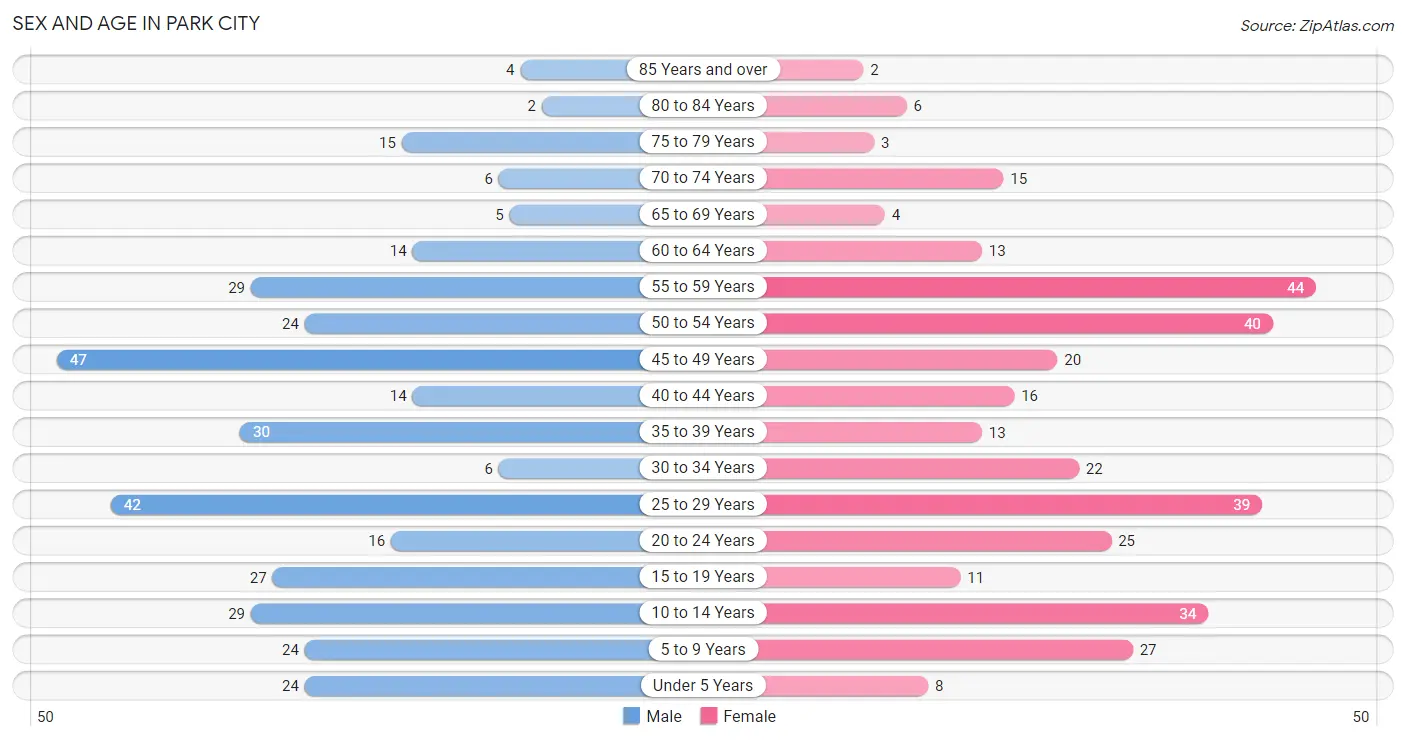
| Age Bracket | Male | Female |
| Under 5 Years | 24 (6.7%) | 8 (2.3%) |
| 5 to 9 Years | 24 (6.7%) | 27 (7.9%) |
| 10 to 14 Years | 29 (8.1%) | 34 (9.9%) |
| 15 to 19 Years | 27 (7.5%) | 11 (3.2%) |
| 20 to 24 Years | 16 (4.5%) | 25 (7.3%) |
| 25 to 29 Years | 42 (11.7%) | 39 (11.4%) |
| 30 to 34 Years | 6 (1.7%) | 22 (6.4%) |
| 35 to 39 Years | 30 (8.4%) | 13 (3.8%) |
| 40 to 44 Years | 14 (3.9%) | 16 (4.7%) |
| 45 to 49 Years | 47 (13.1%) | 20 (5.9%) |
| 50 to 54 Years | 24 (6.7%) | 40 (11.7%) |
| 55 to 59 Years | 29 (8.1%) | 44 (12.9%) |
| 60 to 64 Years | 14 (3.9%) | 13 (3.8%) |
| 65 to 69 Years | 5 (1.4%) | 4 (1.2%) |
| 70 to 74 Years | 6 (1.7%) | 15 (4.4%) |
| 75 to 79 Years | 15 (4.2%) | 3 (0.9%) |
| 80 to 84 Years | 2 (0.6%) | 6 (1.8%) |
| 85 Years and over | 4 (1.1%) | 2 (0.6%) |
| Total | 358 (100.0%) | 342 (100.0%) |
Families and Households in Park City
Median Family Size in Park City
The median family size in Park City is 3.36 persons per family, with single male/father families (2 | 1.3%) accounting for the largest median family size of 5 persons per family. On the other hand, single female/mother families (23 | 15.1%) represent the smallest median family size with 2.52 persons per family.
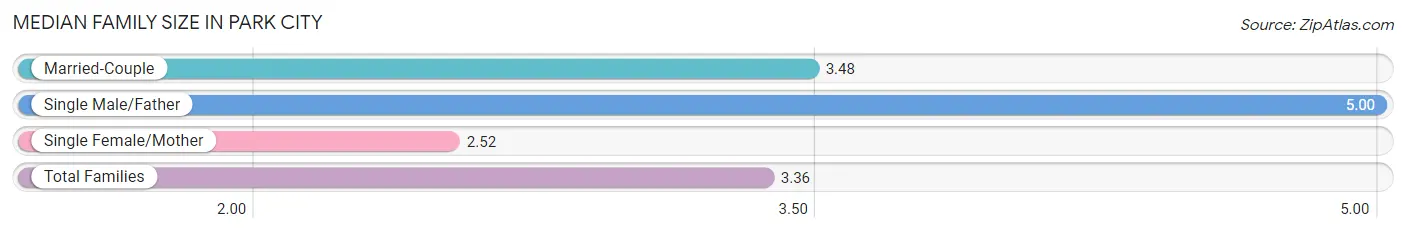
| Family Type | # Families | Family Size |
| Married-Couple | 127 (83.6%) | 3.48 |
| Single Male/Father | 2 (1.3%) | 5.00 |
| Single Female/Mother | 23 (15.1%) | 2.52 |
| Total Families | 152 (100.0%) | 3.36 |
Median Household Size in Park City
The median household size in Park City is 2.47 persons per household, with single male/father households (2 | 0.7%) accounting for the largest median household size of 7 persons per household. non-family households (131 | 46.3%) represent the smallest median household size with 1.16 persons per household.
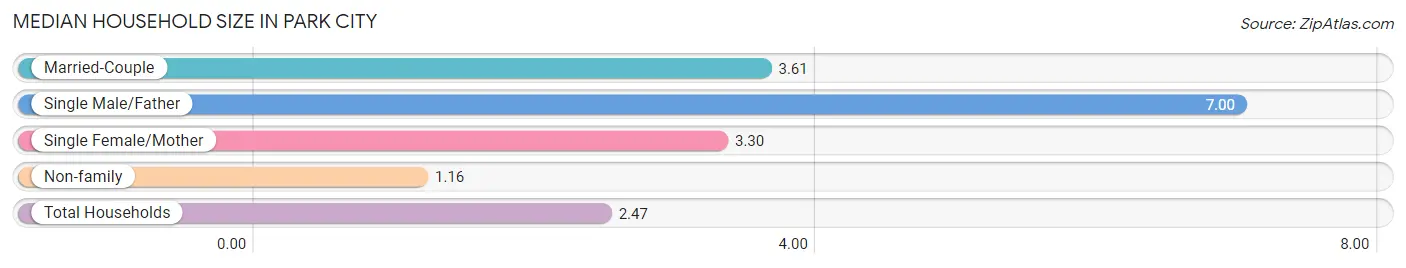
| Household Type | # Households | Household Size |
| Married-Couple | 127 (44.9%) | 3.61 |
| Single Male/Father | 2 (0.7%) | 7.00 |
| Single Female/Mother | 23 (8.1%) | 3.30 |
| Non-family | 131 (46.3%) | 1.16 |
| Total Households | 283 (100.0%) | 2.47 |
Household Size by Marriage Status in Park City
Out of a total of 283 households in Park City, 152 (53.7%) are family households, while 131 (46.3%) are nonfamily households. The most numerous type of family households are 4-person households, comprising 51, and the most common type of nonfamily households are 1-person households, comprising 112.
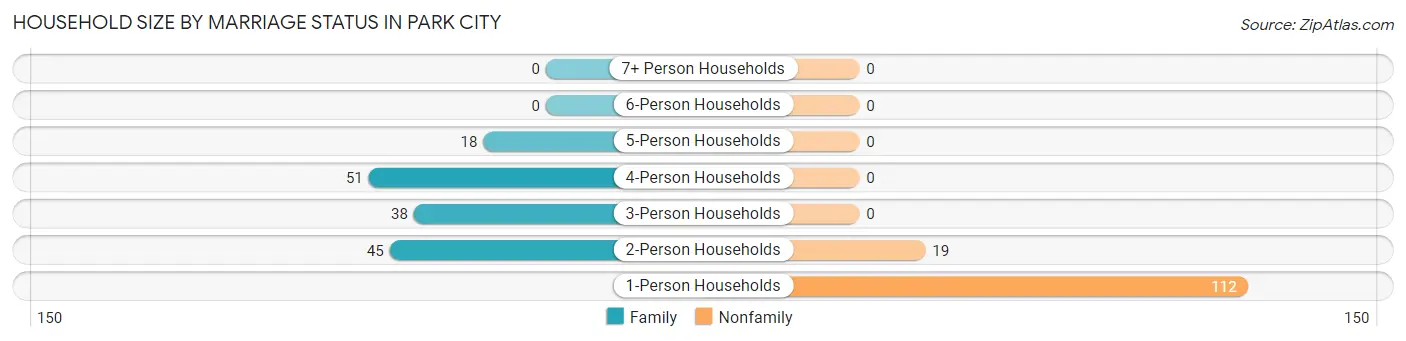
| Household Size | Family Households | Nonfamily Households |
| 1-Person Households | - | 112 (39.6%) |
| 2-Person Households | 45 (15.9%) | 19 (6.7%) |
| 3-Person Households | 38 (13.4%) | 0 (0.0%) |
| 4-Person Households | 51 (18.0%) | 0 (0.0%) |
| 5-Person Households | 18 (6.4%) | 0 (0.0%) |
| 6-Person Households | 0 (0.0%) | 0 (0.0%) |
| 7+ Person Households | 0 (0.0%) | 0 (0.0%) |
| Total | 152 (53.7%) | 131 (46.3%) |
Female Fertility in Park City
Fertility by Age in Park City
Average fertility rate in Park City is 12.0 births per 1,000 women. Women in the age bracket of 20 to 34 years have the highest fertility rate with 23.0 births per 1,000 women. Women in the age bracket of 20 to 34 years acount for 100.0% of all women with births.
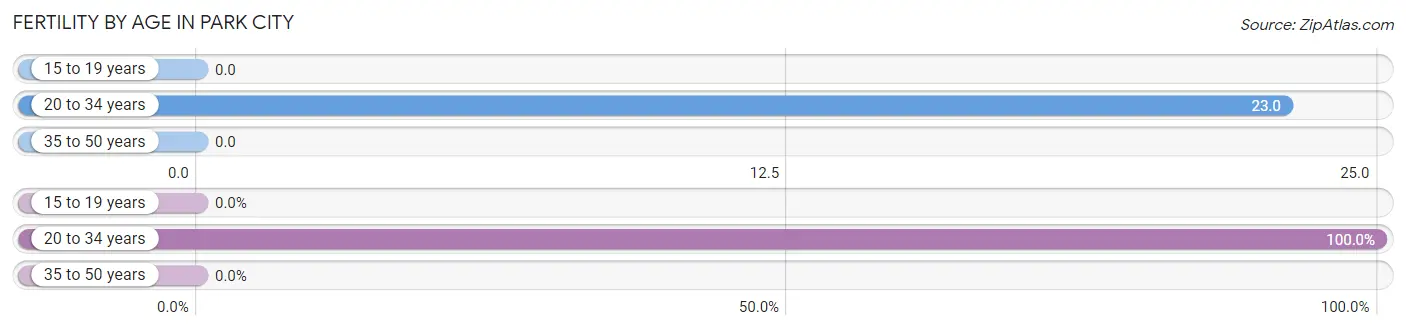
| Age Bracket | Women with Births | Births / 1,000 Women |
| 15 to 19 years | 0 (0.0%) | 0.0 |
| 20 to 34 years | 2 (100.0%) | 23.0 |
| 35 to 50 years | 0 (0.0%) | 0.0 |
| Total | 2 (100.0%) | 12.0 |
Fertility by Age by Marriage Status in Park City
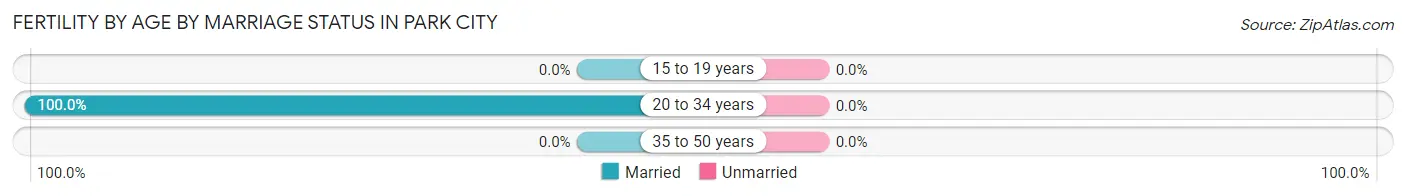
| Age Bracket | Married | Unmarried |
| 15 to 19 years | 0 (0.0%) | 0 (0.0%) |
| 20 to 34 years | 2 (100.0%) | 0 (0.0%) |
| 35 to 50 years | 0 (0.0%) | 0 (0.0%) |
| Total | 2 (100.0%) | 0 (0.0%) |
Fertility by Education in Park City
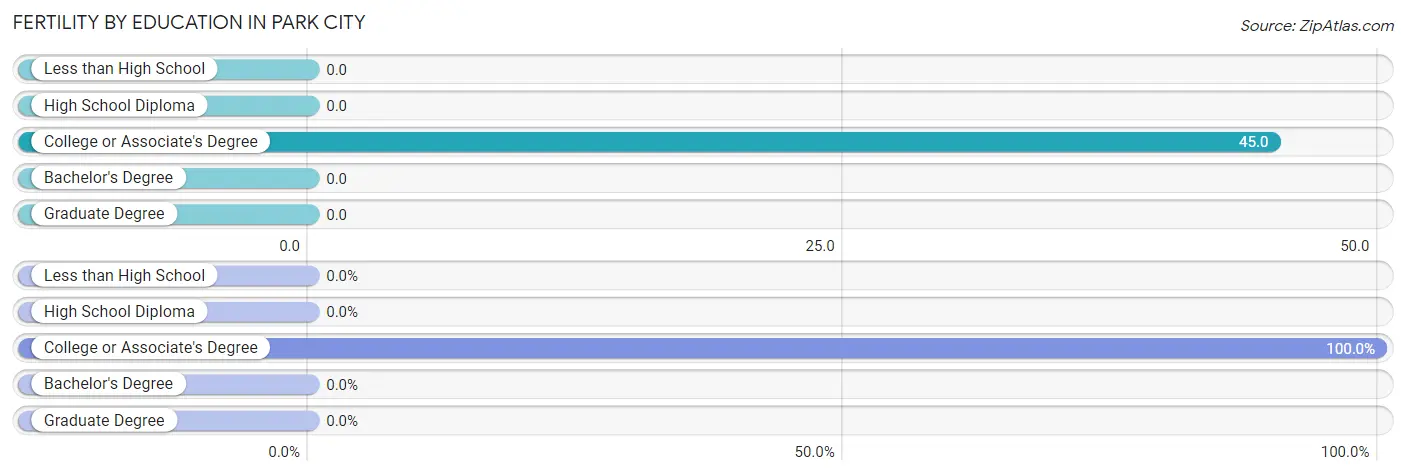
| Educational Attainment | Women with Births | Births / 1,000 Women |
| Less than High School | 0 (0.0%) | 0.0 |
| High School Diploma | 0 (0.0%) | 0.0 |
| College or Associate's Degree | 2 (100.0%) | 45.0 |
| Bachelor's Degree | 0 (0.0%) | 0.0 |
| Graduate Degree | 0 (0.0%) | 0.0 |
| Total | 2 (100.0%) | 12.0 |
Fertility by Education by Marriage Status in Park City
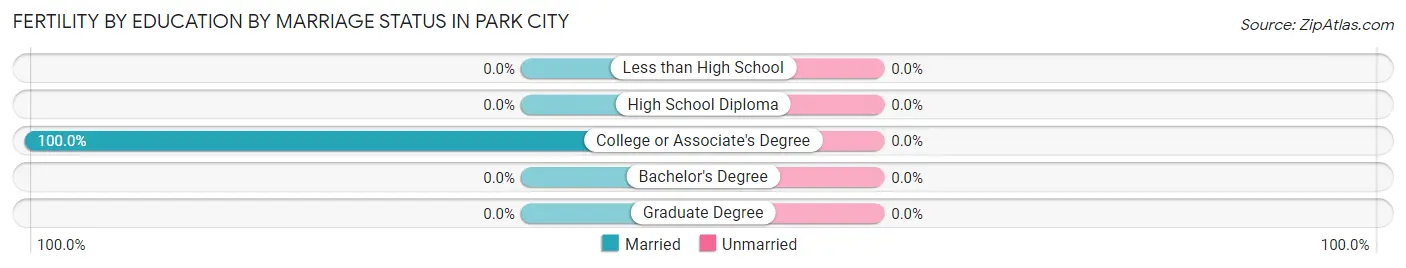
| Educational Attainment | Married | Unmarried |
| Less than High School | 0 (0.0%) | 0 (0.0%) |
| High School Diploma | 0 (0.0%) | 0 (0.0%) |
| College or Associate's Degree | 2 (100.0%) | 0 (0.0%) |
| Bachelor's Degree | 0 (0.0%) | 0 (0.0%) |
| Graduate Degree | 0 (0.0%) | 0 (0.0%) |
| Total | 2 (100.0%) | 0 (0.0%) |
Employment Characteristics in Park City
Employment by Class of Employer in Park City
Among the 333 employed individuals in Park City, private company employees (272 | 81.7%), not-for-profit organizations (22 | 6.6%), and local government employees (22 | 6.6%) make up the most common classes of employment.
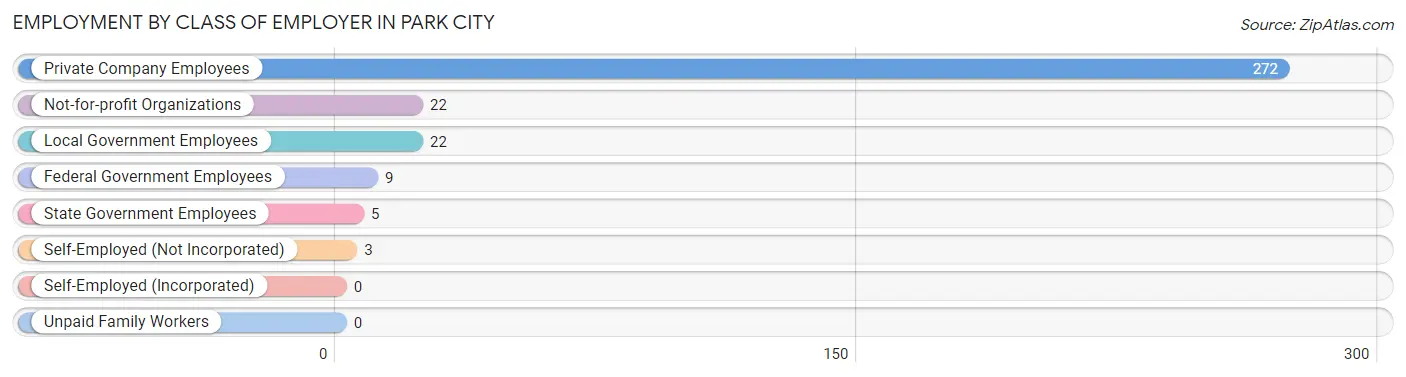
| Employer Class | # Employees | % Employees |
| Private Company Employees | 272 | 81.7% |
| Self-Employed (Incorporated) | 0 | 0.0% |
| Self-Employed (Not Incorporated) | 3 | 0.9% |
| Not-for-profit Organizations | 22 | 6.6% |
| Local Government Employees | 22 | 6.6% |
| State Government Employees | 5 | 1.5% |
| Federal Government Employees | 9 | 2.7% |
| Unpaid Family Workers | 0 | 0.0% |
| Total | 333 | 100.0% |
Employment Status by Age in Park City
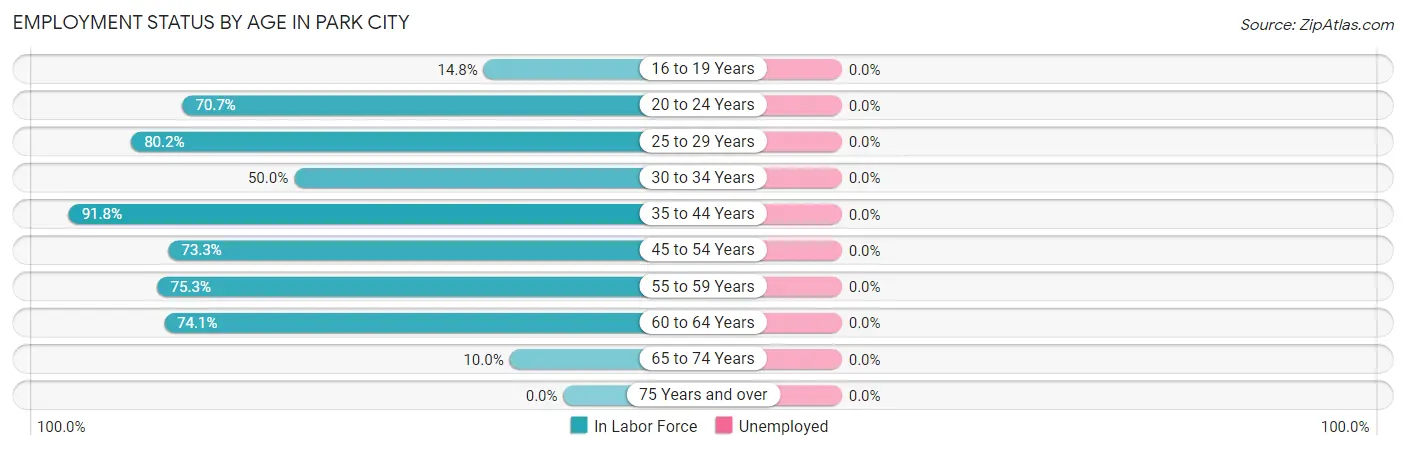
| Age Bracket | In Labor Force | Unemployed |
| 16 to 19 Years | 4 (14.8%) | 0 (0.0%) |
| 20 to 24 Years | 29 (70.7%) | 0 (0.0%) |
| 25 to 29 Years | 65 (80.2%) | 0 (0.0%) |
| 30 to 34 Years | 14 (50.0%) | 0 (0.0%) |
| 35 to 44 Years | 67 (91.8%) | 0 (0.0%) |
| 45 to 54 Years | 96 (73.3%) | 0 (0.0%) |
| 55 to 59 Years | 55 (75.3%) | 0 (0.0%) |
| 60 to 64 Years | 20 (74.1%) | 0 (0.0%) |
| 65 to 74 Years | 3 (10.0%) | 0 (0.0%) |
| 75 Years and over | 0 (0.0%) | 0 (0.0%) |
| Total | 353 (65.0%) | 0 (0.0%) |
Employment Status by Educational Attainment in Park City
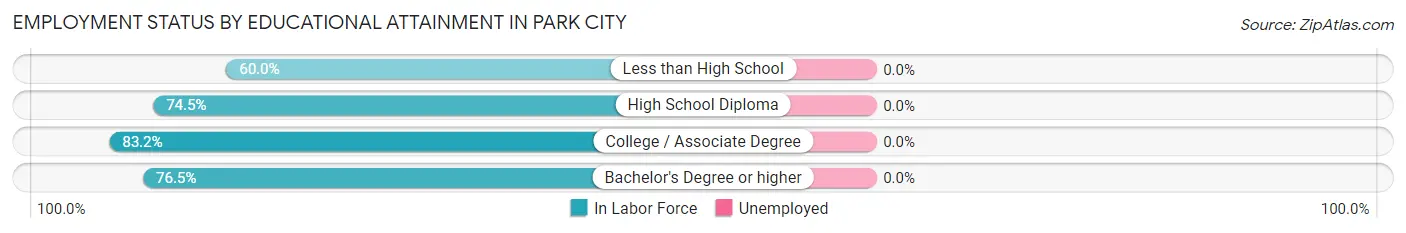
| Educational Attainment | In Labor Force | Unemployed |
| Less than High School | 6 (60.0%) | 0 (0.0%) |
| High School Diploma | 178 (74.5%) | 0 (0.0%) |
| College / Associate Degree | 94 (83.2%) | 0 (0.0%) |
| Bachelor's Degree or higher | 39 (76.5%) | 0 (0.0%) |
| Total | 317 (76.8%) | 0 (0.0%) |
Employment Occupations by Sex in Park City
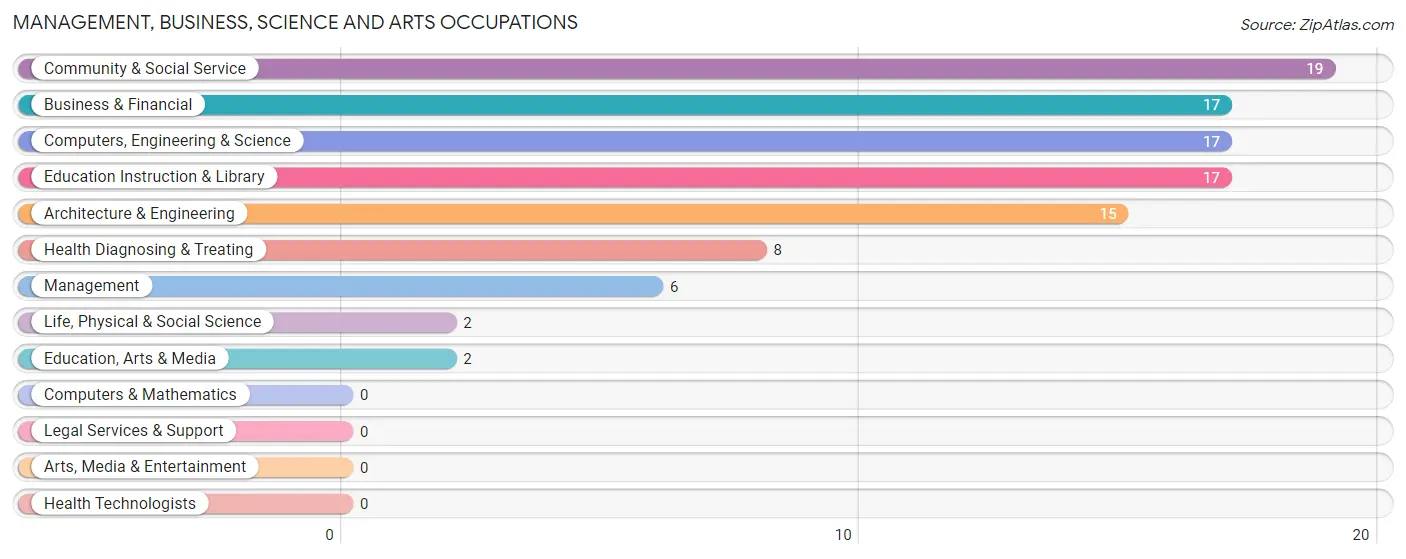
Management, Business, Science and Arts Occupations
The most common Management, Business, Science and Arts occupations in Park City are Community & Social Service (19 | 5.4%), Business & Financial (17 | 4.8%), Computers, Engineering & Science (17 | 4.8%), Education Instruction & Library (17 | 4.8%), and Architecture & Engineering (15 | 4.3%).
Management, Business, Science and Arts Occupations by Sex
Within the Management, Business, Science and Arts occupations in Park City, the most male-oriented occupations are Computers, Engineering & Science (100.0%), Architecture & Engineering (100.0%), and Life, Physical & Social Science (100.0%), while the most female-oriented occupations are Business & Financial (100.0%), Education Instruction & Library (100.0%), and Health Diagnosing & Treating (100.0%).
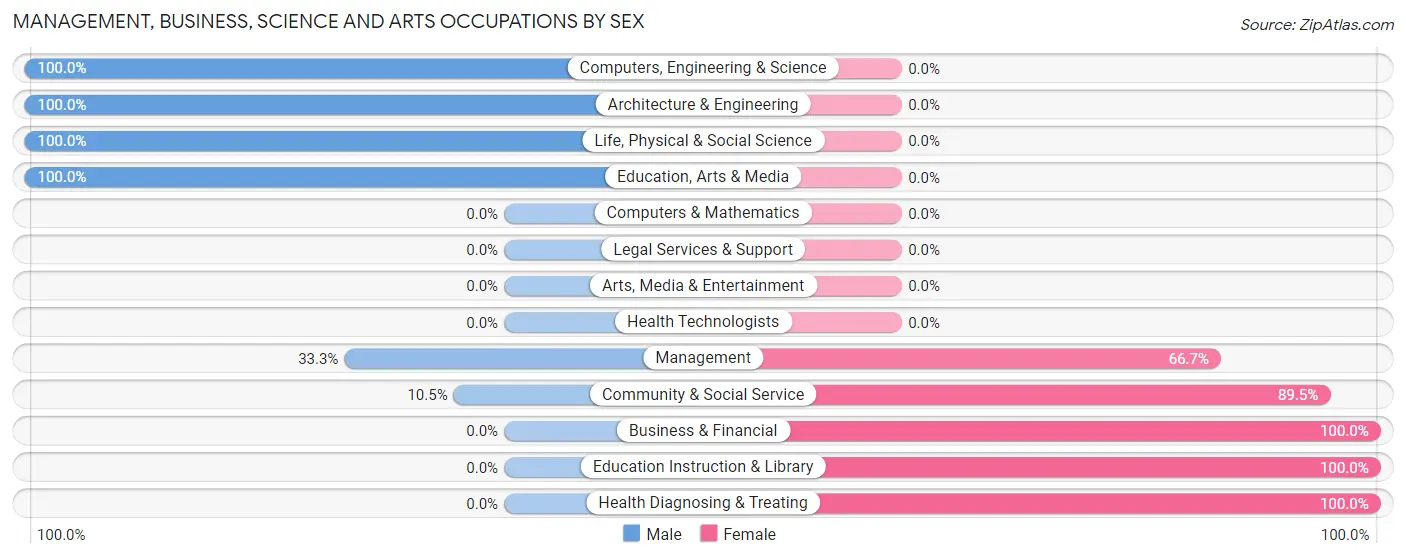
| Occupation | Male | Female |
| Management | 2 (33.3%) | 4 (66.7%) |
| Business & Financial | 0 (0.0%) | 17 (100.0%) |
| Computers, Engineering & Science | 17 (100.0%) | 0 (0.0%) |
| Computers & Mathematics | 0 (0.0%) | 0 (0.0%) |
| Architecture & Engineering | 15 (100.0%) | 0 (0.0%) |
| Life, Physical & Social Science | 2 (100.0%) | 0 (0.0%) |
| Community & Social Service | 2 (10.5%) | 17 (89.5%) |
| Education, Arts & Media | 2 (100.0%) | 0 (0.0%) |
| Legal Services & Support | 0 (0.0%) | 0 (0.0%) |
| Education Instruction & Library | 0 (0.0%) | 17 (100.0%) |
| Arts, Media & Entertainment | 0 (0.0%) | 0 (0.0%) |
| Health Diagnosing & Treating | 0 (0.0%) | 8 (100.0%) |
| Health Technologists | 0 (0.0%) | 0 (0.0%) |
| Total (Category) | 21 (31.3%) | 46 (68.7%) |
| Total (Overall) | 198 (56.1%) | 155 (43.9%) |
Services Occupations
The most common Services occupations in Park City are Food Preparation & Serving (38 | 10.8%), Healthcare Support (17 | 4.8%), Personal Care & Service (16 | 4.5%), Cleaning & Maintenance (12 | 3.4%), and Security & Protection (3 | 0.9%).
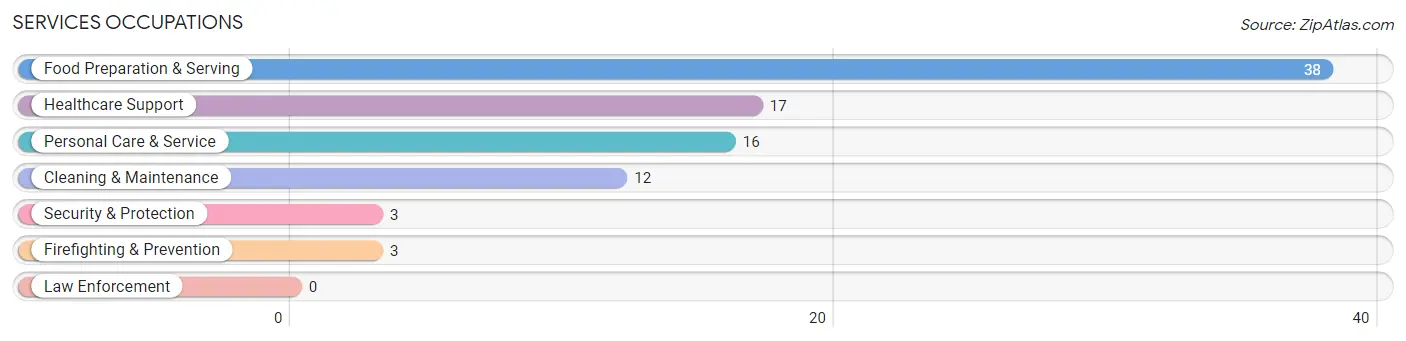
Services Occupations by Sex
Within the Services occupations in Park City, the most male-oriented occupations are Food Preparation & Serving (100.0%), Cleaning & Maintenance (100.0%), and Personal Care & Service (25.0%), while the most female-oriented occupations are Healthcare Support (100.0%), Security & Protection (100.0%), and Firefighting & Prevention (100.0%).
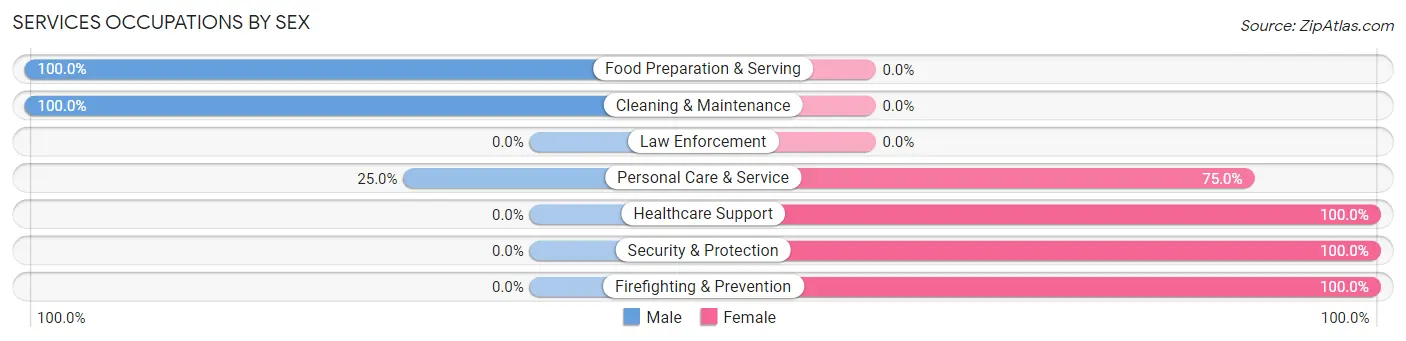
| Occupation | Male | Female |
| Healthcare Support | 0 (0.0%) | 17 (100.0%) |
| Security & Protection | 0 (0.0%) | 3 (100.0%) |
| Firefighting & Prevention | 0 (0.0%) | 3 (100.0%) |
| Law Enforcement | 0 (0.0%) | 0 (0.0%) |
| Food Preparation & Serving | 38 (100.0%) | 0 (0.0%) |
| Cleaning & Maintenance | 12 (100.0%) | 0 (0.0%) |
| Personal Care & Service | 4 (25.0%) | 12 (75.0%) |
| Total (Category) | 54 (62.8%) | 32 (37.2%) |
| Total (Overall) | 198 (56.1%) | 155 (43.9%) |
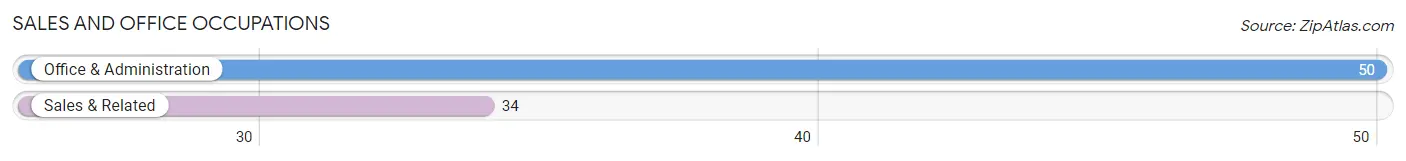
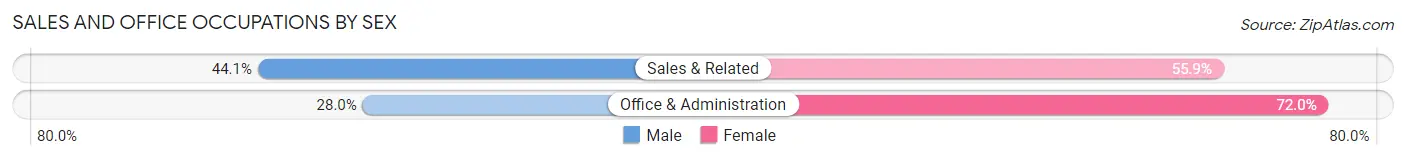
Sales and Office Occupations
The most common Sales and Office occupations in Park City are Office & Administration (50 | 14.2%), and Sales & Related (34 | 9.6%).
Sales and Office Occupations by Sex
| Occupation | Male | Female |
| Sales & Related | 15 (44.1%) | 19 (55.9%) |
| Office & Administration | 14 (28.0%) | 36 (72.0%) |
| Total (Category) | 29 (34.5%) | 55 (65.5%) |
| Total (Overall) | 198 (56.1%) | 155 (43.9%) |
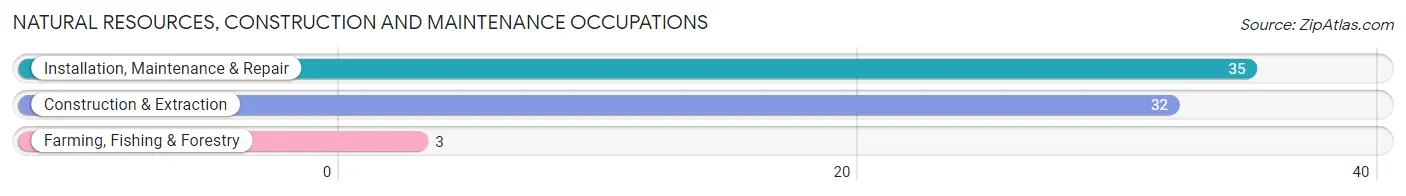
Natural Resources, Construction and Maintenance Occupations
The most common Natural Resources, Construction and Maintenance occupations in Park City are Installation, Maintenance & Repair (35 | 9.9%), Construction & Extraction (32 | 9.1%), and Farming, Fishing & Forestry (3 | 0.9%).
Natural Resources, Construction and Maintenance Occupations by Sex
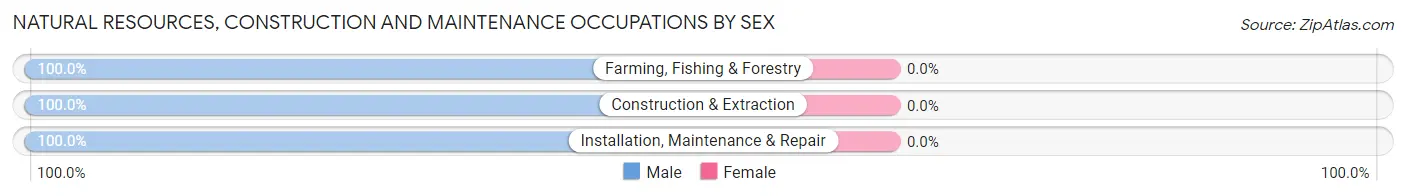
| Occupation | Male | Female |
| Farming, Fishing & Forestry | 3 (100.0%) | 0 (0.0%) |
| Construction & Extraction | 32 (100.0%) | 0 (0.0%) |
| Installation, Maintenance & Repair | 35 (100.0%) | 0 (0.0%) |
| Total (Category) | 70 (100.0%) | 0 (0.0%) |
| Total (Overall) | 198 (56.1%) | 155 (43.9%) |
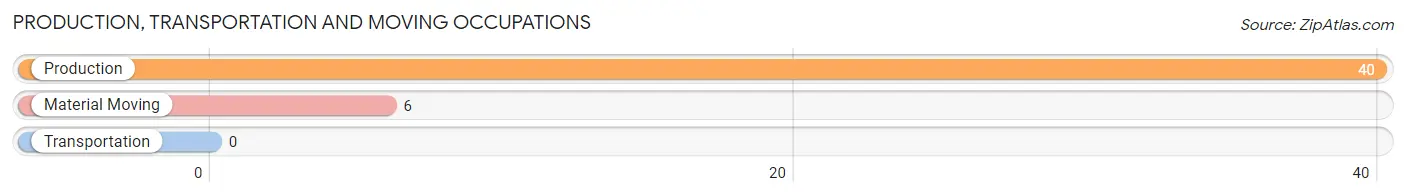
Production, Transportation and Moving Occupations
The most common Production, Transportation and Moving occupations in Park City are Production (40 | 11.3%), and Material Moving (6 | 1.7%).
Production, Transportation and Moving Occupations by Sex
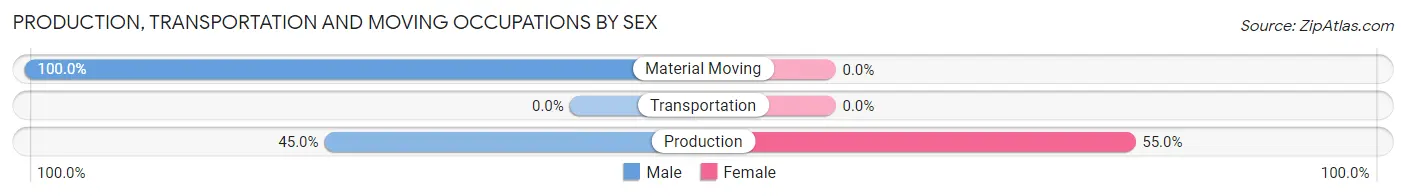
| Occupation | Male | Female |
| Production | 18 (45.0%) | 22 (55.0%) |
| Transportation | 0 (0.0%) | 0 (0.0%) |
| Material Moving | 6 (100.0%) | 0 (0.0%) |
| Total (Category) | 24 (52.2%) | 22 (47.8%) |
| Total (Overall) | 198 (56.1%) | 155 (43.9%) |
Employment Industries by Sex in Park City
Employment Industries in Park City
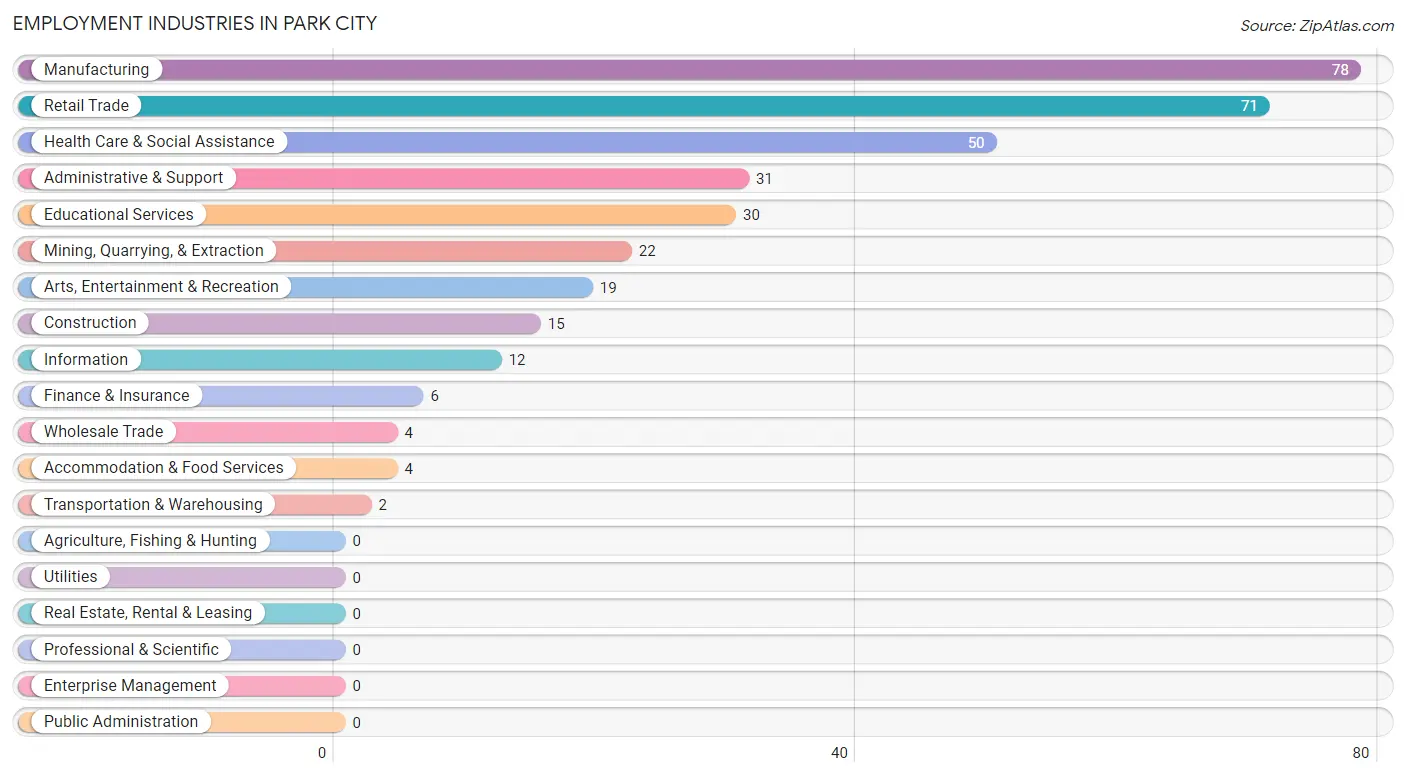
The major employment industries in Park City include Manufacturing (78 | 22.1%), Retail Trade (71 | 20.1%), Health Care & Social Assistance (50 | 14.2%), Administrative & Support (31 | 8.8%), and Educational Services (30 | 8.5%).
Employment Industries by Sex in Park City
The Park City industries that see more men than women are Construction (100.0%), Information (100.0%), and Retail Trade (80.3%), whereas the industries that tend to have a higher number of women are Wholesale Trade (100.0%), Transportation & Warehousing (100.0%), and Finance & Insurance (100.0%).
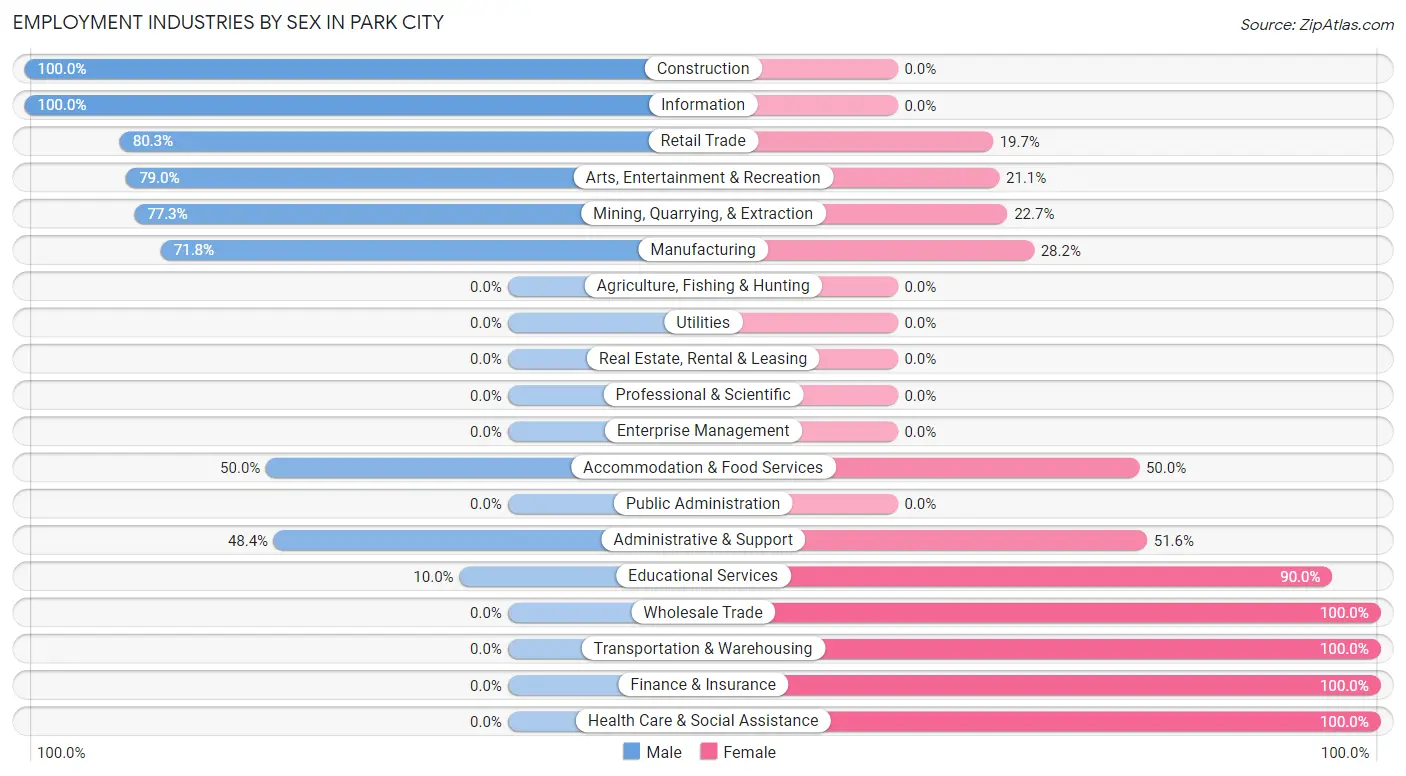
| Industry | Male | Female |
| Agriculture, Fishing & Hunting | 0 (0.0%) | 0 (0.0%) |
| Mining, Quarrying, & Extraction | 17 (77.3%) | 5 (22.7%) |
| Construction | 15 (100.0%) | 0 (0.0%) |
| Manufacturing | 56 (71.8%) | 22 (28.2%) |
| Wholesale Trade | 0 (0.0%) | 4 (100.0%) |
| Retail Trade | 57 (80.3%) | 14 (19.7%) |
| Transportation & Warehousing | 0 (0.0%) | 2 (100.0%) |
| Utilities | 0 (0.0%) | 0 (0.0%) |
| Information | 12 (100.0%) | 0 (0.0%) |
| Finance & Insurance | 0 (0.0%) | 6 (100.0%) |
| Real Estate, Rental & Leasing | 0 (0.0%) | 0 (0.0%) |
| Professional & Scientific | 0 (0.0%) | 0 (0.0%) |
| Enterprise Management | 0 (0.0%) | 0 (0.0%) |
| Administrative & Support | 15 (48.4%) | 16 (51.6%) |
| Educational Services | 3 (10.0%) | 27 (90.0%) |
| Health Care & Social Assistance | 0 (0.0%) | 50 (100.0%) |
| Arts, Entertainment & Recreation | 15 (78.9%) | 4 (21.0%) |
| Accommodation & Food Services | 2 (50.0%) | 2 (50.0%) |
| Public Administration | 0 (0.0%) | 0 (0.0%) |
| Total | 198 (56.1%) | 155 (43.9%) |
Education in Park City
School Enrollment in Park City
The most common levels of schooling among the 167 students in Park City are elementary school (56 | 33.5%), high school (40 | 23.9%), and middle school (33 | 19.8%).
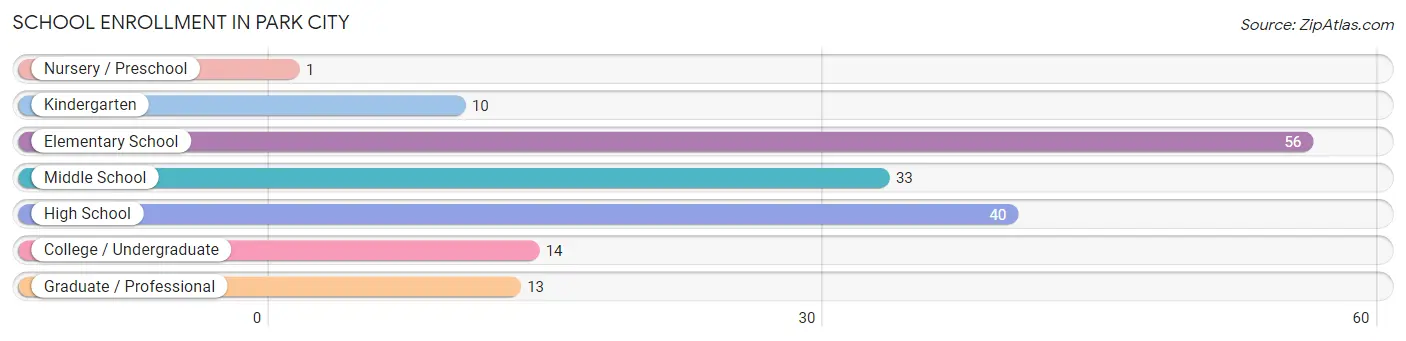
| School Level | # Students | % Students |
| Nursery / Preschool | 1 | 0.6% |
| Kindergarten | 10 | 6.0% |
| Elementary School | 56 | 33.5% |
| Middle School | 33 | 19.8% |
| High School | 40 | 23.9% |
| College / Undergraduate | 14 | 8.4% |
| Graduate / Professional | 13 | 7.8% |
| Total | 167 | 100.0% |
School Enrollment by Age by Funding Source in Park City
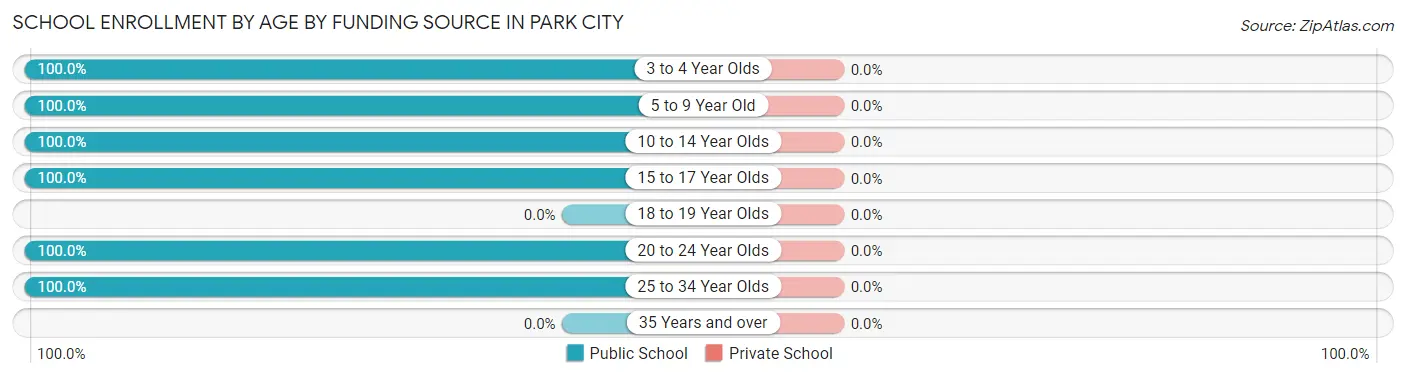
| Age Bracket | Public School | Private School |
| 3 to 4 Year Olds | 1 (100.0%) | 0 (0.0%) |
| 5 to 9 Year Old | 43 (100.0%) | 0 (0.0%) |
| 10 to 14 Year Olds | 58 (100.0%) | 0 (0.0%) |
| 15 to 17 Year Olds | 38 (100.0%) | 0 (0.0%) |
| 18 to 19 Year Olds | 0 (0.0%) | 0 (0.0%) |
| 20 to 24 Year Olds | 13 (100.0%) | 0 (0.0%) |
| 25 to 34 Year Olds | 14 (100.0%) | 0 (0.0%) |
| 35 Years and over | 0 (0.0%) | 0 (0.0%) |
| Total | 167 (100.0%) | 0 (0.0%) |
Educational Attainment by Field of Study in Park City
Science & technology (14 | 25.5%), education (14 | 25.5%), business (8 | 14.5%), liberal arts & history (5 | 9.1%), and bio, nature & agricultural (3 | 5.4%) are the most common fields of study among 55 individuals in Park City who have obtained a bachelor's degree or higher.
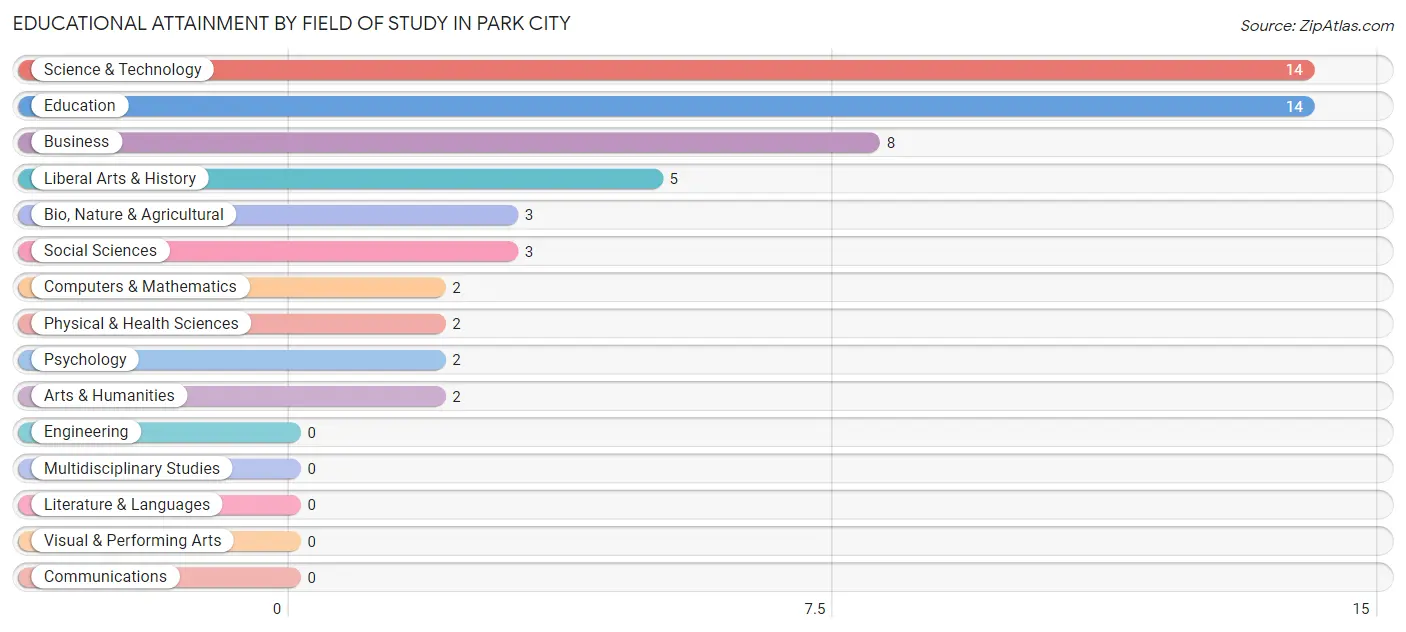
| Field of Study | # Graduates | % Graduates |
| Computers & Mathematics | 2 | 3.6% |
| Bio, Nature & Agricultural | 3 | 5.4% |
| Physical & Health Sciences | 2 | 3.6% |
| Psychology | 2 | 3.6% |
| Social Sciences | 3 | 5.4% |
| Engineering | 0 | 0.0% |
| Multidisciplinary Studies | 0 | 0.0% |
| Science & Technology | 14 | 25.5% |
| Business | 8 | 14.5% |
| Education | 14 | 25.5% |
| Literature & Languages | 0 | 0.0% |
| Liberal Arts & History | 5 | 9.1% |
| Visual & Performing Arts | 0 | 0.0% |
| Communications | 0 | 0.0% |
| Arts & Humanities | 2 | 3.6% |
| Total | 55 | 100.0% |
Transportation & Commute in Park City
Vehicle Availability by Sex in Park City
The most prevalent vehicle ownership categories in Park City are males with 1 vehicle (84, accounting for 44.9%) and females with 1 vehicle (41, making up 57.5%).
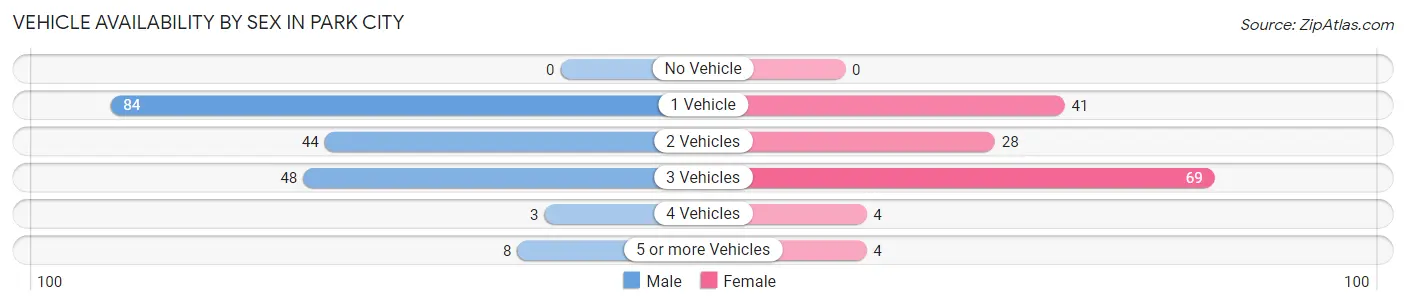
| Vehicles Available | Male | Female |
| No Vehicle | 0 (0.0%) | 0 (0.0%) |
| 1 Vehicle | 84 (44.9%) | 41 (28.1%) |
| 2 Vehicles | 44 (23.5%) | 28 (19.2%) |
| 3 Vehicles | 48 (25.7%) | 69 (47.3%) |
| 4 Vehicles | 3 (1.6%) | 4 (2.7%) |
| 5 or more Vehicles | 8 (4.3%) | 4 (2.7%) |
| Total | 187 (100.0%) | 146 (100.0%) |
Commute Time in Park City
The most frequently occuring commute durations in Park City are 20 to 24 minutes (132 commuters, 40.7%), 15 to 19 minutes (40 commuters, 12.3%), and 25 to 29 minutes (27 commuters, 8.3%).
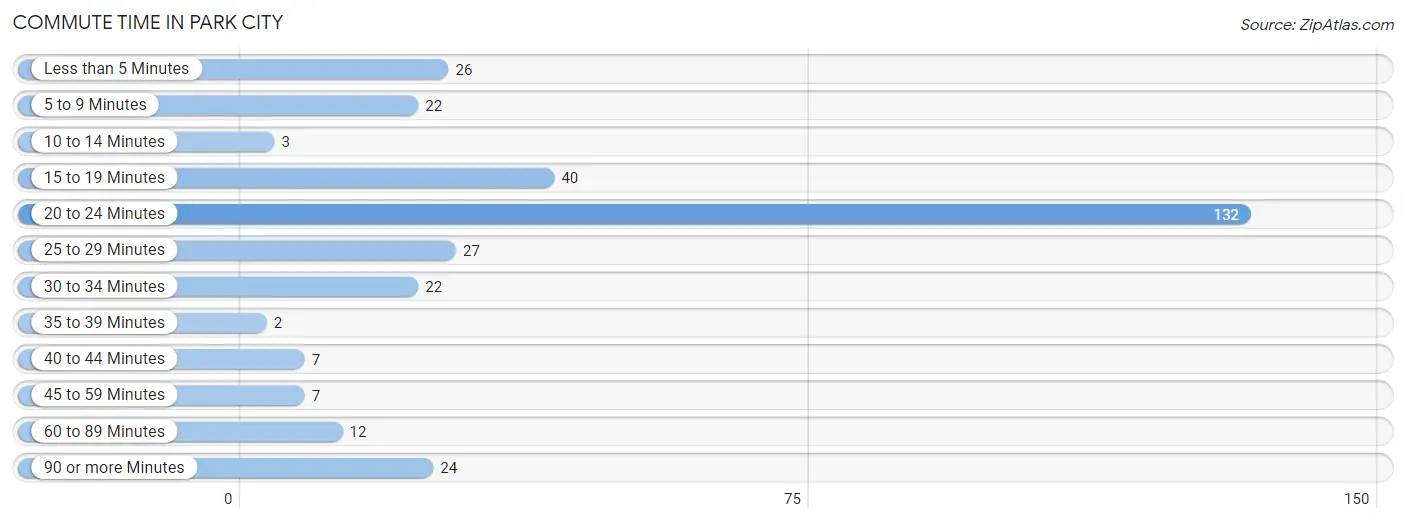
| Commute Time | # Commuters | % Commuters |
| Less than 5 Minutes | 26 | 8.0% |
| 5 to 9 Minutes | 22 | 6.8% |
| 10 to 14 Minutes | 3 | 0.9% |
| 15 to 19 Minutes | 40 | 12.3% |
| 20 to 24 Minutes | 132 | 40.7% |
| 25 to 29 Minutes | 27 | 8.3% |
| 30 to 34 Minutes | 22 | 6.8% |
| 35 to 39 Minutes | 2 | 0.6% |
| 40 to 44 Minutes | 7 | 2.2% |
| 45 to 59 Minutes | 7 | 2.2% |
| 60 to 89 Minutes | 12 | 3.7% |
| 90 or more Minutes | 24 | 7.4% |
Commute Time by Sex in Park City
The most common commute times in Park City are 20 to 24 minutes (72 commuters, 38.5%) for males and 20 to 24 minutes (60 commuters, 43.8%) for females.
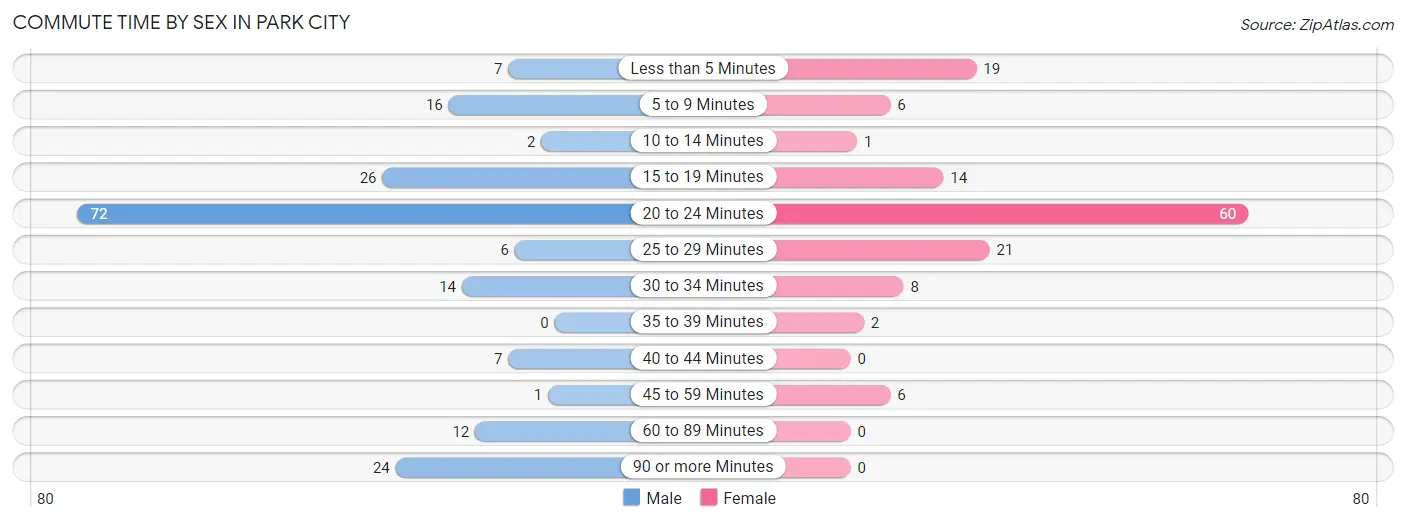
| Commute Time | Male | Female |
| Less than 5 Minutes | 7 (3.7%) | 19 (13.9%) |
| 5 to 9 Minutes | 16 (8.6%) | 6 (4.4%) |
| 10 to 14 Minutes | 2 (1.1%) | 1 (0.7%) |
| 15 to 19 Minutes | 26 (13.9%) | 14 (10.2%) |
| 20 to 24 Minutes | 72 (38.5%) | 60 (43.8%) |
| 25 to 29 Minutes | 6 (3.2%) | 21 (15.3%) |
| 30 to 34 Minutes | 14 (7.5%) | 8 (5.8%) |
| 35 to 39 Minutes | 0 (0.0%) | 2 (1.5%) |
| 40 to 44 Minutes | 7 (3.7%) | 0 (0.0%) |
| 45 to 59 Minutes | 1 (0.5%) | 6 (4.4%) |
| 60 to 89 Minutes | 12 (6.4%) | 0 (0.0%) |
| 90 or more Minutes | 24 (12.8%) | 0 (0.0%) |
Time of Departure to Work by Sex in Park City
The most frequent times of departure to work in Park City are 12:00 AM to 4:59 AM (72, 38.5%) for males and 7:00 AM to 7:29 AM (32, 23.4%) for females.
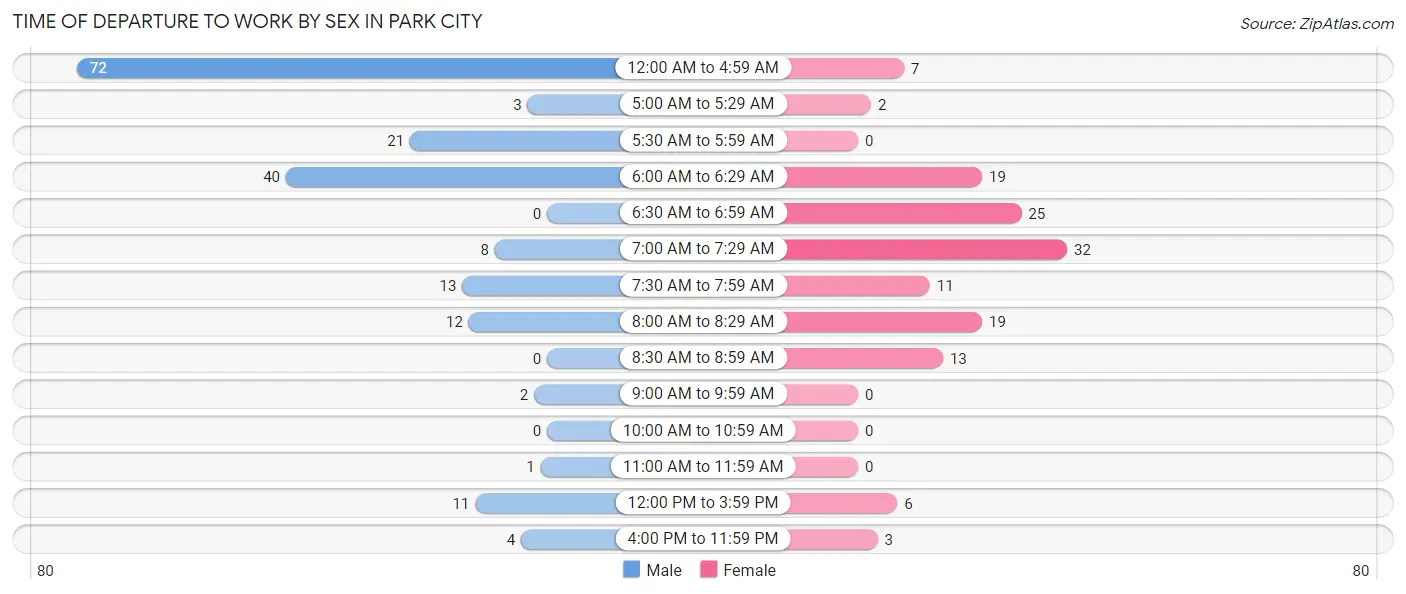
| Time of Departure | Male | Female |
| 12:00 AM to 4:59 AM | 72 (38.5%) | 7 (5.1%) |
| 5:00 AM to 5:29 AM | 3 (1.6%) | 2 (1.5%) |
| 5:30 AM to 5:59 AM | 21 (11.2%) | 0 (0.0%) |
| 6:00 AM to 6:29 AM | 40 (21.4%) | 19 (13.9%) |
| 6:30 AM to 6:59 AM | 0 (0.0%) | 25 (18.2%) |
| 7:00 AM to 7:29 AM | 8 (4.3%) | 32 (23.4%) |
| 7:30 AM to 7:59 AM | 13 (7.0%) | 11 (8.0%) |
| 8:00 AM to 8:29 AM | 12 (6.4%) | 19 (13.9%) |
| 8:30 AM to 8:59 AM | 0 (0.0%) | 13 (9.5%) |
| 9:00 AM to 9:59 AM | 2 (1.1%) | 0 (0.0%) |
| 10:00 AM to 10:59 AM | 0 (0.0%) | 0 (0.0%) |
| 11:00 AM to 11:59 AM | 1 (0.5%) | 0 (0.0%) |
| 12:00 PM to 3:59 PM | 11 (5.9%) | 6 (4.4%) |
| 4:00 PM to 11:59 PM | 4 (2.1%) | 3 (2.2%) |
| Total | 187 (100.0%) | 137 (100.0%) |
Housing Occupancy in Park City
Occupancy by Ownership in Park City
Of the total 283 dwellings in Park City, owner-occupied units account for 159 (56.2%), while renter-occupied units make up 124 (43.8%).
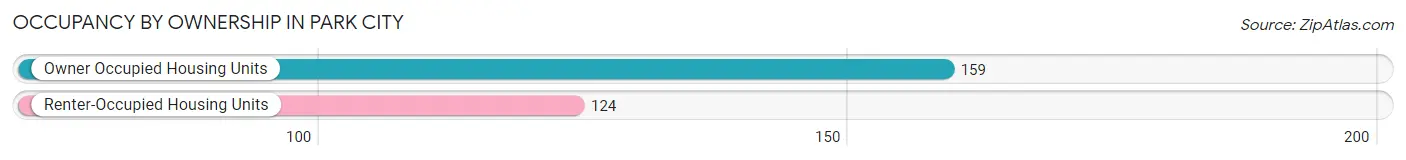
| Occupancy | # Housing Units | % Housing Units |
| Owner Occupied Housing Units | 159 | 56.2% |
| Renter-Occupied Housing Units | 124 | 43.8% |
| Total Occupied Housing Units | 283 | 100.0% |
Occupancy by Household Size in Park City
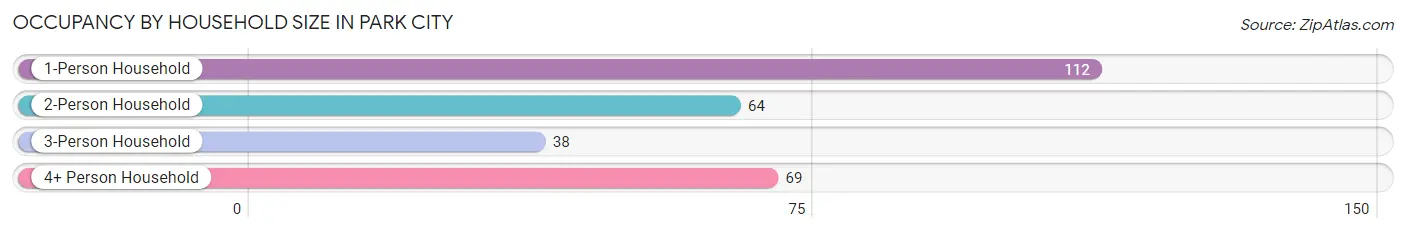
| Household Size | # Housing Units | % Housing Units |
| 1-Person Household | 112 | 39.6% |
| 2-Person Household | 64 | 22.6% |
| 3-Person Household | 38 | 13.4% |
| 4+ Person Household | 69 | 24.4% |
| Total Housing Units | 283 | 100.0% |
Occupancy by Ownership by Household Size in Park City
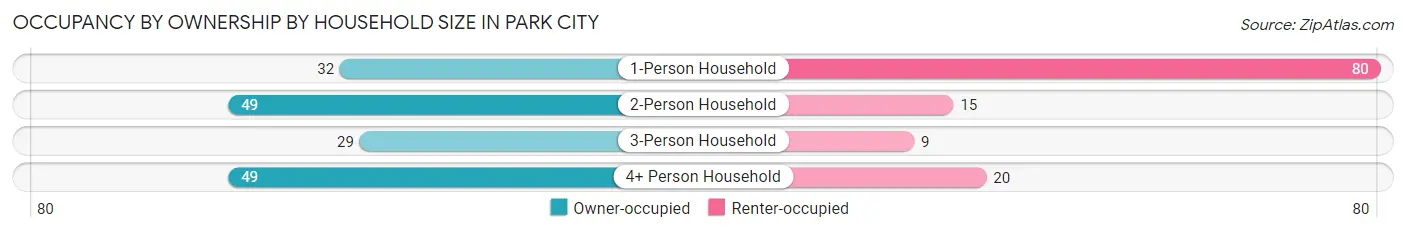
| Household Size | Owner-occupied | Renter-occupied |
| 1-Person Household | 32 (28.6%) | 80 (71.4%) |
| 2-Person Household | 49 (76.6%) | 15 (23.4%) |
| 3-Person Household | 29 (76.3%) | 9 (23.7%) |
| 4+ Person Household | 49 (71.0%) | 20 (29.0%) |
| Total Housing Units | 159 (56.2%) | 124 (43.8%) |
Occupancy by Educational Attainment in Park City
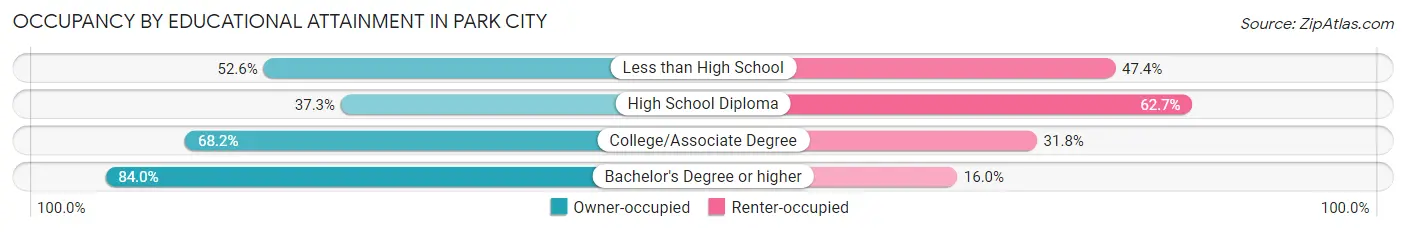
| Household Size | Owner-occupied | Renter-occupied |
| Less than High School | 10 (52.6%) | 9 (47.4%) |
| High School Diploma | 47 (37.3%) | 79 (62.7%) |
| College/Associate Degree | 60 (68.2%) | 28 (31.8%) |
| Bachelor's Degree or higher | 42 (84.0%) | 8 (16.0%) |
Occupancy by Age of Householder in Park City
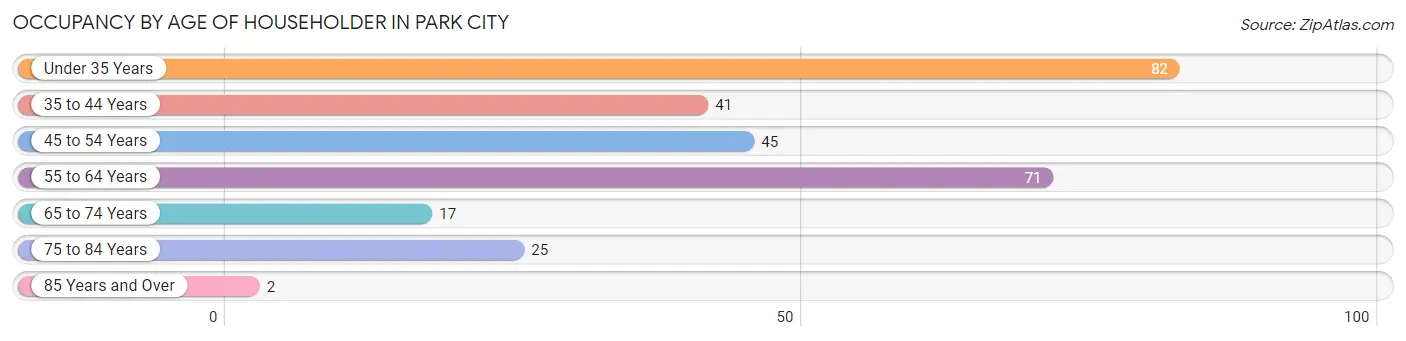
| Age Bracket | # Households | % Households |
| Under 35 Years | 82 | 29.0% |
| 35 to 44 Years | 41 | 14.5% |
| 45 to 54 Years | 45 | 15.9% |
| 55 to 64 Years | 71 | 25.1% |
| 65 to 74 Years | 17 | 6.0% |
| 75 to 84 Years | 25 | 8.8% |
| 85 Years and Over | 2 | 0.7% |
| Total | 283 | 100.0% |
Housing Finances in Park City
Median Income by Occupancy in Park City
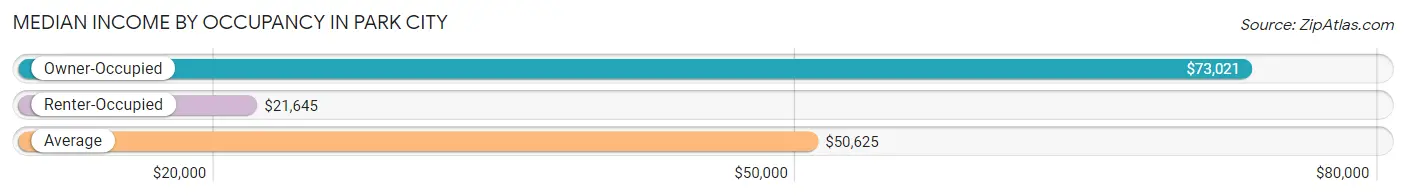
| Occupancy Type | # Households | Median Income |
| Owner-Occupied | 159 (56.2%) | $73,021 |
| Renter-Occupied | 124 (43.8%) | $21,645 |
| Average | 283 (100.0%) | $50,625 |
Occupancy by Householder Income Bracket in Park City
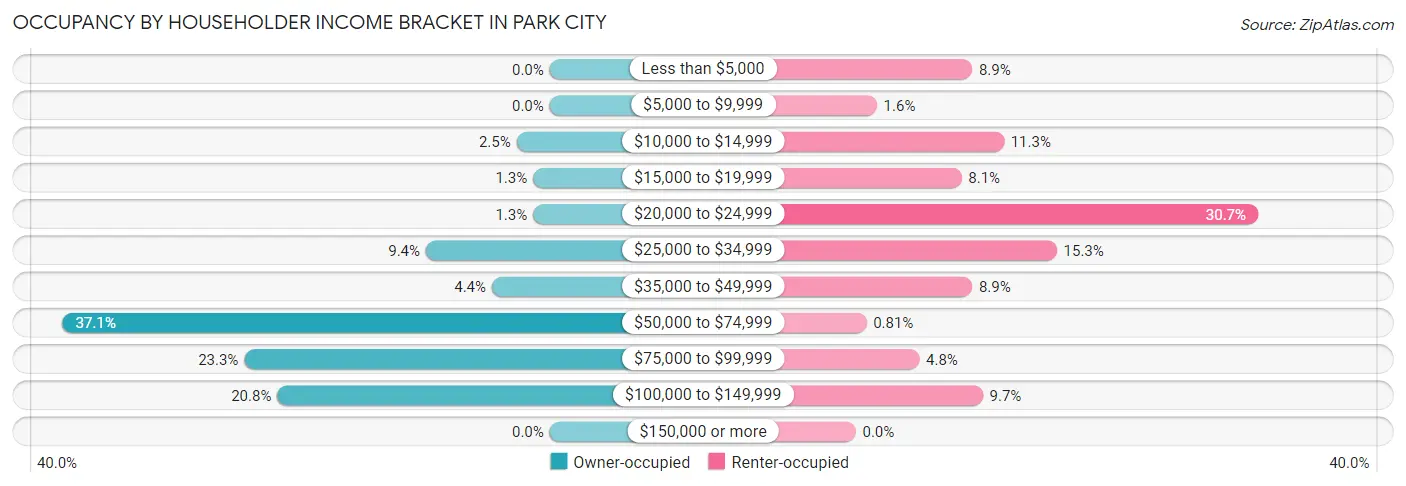
| Income Bracket | Owner-occupied | Renter-occupied |
| Less than $5,000 | 0 (0.0%) | 11 (8.9%) |
| $5,000 to $9,999 | 0 (0.0%) | 2 (1.6%) |
| $10,000 to $14,999 | 4 (2.5%) | 14 (11.3%) |
| $15,000 to $19,999 | 2 (1.3%) | 10 (8.1%) |
| $20,000 to $24,999 | 2 (1.3%) | 38 (30.6%) |
| $25,000 to $34,999 | 15 (9.4%) | 19 (15.3%) |
| $35,000 to $49,999 | 7 (4.4%) | 11 (8.9%) |
| $50,000 to $74,999 | 59 (37.1%) | 1 (0.8%) |
| $75,000 to $99,999 | 37 (23.3%) | 6 (4.8%) |
| $100,000 to $149,999 | 33 (20.7%) | 12 (9.7%) |
| $150,000 or more | 0 (0.0%) | 0 (0.0%) |
| Total | 159 (100.0%) | 124 (100.0%) |
Monthly Housing Cost Tiers in Park City
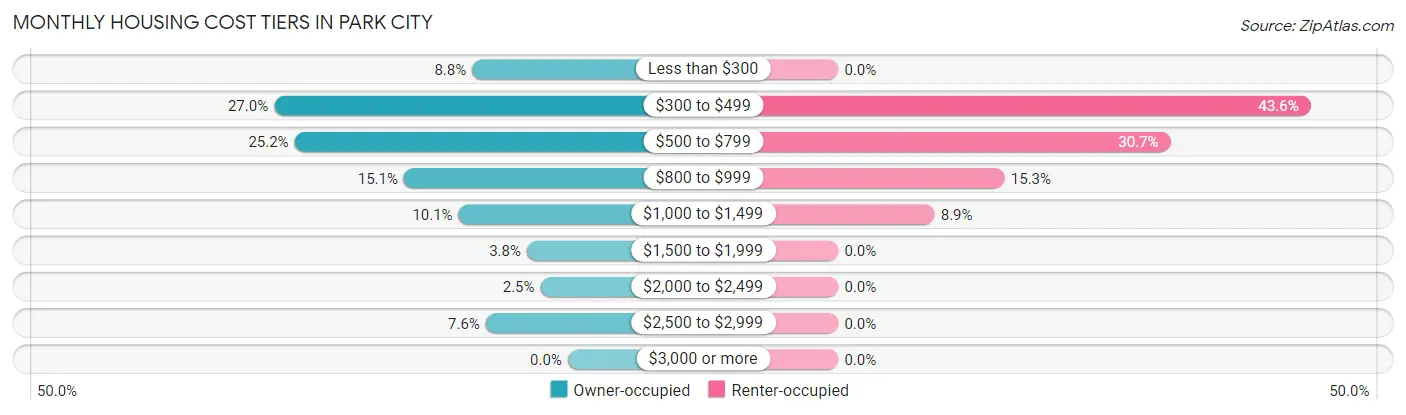
| Monthly Cost | Owner-occupied | Renter-occupied |
| Less than $300 | 14 (8.8%) | 0 (0.0%) |
| $300 to $499 | 43 (27.0%) | 54 (43.5%) |
| $500 to $799 | 40 (25.2%) | 38 (30.6%) |
| $800 to $999 | 24 (15.1%) | 19 (15.3%) |
| $1,000 to $1,499 | 16 (10.1%) | 11 (8.9%) |
| $1,500 to $1,999 | 6 (3.8%) | 0 (0.0%) |
| $2,000 to $2,499 | 4 (2.5%) | 0 (0.0%) |
| $2,500 to $2,999 | 12 (7.5%) | 0 (0.0%) |
| $3,000 or more | 0 (0.0%) | 0 (0.0%) |
| Total | 159 (100.0%) | 124 (100.0%) |
Physical Housing Characteristics in Park City
Housing Structures in Park City
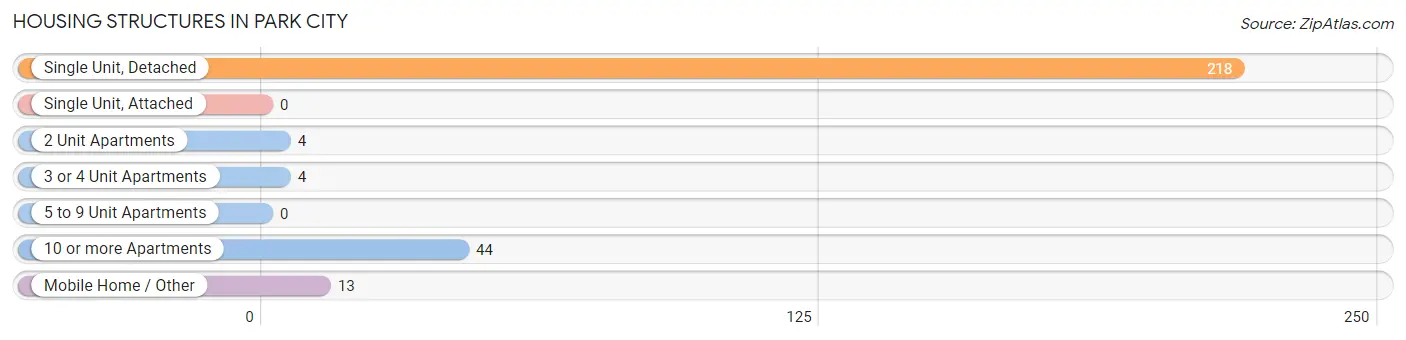
| Structure Type | # Housing Units | % Housing Units |
| Single Unit, Detached | 218 | 77.0% |
| Single Unit, Attached | 0 | 0.0% |
| 2 Unit Apartments | 4 | 1.4% |
| 3 or 4 Unit Apartments | 4 | 1.4% |
| 5 to 9 Unit Apartments | 0 | 0.0% |
| 10 or more Apartments | 44 | 15.5% |
| Mobile Home / Other | 13 | 4.6% |
| Total | 283 | 100.0% |
Housing Structures by Occupancy in Park City
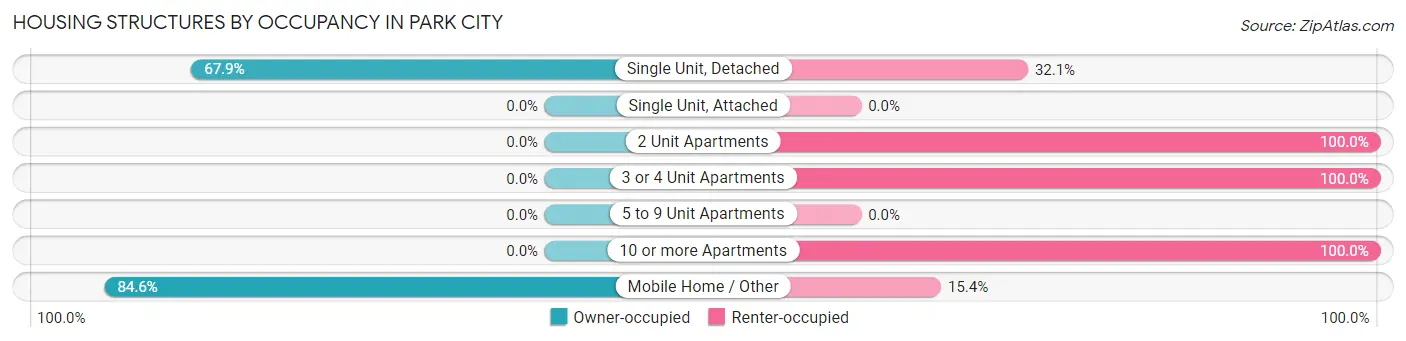
| Structure Type | Owner-occupied | Renter-occupied |
| Single Unit, Detached | 148 (67.9%) | 70 (32.1%) |
| Single Unit, Attached | 0 (0.0%) | 0 (0.0%) |
| 2 Unit Apartments | 0 (0.0%) | 4 (100.0%) |
| 3 or 4 Unit Apartments | 0 (0.0%) | 4 (100.0%) |
| 5 to 9 Unit Apartments | 0 (0.0%) | 0 (0.0%) |
| 10 or more Apartments | 0 (0.0%) | 44 (100.0%) |
| Mobile Home / Other | 11 (84.6%) | 2 (15.4%) |
| Total | 159 (56.2%) | 124 (43.8%) |
Housing Structures by Number of Rooms in Park City
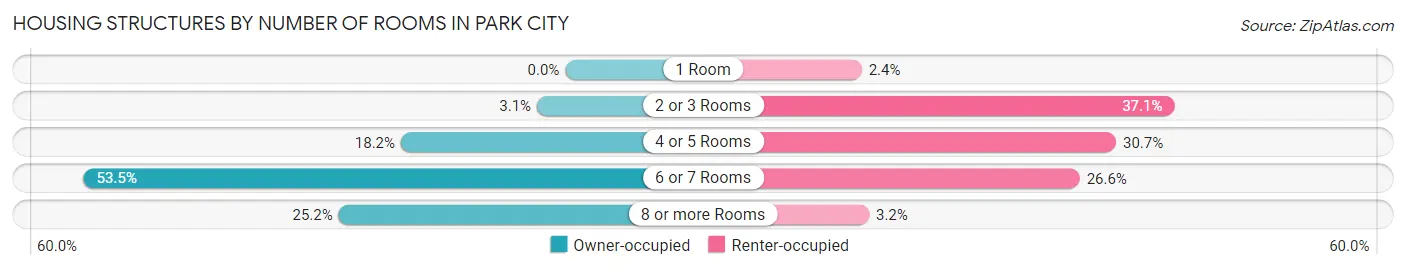
| Number of Rooms | Owner-occupied | Renter-occupied |
| 1 Room | 0 (0.0%) | 3 (2.4%) |
| 2 or 3 Rooms | 5 (3.1%) | 46 (37.1%) |
| 4 or 5 Rooms | 29 (18.2%) | 38 (30.6%) |
| 6 or 7 Rooms | 85 (53.5%) | 33 (26.6%) |
| 8 or more Rooms | 40 (25.2%) | 4 (3.2%) |
| Total | 159 (100.0%) | 124 (100.0%) |
Housing Structure by Heating Type in Park City
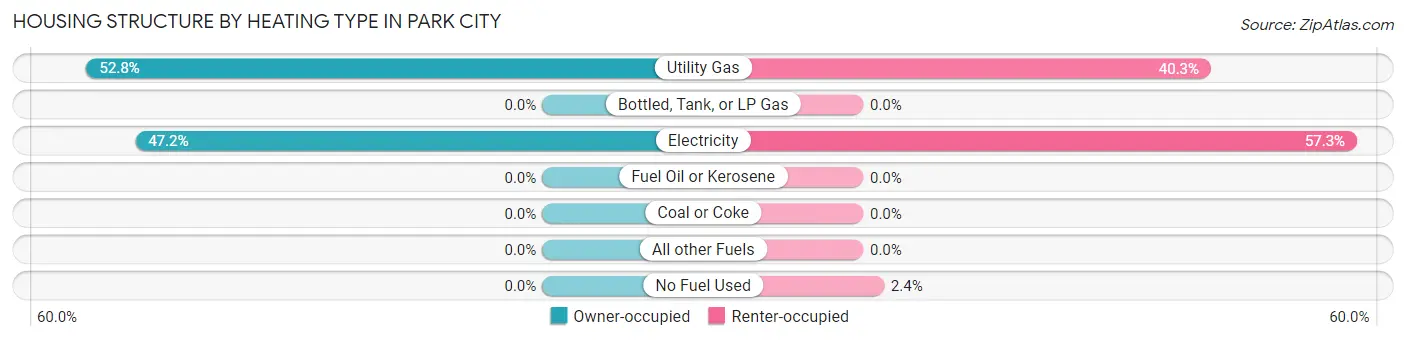
| Heating Type | Owner-occupied | Renter-occupied |
| Utility Gas | 84 (52.8%) | 50 (40.3%) |
| Bottled, Tank, or LP Gas | 0 (0.0%) | 0 (0.0%) |
| Electricity | 75 (47.2%) | 71 (57.3%) |
| Fuel Oil or Kerosene | 0 (0.0%) | 0 (0.0%) |
| Coal or Coke | 0 (0.0%) | 0 (0.0%) |
| All other Fuels | 0 (0.0%) | 0 (0.0%) |
| No Fuel Used | 0 (0.0%) | 3 (2.4%) |
| Total | 159 (100.0%) | 124 (100.0%) |
Household Vehicle Usage in Park City
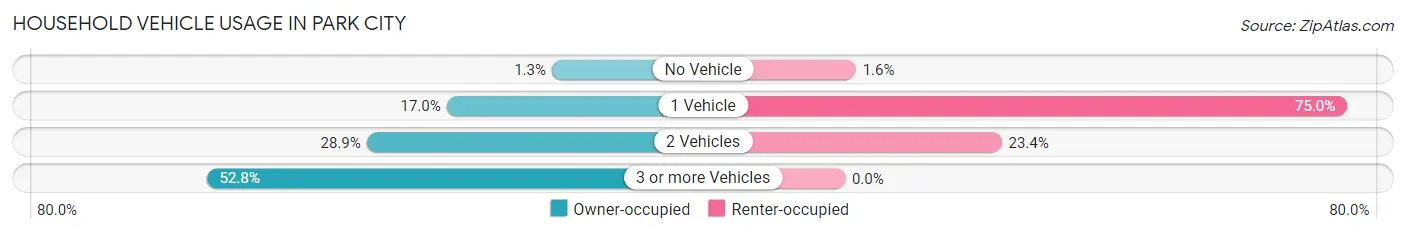
| Vehicles per Household | Owner-occupied | Renter-occupied |
| No Vehicle | 2 (1.3%) | 2 (1.6%) |
| 1 Vehicle | 27 (17.0%) | 93 (75.0%) |
| 2 Vehicles | 46 (28.9%) | 29 (23.4%) |
| 3 or more Vehicles | 84 (52.8%) | 0 (0.0%) |
| Total | 159 (100.0%) | 124 (100.0%) |
Real Estate & Mortgages in Park City
Real Estate and Mortgage Overview in Park City
| Characteristic | Without Mortgage | With Mortgage |
| Housing Units | 76 | 83 |
| Median Property Value | $113,300 | $130,100 |
| Median Household Income | $52,115 | $0 |
| Monthly Housing Costs | $417 | $0 |
| Real Estate Taxes | $800 | $0 |
Property Value by Mortgage Status in Park City
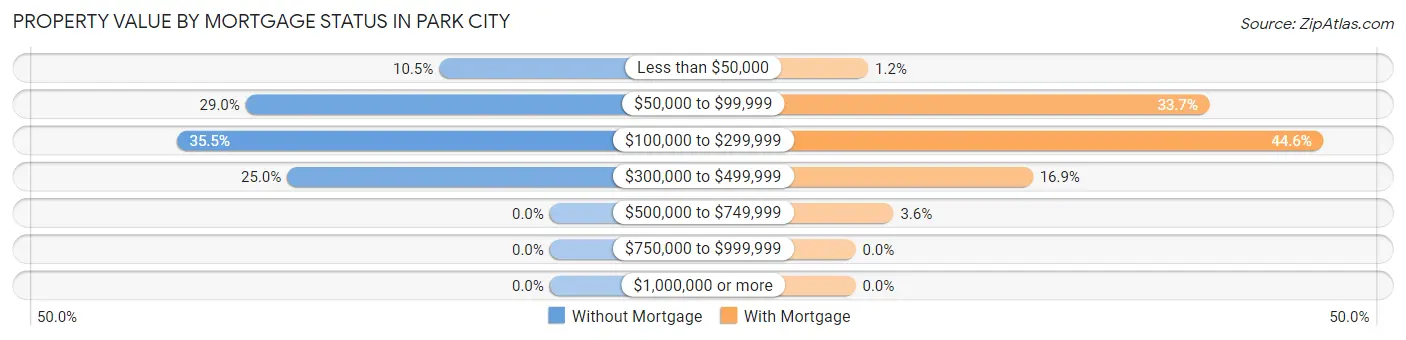
| Property Value | Without Mortgage | With Mortgage |
| Less than $50,000 | 8 (10.5%) | 1 (1.2%) |
| $50,000 to $99,999 | 22 (28.9%) | 28 (33.7%) |
| $100,000 to $299,999 | 27 (35.5%) | 37 (44.6%) |
| $300,000 to $499,999 | 19 (25.0%) | 14 (16.9%) |
| $500,000 to $749,999 | 0 (0.0%) | 3 (3.6%) |
| $750,000 to $999,999 | 0 (0.0%) | 0 (0.0%) |
| $1,000,000 or more | 0 (0.0%) | 0 (0.0%) |
| Total | 76 (100.0%) | 83 (100.0%) |
Household Income by Mortgage Status in Park City
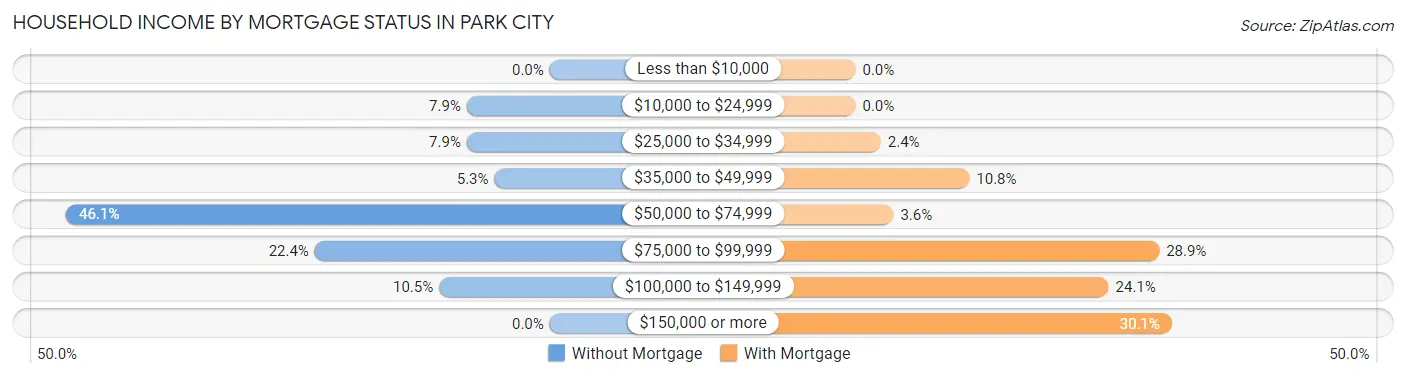
| Household Income | Without Mortgage | With Mortgage |
| Less than $10,000 | 0 (0.0%) | 0 (0.0%) |
| $10,000 to $24,999 | 6 (7.9%) | 0 (0.0%) |
| $25,000 to $34,999 | 6 (7.9%) | 2 (2.4%) |
| $35,000 to $49,999 | 4 (5.3%) | 9 (10.8%) |
| $50,000 to $74,999 | 35 (46.1%) | 3 (3.6%) |
| $75,000 to $99,999 | 17 (22.4%) | 24 (28.9%) |
| $100,000 to $149,999 | 8 (10.5%) | 20 (24.1%) |
| $150,000 or more | 0 (0.0%) | 25 (30.1%) |
| Total | 76 (100.0%) | 83 (100.0%) |
Property Value to Household Income Ratio in Park City
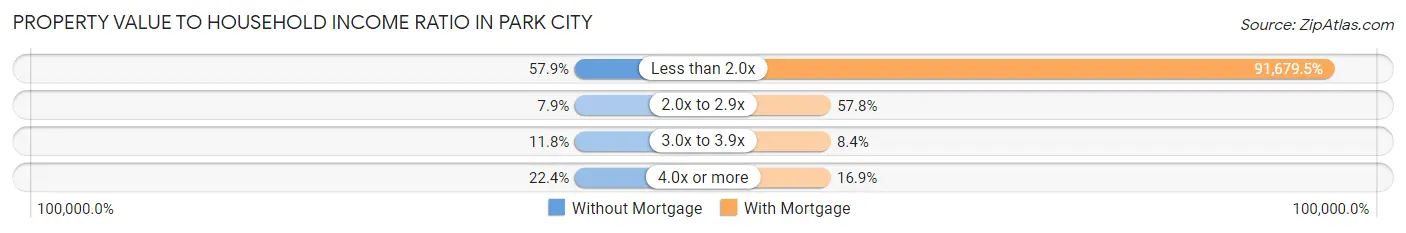
| Value-to-Income Ratio | Without Mortgage | With Mortgage |
| Less than 2.0x | 44 (57.9%) | 76,094 (91,679.5%) |
| 2.0x to 2.9x | 6 (7.9%) | 48 (57.8%) |
| 3.0x to 3.9x | 9 (11.8%) | 7 (8.4%) |
| 4.0x or more | 17 (22.4%) | 14 (16.9%) |
| Total | 76 (100.0%) | 83 (100.0%) |
Real Estate Taxes by Mortgage Status in Park City
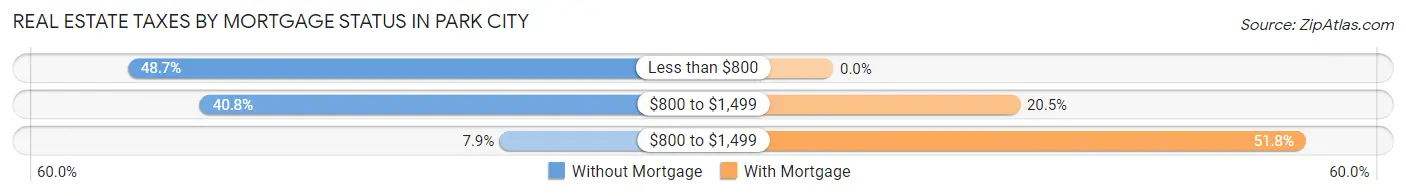
| Property Taxes | Without Mortgage | With Mortgage |
| Less than $800 | 37 (48.7%) | 0 (0.0%) |
| $800 to $1,499 | 31 (40.8%) | 17 (20.5%) |
| $800 to $1,499 | 6 (7.9%) | 43 (51.8%) |
| Total | 76 (100.0%) | 83 (100.0%) |
Health & Disability in Park City
Health Insurance Coverage by Age in Park City
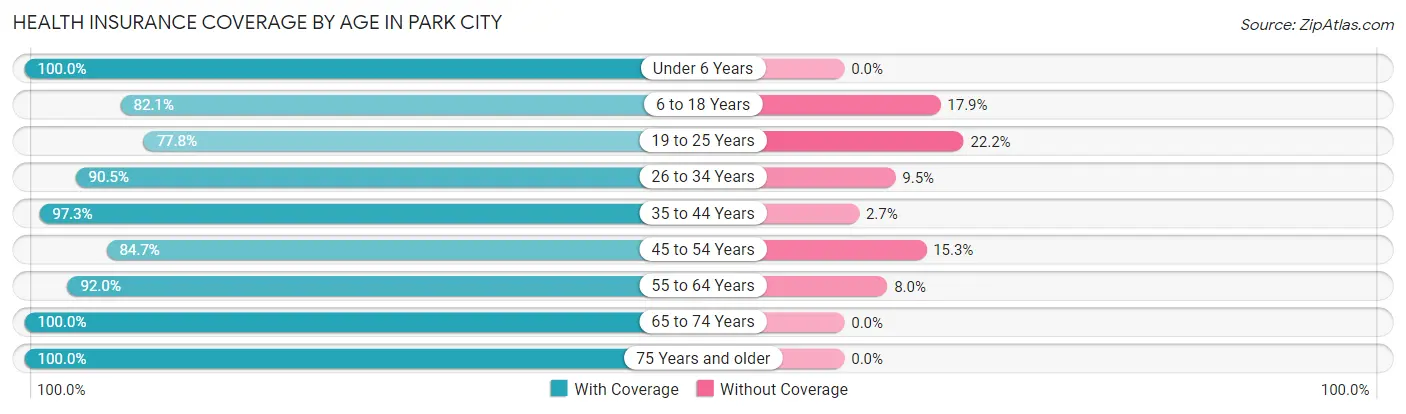
| Age Bracket | With Coverage | Without Coverage |
| Under 6 Years | 50 (100.0%) | 0 (0.0%) |
| 6 to 18 Years | 110 (82.1%) | 24 (17.9%) |
| 19 to 25 Years | 35 (77.8%) | 10 (22.2%) |
| 26 to 34 Years | 95 (90.5%) | 10 (9.5%) |
| 35 to 44 Years | 71 (97.3%) | 2 (2.7%) |
| 45 to 54 Years | 111 (84.7%) | 20 (15.3%) |
| 55 to 64 Years | 92 (92.0%) | 8 (8.0%) |
| 65 to 74 Years | 30 (100.0%) | 0 (0.0%) |
| 75 Years and older | 32 (100.0%) | 0 (0.0%) |
| Total | 626 (89.4%) | 74 (10.6%) |
Health Insurance Coverage by Citizenship Status in Park City
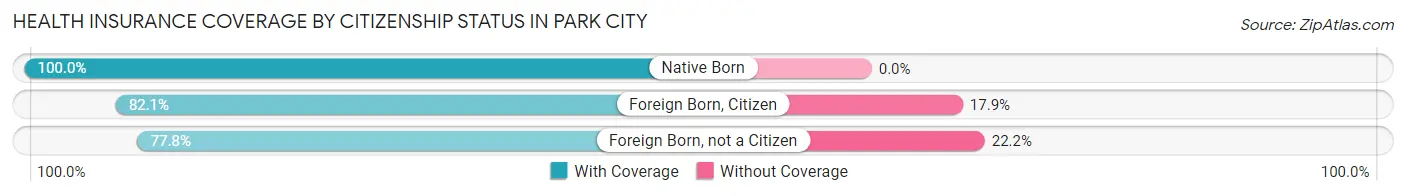
| Citizenship Status | With Coverage | Without Coverage |
| Native Born | 50 (100.0%) | 0 (0.0%) |
| Foreign Born, Citizen | 110 (82.1%) | 24 (17.9%) |
| Foreign Born, not a Citizen | 35 (77.8%) | 10 (22.2%) |
Health Insurance Coverage by Household Income in Park City
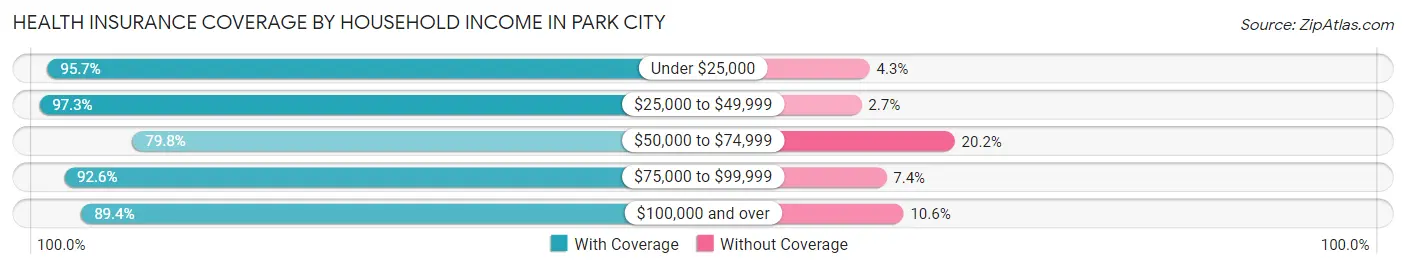
| Household Income | With Coverage | Without Coverage |
| Under $25,000 | 112 (95.7%) | 5 (4.3%) |
| $25,000 to $49,999 | 71 (97.3%) | 2 (2.7%) |
| $50,000 to $74,999 | 150 (79.8%) | 38 (20.2%) |
| $75,000 to $99,999 | 150 (92.6%) | 12 (7.4%) |
| $100,000 and over | 143 (89.4%) | 17 (10.6%) |
Public vs Private Health Insurance Coverage by Age in Park City
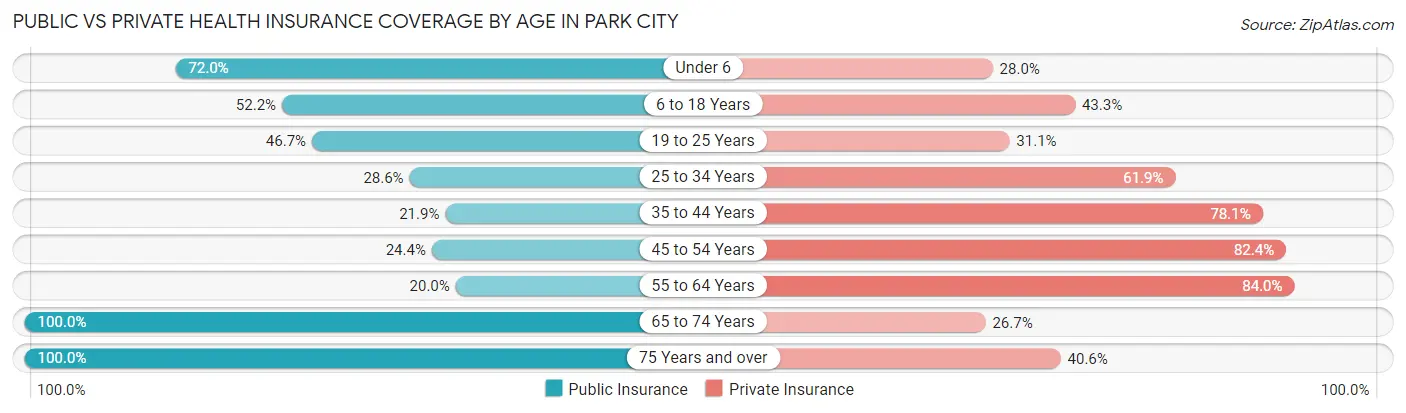
| Age Bracket | Public Insurance | Private Insurance |
| Under 6 | 36 (72.0%) | 14 (28.0%) |
| 6 to 18 Years | 70 (52.2%) | 58 (43.3%) |
| 19 to 25 Years | 21 (46.7%) | 14 (31.1%) |
| 25 to 34 Years | 30 (28.6%) | 65 (61.9%) |
| 35 to 44 Years | 16 (21.9%) | 57 (78.1%) |
| 45 to 54 Years | 32 (24.4%) | 108 (82.4%) |
| 55 to 64 Years | 20 (20.0%) | 84 (84.0%) |
| 65 to 74 Years | 30 (100.0%) | 8 (26.7%) |
| 75 Years and over | 32 (100.0%) | 13 (40.6%) |
| Total | 287 (41.0%) | 421 (60.1%) |
Disability Status by Sex by Age in Park City
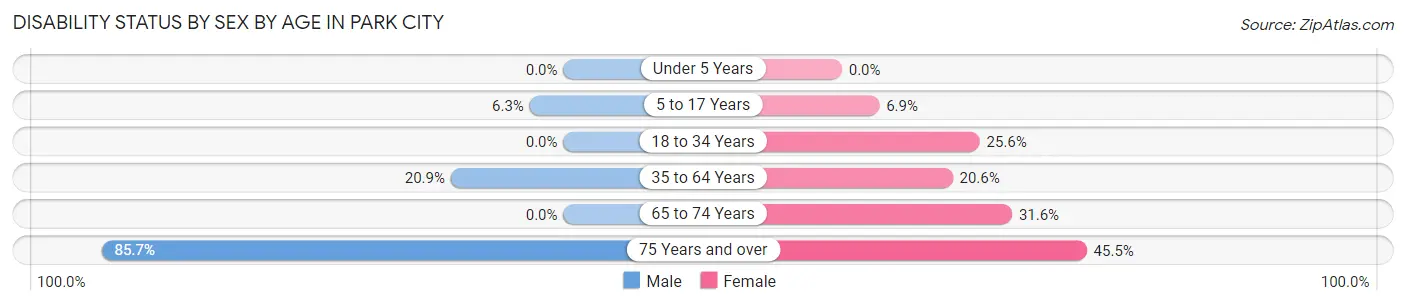
| Age Bracket | Male | Female |
| Under 5 Years | 0 (0.0%) | 0 (0.0%) |
| 5 to 17 Years | 5 (6.2%) | 5 (6.9%) |
| 18 to 34 Years | 0 (0.0%) | 22 (25.6%) |
| 35 to 64 Years | 33 (20.9%) | 30 (20.5%) |
| 65 to 74 Years | 0 (0.0%) | 6 (31.6%) |
| 75 Years and over | 18 (85.7%) | 5 (45.5%) |
Disability Class by Sex by Age in Park City
Disability Class: Hearing Difficulty
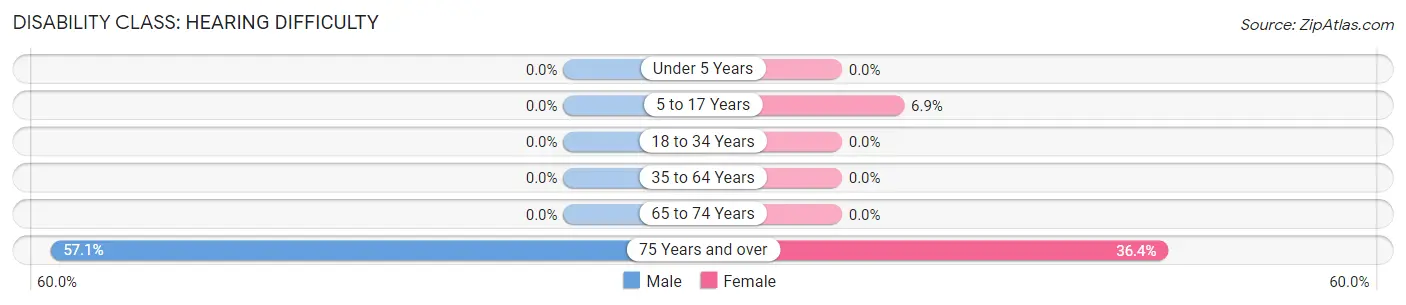
| Age Bracket | Male | Female |
| Under 5 Years | 0 (0.0%) | 0 (0.0%) |
| 5 to 17 Years | 0 (0.0%) | 5 (6.9%) |
| 18 to 34 Years | 0 (0.0%) | 0 (0.0%) |
| 35 to 64 Years | 0 (0.0%) | 0 (0.0%) |
| 65 to 74 Years | 0 (0.0%) | 0 (0.0%) |
| 75 Years and over | 12 (57.1%) | 4 (36.4%) |
Disability Class: Vision Difficulty
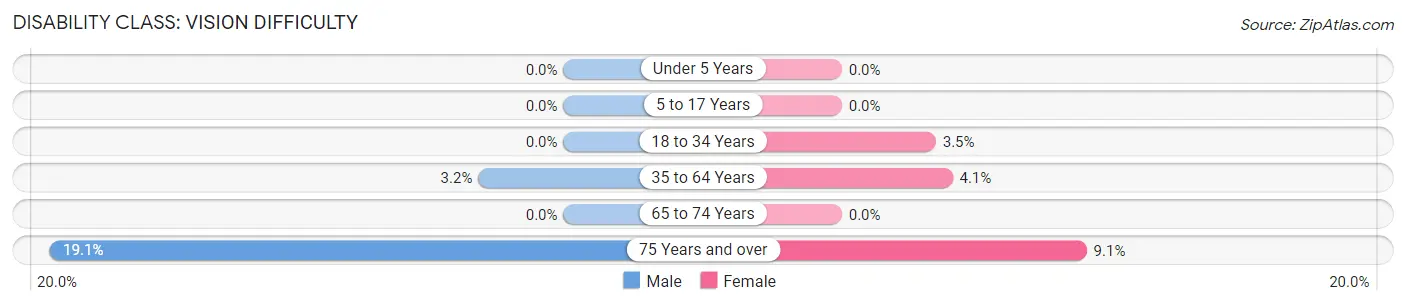
| Age Bracket | Male | Female |
| Under 5 Years | 0 (0.0%) | 0 (0.0%) |
| 5 to 17 Years | 0 (0.0%) | 0 (0.0%) |
| 18 to 34 Years | 0 (0.0%) | 3 (3.5%) |
| 35 to 64 Years | 5 (3.2%) | 6 (4.1%) |
| 65 to 74 Years | 0 (0.0%) | 0 (0.0%) |
| 75 Years and over | 4 (19.1%) | 1 (9.1%) |
Disability Class: Cognitive Difficulty
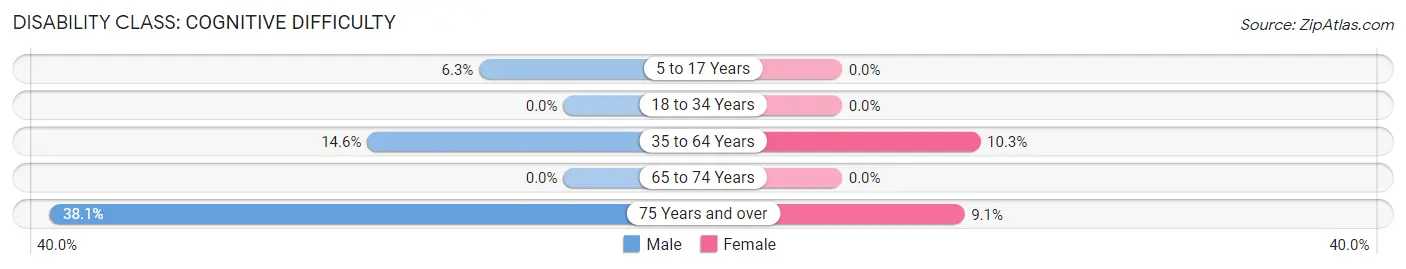
| Age Bracket | Male | Female |
| 5 to 17 Years | 5 (6.2%) | 0 (0.0%) |
| 18 to 34 Years | 0 (0.0%) | 0 (0.0%) |
| 35 to 64 Years | 23 (14.6%) | 15 (10.3%) |
| 65 to 74 Years | 0 (0.0%) | 0 (0.0%) |
| 75 Years and over | 8 (38.1%) | 1 (9.1%) |
Disability Class: Ambulatory Difficulty
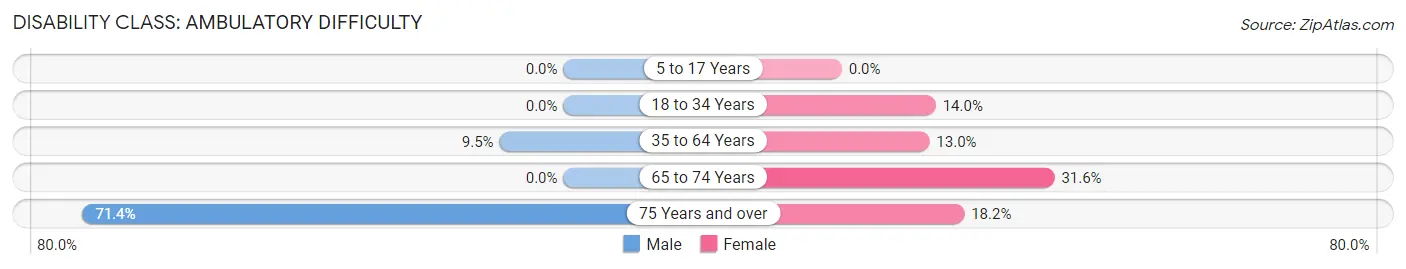
| Age Bracket | Male | Female |
| 5 to 17 Years | 0 (0.0%) | 0 (0.0%) |
| 18 to 34 Years | 0 (0.0%) | 12 (14.0%) |
| 35 to 64 Years | 15 (9.5%) | 19 (13.0%) |
| 65 to 74 Years | 0 (0.0%) | 6 (31.6%) |
| 75 Years and over | 15 (71.4%) | 2 (18.2%) |
Disability Class: Self-Care Difficulty
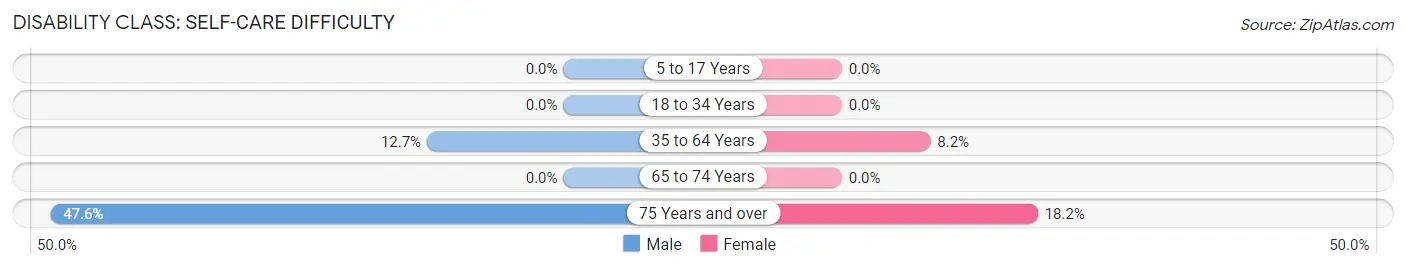
| Age Bracket | Male | Female |
| 5 to 17 Years | 0 (0.0%) | 0 (0.0%) |
| 18 to 34 Years | 0 (0.0%) | 0 (0.0%) |
| 35 to 64 Years | 20 (12.7%) | 12 (8.2%) |
| 65 to 74 Years | 0 (0.0%) | 0 (0.0%) |
| 75 Years and over | 10 (47.6%) | 2 (18.2%) |
Technology Access in Park City
Computing Device Access in Park City
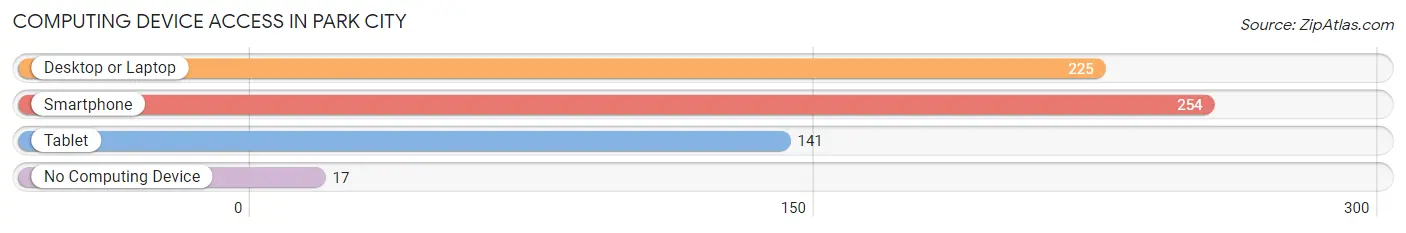
| Device Type | # Households | % Households |
| Desktop or Laptop | 225 | 79.5% |
| Smartphone | 254 | 89.7% |
| Tablet | 141 | 49.8% |
| No Computing Device | 17 | 6.0% |
| Total | 283 | 100.0% |
Internet Access in Park City
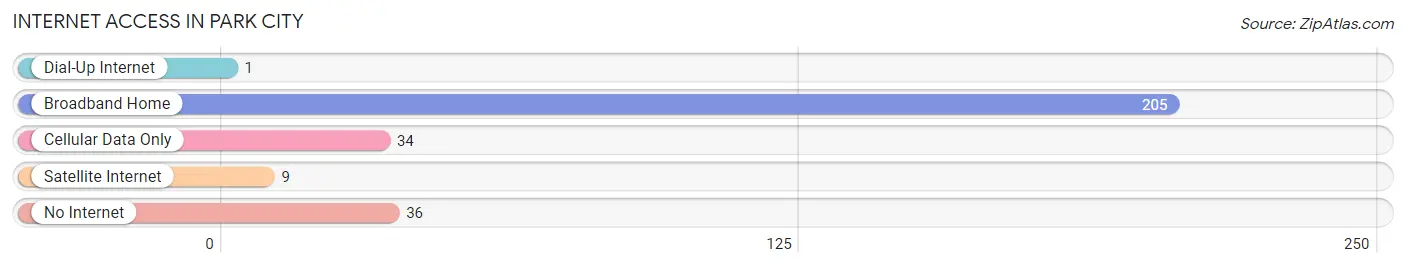
| Internet Type | # Households | % Households |
| Dial-Up Internet | 1 | 0.4% |
| Broadband Home | 205 | 72.4% |
| Cellular Data Only | 34 | 12.0% |
| Satellite Internet | 9 | 3.2% |
| No Internet | 36 | 12.7% |
| Total | 283 | 100.0% |
Park City Summary
City Overview
Park City is a small city located in Barren County, Kentucky. It is situated in the south-central part of the state, about 30 miles south of Bowling Green and about 90 miles north of Nashville, Tennessee. The city is part of the Glasgow Micropolitan Statistical Area and has a population of approximately 1,500 people.
History
Park City was founded in 1883 by the Louisville and Nashville Railroad. The city was named after the nearby Park City Coal Company, which was established in 1881. The city was incorporated in 1887 and was the first city in Barren County to be incorporated.
The city was a major coal mining center in the early 20th century. The coal industry was the main source of employment for the city’s residents. The city also had a thriving business district, which included a variety of stores, restaurants, and other businesses.
In the 1950s, the coal industry began to decline and the city’s economy shifted to other industries, such as manufacturing and tourism. The city’s economy has continued to diversify over the years and today, the city is home to a variety of businesses, including a number of small businesses.
Geography
Park City is located in south-central Kentucky, about 30 miles south of Bowling Green and about 90 miles north of Nashville, Tennessee. The city is situated in the Barren River Valley and is surrounded by rolling hills and farmland. The city is located at an elevation of 645 feet above sea level.
The city has a total area of 1.3 square miles, all of which is land. The city is located near the Barren River, which is a tributary of the Green River. The city is also located near the Mammoth Cave National Park, which is the longest cave system in the world.
Economy
The economy of Park City is largely based on tourism and small businesses. The city is home to a variety of small businesses, including restaurants, retail stores, and other services. The city is also home to a number of manufacturing companies, which produce a variety of products, including furniture, clothing, and automotive parts.
The city is also home to a number of agricultural businesses, which produce a variety of crops, including corn, soybeans, and wheat. The city is also home to a number of recreational activities, including fishing, hunting, and camping.
Demographics
As of the 2010 census, the population of Park City was 1,500 people. The city has a population density of 1,150 people per square mile. The median age of the city’s population is 39.7 years.
The racial makeup of the city is 97.3% White, 0.7% African American, 0.3% Native American, 0.3% Asian, 0.3% from other races, and 1.3% from two or more races. The median household income in the city is $35,000 and the median family income is $41,000. The per capita income in the city is $17,000.
Conclusion
Park City is a small city located in Barren County, Kentucky. The city was founded in 1883 and was a major coal mining center in the early 20th century. The city’s economy has since shifted to other industries, such as manufacturing and tourism. The city has a population of approximately 1,500 people and has a median household income of $35,000. The city is home to a variety of small businesses and is also home to a number of recreational activities.
Common Questions
What is Per Capita Income in Park City?
Per Capita income in Park City is $24,918.
What is the Median Family Income in Park City?
Median Family Income in Park City is $75,000.
What is the Median Household income in Park City?
Median Household Income in Park City is $50,625.
What is Income or Wage Gap in Park City?
Income or Wage Gap in Park City is 1.4%.
Women in Park City earn 98.6 cents for every dollar earned by a man.
What is Inequality or Gini Index in Park City?
Inequality or Gini Index in Park City is 0.39.
What is the Total Population of Park City?
Total Population of Park City is 700.
What is the Total Male Population of Park City?
Total Male Population of Park City is 358.
What is the Total Female Population of Park City?
Total Female Population of Park City is 342.
What is the Ratio of Males per 100 Females in Park City?
There are 104.68 Males per 100 Females in Park City.
What is the Ratio of Females per 100 Males in Park City?
There are 95.53 Females per 100 Males in Park City.
What is the Median Population Age in Park City?
Median Population Age in Park City is 36.5 Years.
What is the Average Family Size in Park City
Average Family Size in Park City is 3.4 People.
What is the Average Household Size in Park City
Average Household Size in Park City is 2.5 People.
How Large is the Labor Force in Park City?
There are 353 People in the Labor Forcein in Park City.
What is the Percentage of People in the Labor Force in Park City?
65.0% of People are in the Labor Force in Park City.