Paris, KY Map & Demographics
Paris Map
Paris Overview
$25,222
PER CAPITA INCOME
$60,786
AVG FAMILY INCOME
$46,752
AVG HOUSEHOLD INCOME
27.1%
WAGE / INCOME GAP [ % ]
72.9¢/ $1
WAGE / INCOME GAP [ $ ]
$8,416
FAMILY INCOME DEFICIT
0.45
INEQUALITY / GINI INDEX
10,143
TOTAL POPULATION
5,015
MALE POPULATION
5,128
FEMALE POPULATION
97.80
MALES / 100 FEMALES
102.25
FEMALES / 100 MALES
36.6
MEDIAN AGE
3.1
AVG FAMILY SIZE
2.5
AVG HOUSEHOLD SIZE
4,602
LABOR FORCE [ PEOPLE ]
58.0%
PERCENT IN LABOR FORCE
5.9%
UNEMPLOYMENT RATE
Paris Zip Codes
Paris Area Codes
Income in Paris
Income Overview in Paris
Per Capita Income in Paris is $25,222, while median incomes of families and households are $60,786 and $46,752 respectively.
| Characteristic | Number | Measure |
| Per Capita Income | 10,143 | $25,222 |
| Median Family Income | 2,402 | $60,786 |
| Mean Family Income | 2,402 | $72,693 |
| Median Household Income | 4,050 | $46,752 |
| Mean Household Income | 4,050 | $61,136 |
| Income Deficit | 2,402 | $8,416 |
| Wage / Income Gap (%) | 10,143 | 27.07% |
| Wage / Income Gap ($) | 10,143 | 72.93¢ per $1 |
| Gini / Inequality Index | 10,143 | 0.45 |
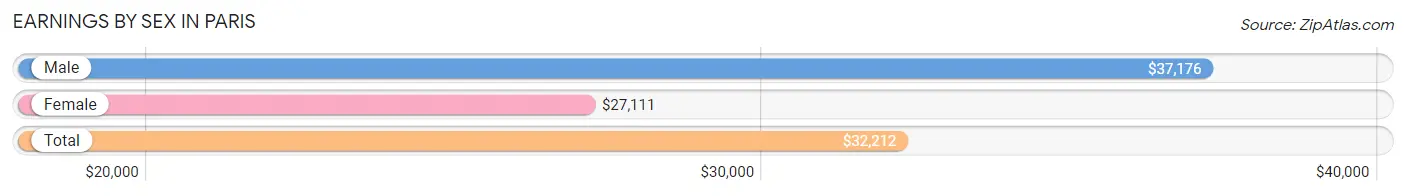
Earnings by Sex in Paris
Average Earnings in Paris are $32,212, $37,176 for men and $27,111 for women, a difference of 27.1%.
| Sex | Number | Average Earnings |
| Male | 2,405 (50.4%) | $37,176 |
| Female | 2,366 (49.6%) | $27,111 |
| Total | 4,771 (100.0%) | $32,212 |
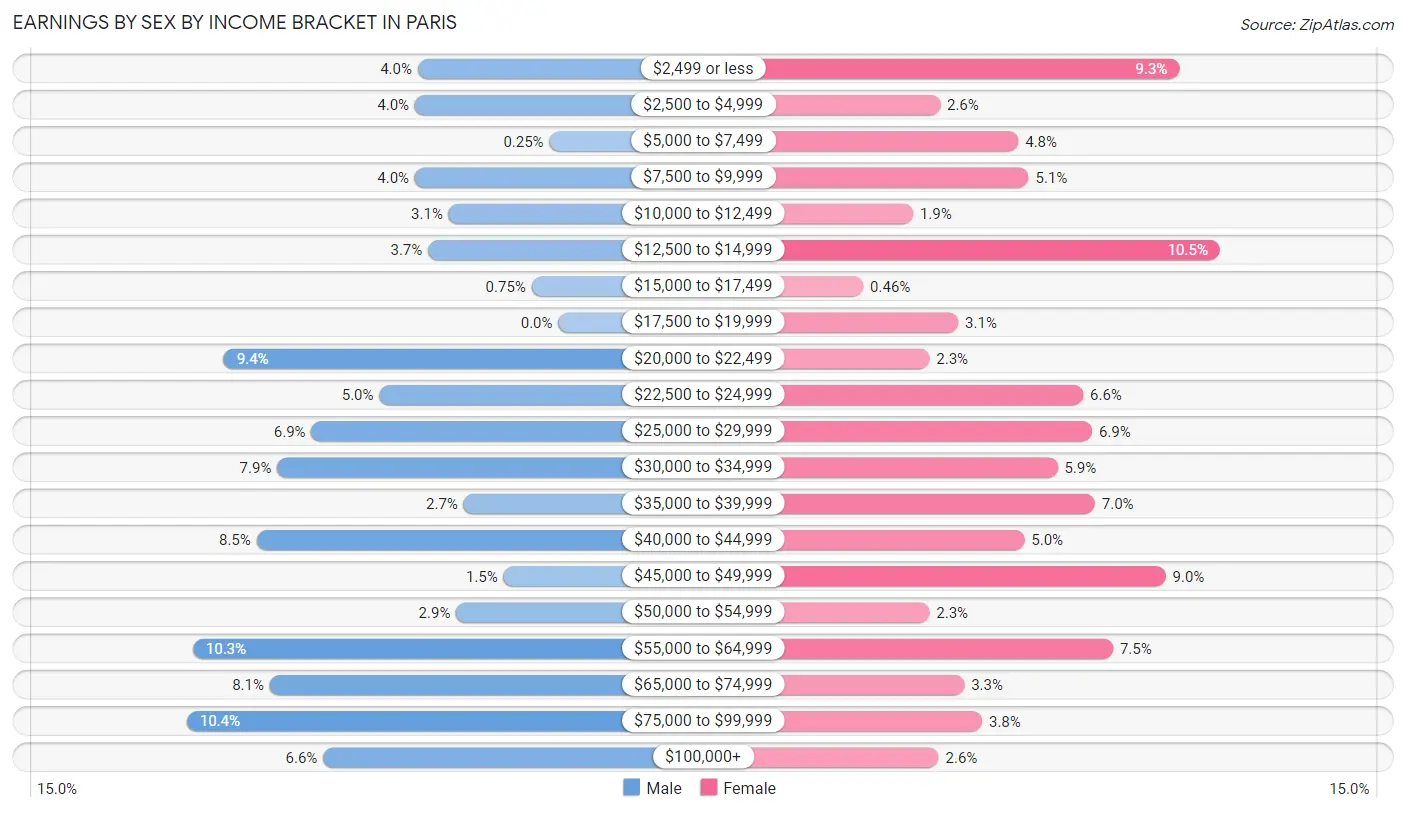
Earnings by Sex by Income Bracket in Paris
The most common earnings brackets in Paris are $75,000 to $99,999 for men (251 | 10.4%) and $12,500 to $14,999 for women (248 | 10.5%).
| Income | Male | Female |
| $2,499 or less | 95 (4.0%) | 221 (9.3%) |
| $2,500 to $4,999 | 97 (4.0%) | 62 (2.6%) |
| $5,000 to $7,499 | 6 (0.3%) | 114 (4.8%) |
| $7,500 to $9,999 | 97 (4.0%) | 121 (5.1%) |
| $10,000 to $12,499 | 74 (3.1%) | 44 (1.9%) |
| $12,500 to $14,999 | 88 (3.7%) | 248 (10.5%) |
| $15,000 to $17,499 | 18 (0.7%) | 11 (0.5%) |
| $17,500 to $19,999 | 0 (0.0%) | 74 (3.1%) |
| $20,000 to $22,499 | 226 (9.4%) | 55 (2.3%) |
| $22,500 to $24,999 | 121 (5.0%) | 157 (6.6%) |
| $25,000 to $29,999 | 167 (6.9%) | 163 (6.9%) |
| $30,000 to $34,999 | 190 (7.9%) | 140 (5.9%) |
| $35,000 to $39,999 | 64 (2.7%) | 165 (7.0%) |
| $40,000 to $44,999 | 204 (8.5%) | 118 (5.0%) |
| $45,000 to $49,999 | 37 (1.5%) | 212 (9.0%) |
| $50,000 to $54,999 | 69 (2.9%) | 55 (2.3%) |
| $55,000 to $64,999 | 247 (10.3%) | 177 (7.5%) |
| $65,000 to $74,999 | 195 (8.1%) | 78 (3.3%) |
| $75,000 to $99,999 | 251 (10.4%) | 90 (3.8%) |
| $100,000+ | 159 (6.6%) | 61 (2.6%) |
| Total | 2,405 (100.0%) | 2,366 (100.0%) |
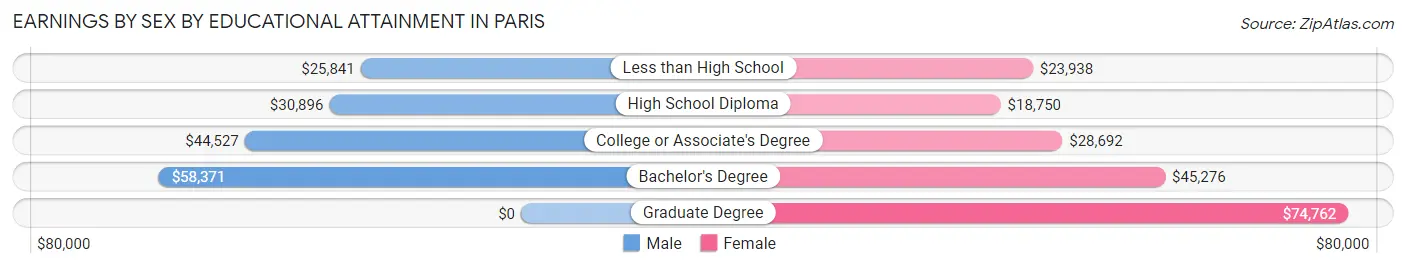
Earnings by Sex by Educational Attainment in Paris
Average earnings in Paris are $41,389 for men and $32,564 for women, a difference of 21.3%. Men with an educational attainment of bachelor's degree enjoy the highest average annual earnings of $58,371, while those with less than high school education earn the least with $25,841. Women with an educational attainment of graduate degree earn the most with the average annual earnings of $74,762, while those with high school diploma education have the smallest earnings of $18,750.
| Educational Attainment | Male Income | Female Income |
| Less than High School | $25,841 | $23,938 |
| High School Diploma | $30,896 | $18,750 |
| College or Associate's Degree | $44,527 | $28,692 |
| Bachelor's Degree | $58,371 | $45,276 |
| Graduate Degree | - | - |
| Total | $41,389 | $32,564 |
Family Income in Paris
Family Income Brackets in Paris
According to the Paris family income data, there are 444 families falling into the $100,000 to $149,999 income range, which is the most common income bracket and makes up 18.5% of all families. Conversely, the $150,000 to $199,999 income bracket is the least frequent group with only 89 families (3.7%) belonging to this category.
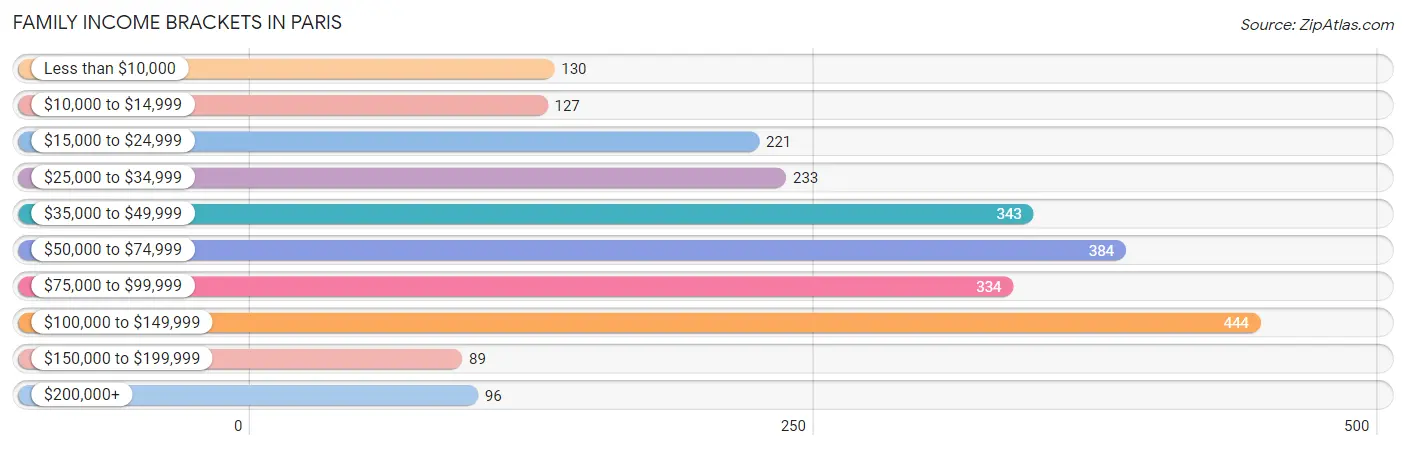
| Income Bracket | # Families | % Families |
| Less than $10,000 | 130 | 5.4% |
| $10,000 to $14,999 | 127 | 5.3% |
| $15,000 to $24,999 | 221 | 9.2% |
| $25,000 to $34,999 | 233 | 9.7% |
| $35,000 to $49,999 | 343 | 14.3% |
| $50,000 to $74,999 | 384 | 16.0% |
| $75,000 to $99,999 | 334 | 13.9% |
| $100,000 to $149,999 | 444 | 18.5% |
| $150,000 to $199,999 | 89 | 3.7% |
| $200,000+ | 96 | 4.0% |
Family Income by Famaliy Size in Paris
4-person families (325 | 13.5%) account for the highest median family income in Paris with $123,365 per family, while 4-person families (325 | 13.5%) have the highest median income of $30,841 per family member.
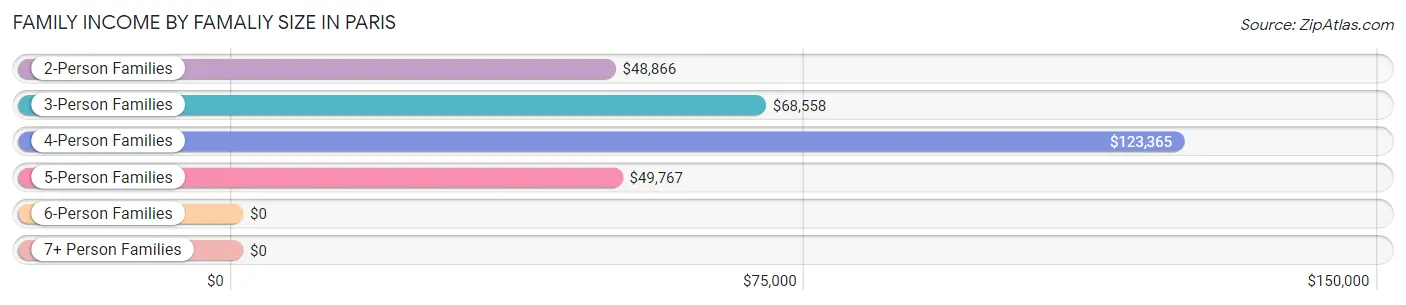
| Income Bracket | # Families | Median Income |
| 2-Person Families | 1,361 (56.7%) | $48,866 |
| 3-Person Families | 467 (19.4%) | $68,558 |
| 4-Person Families | 325 (13.5%) | $123,365 |
| 5-Person Families | 150 (6.2%) | $49,767 |
| 6-Person Families | 14 (0.6%) | $0 |
| 7+ Person Families | 85 (3.5%) | $0 |
| Total | 2,402 (100.0%) | $60,786 |
Family Income by Number of Earners in Paris
The median family income in Paris is $60,786, with families comprising 3+ earners (102) having the highest median family income of $141,250, while families with no earners (394) have the lowest median family income of $20,058, accounting for 4.3% and 16.4% of families, respectively.
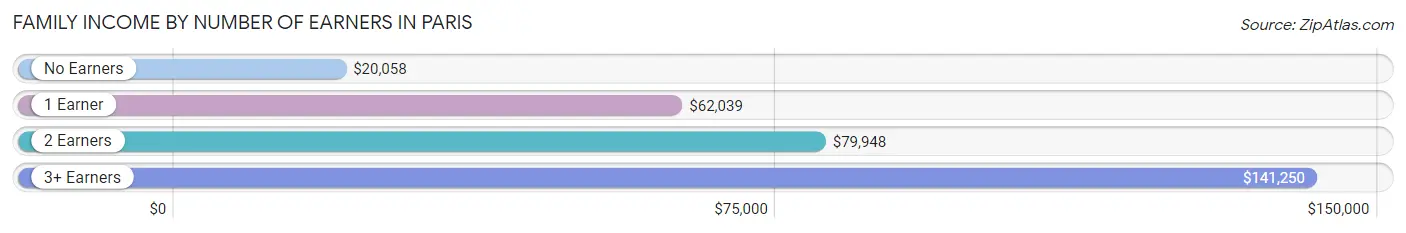
| Number of Earners | # Families | Median Income |
| No Earners | 394 (16.4%) | $20,058 |
| 1 Earner | 1,003 (41.8%) | $62,039 |
| 2 Earners | 903 (37.6%) | $79,948 |
| 3+ Earners | 102 (4.3%) | $141,250 |
| Total | 2,402 (100.0%) | $60,786 |
Household Income in Paris
Household Income Brackets in Paris
With 624 households falling in the category, the $100,000 to $149,999 income range is the most frequent in Paris, accounting for 15.4% of all households. In contrast, only 97 households (2.4%) fall into the $200,000+ income bracket, making it the least populous group.
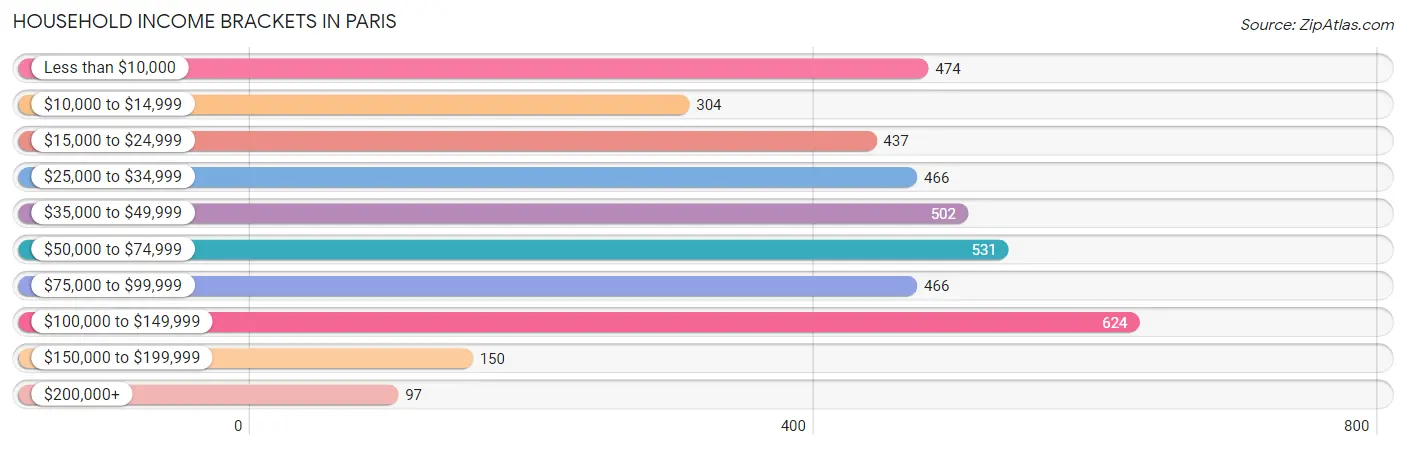
| Income Bracket | # Households | % Households |
| Less than $10,000 | 474 | 11.7% |
| $10,000 to $14,999 | 304 | 7.5% |
| $15,000 to $24,999 | 437 | 10.8% |
| $25,000 to $34,999 | 466 | 11.5% |
| $35,000 to $49,999 | 502 | 12.4% |
| $50,000 to $74,999 | 531 | 13.1% |
| $75,000 to $99,999 | 466 | 11.5% |
| $100,000 to $149,999 | 624 | 15.4% |
| $150,000 to $199,999 | 150 | 3.7% |
| $200,000+ | 97 | 2.4% |
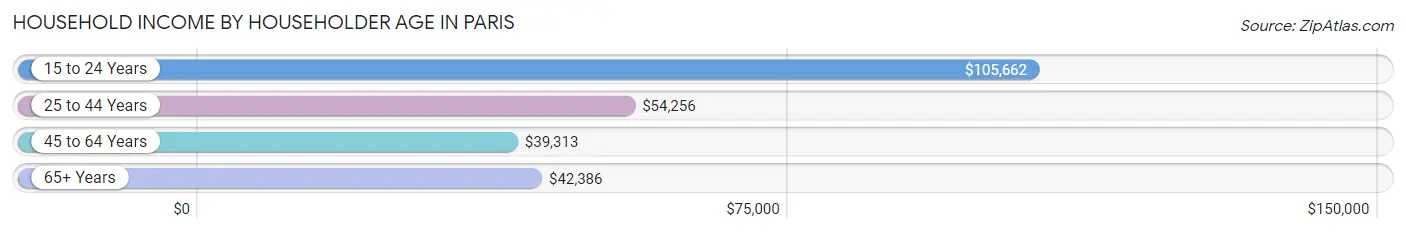
Household Income by Householder Age in Paris
The median household income in Paris is $46,752, with the highest median household income of $105,662 found in the 15 to 24 years age bracket for the primary householder. A total of 150 households (3.7%) fall into this category. Meanwhile, the 45 to 64 years age bracket for the primary householder has the lowest median household income of $39,313, with 1,622 households (40.1%) in this group.
| Income Bracket | # Households | Median Income |
| 15 to 24 Years | 150 (3.7%) | $105,662 |
| 25 to 44 Years | 1,179 (29.1%) | $54,256 |
| 45 to 64 Years | 1,622 (40.1%) | $39,313 |
| 65+ Years | 1,099 (27.1%) | $42,386 |
| Total | 4,050 (100.0%) | $46,752 |
Poverty in Paris
Income Below Poverty by Sex and Age in Paris
With 21.4% poverty level for males and 18.4% for females among the residents of Paris, under 5 year old males and 55 to 64 year old females are the most vulnerable to poverty, with 226 males (50.4%) and 212 females (30.1%) in their respective age groups living below the poverty level.
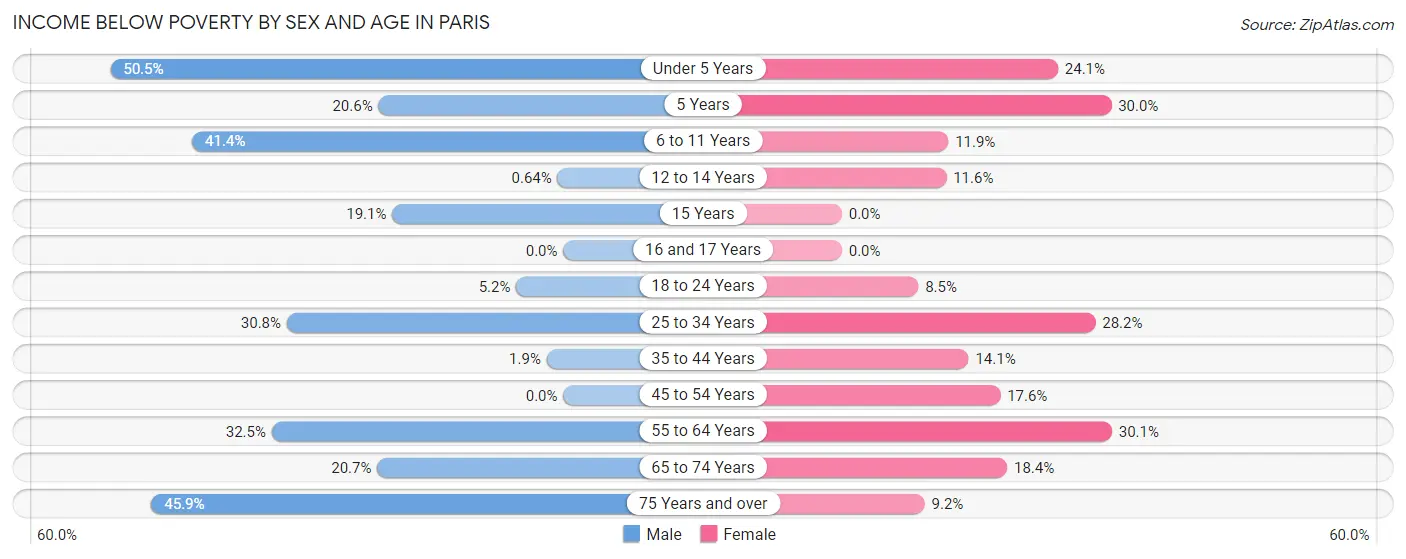
| Age Bracket | Male | Female |
| Under 5 Years | 226 (50.4%) | 77 (24.1%) |
| 5 Years | 28 (20.6%) | 12 (30.0%) |
| 6 to 11 Years | 141 (41.3%) | 32 (11.8%) |
| 12 to 14 Years | 2 (0.6%) | 30 (11.6%) |
| 15 Years | 4 (19.1%) | 0 (0.0%) |
| 16 and 17 Years | 0 (0.0%) | 0 (0.0%) |
| 18 to 24 Years | 26 (5.2%) | 47 (8.5%) |
| 25 to 34 Years | 190 (30.8%) | 199 (28.2%) |
| 35 to 44 Years | 11 (1.8%) | 68 (14.1%) |
| 45 to 54 Years | 0 (0.0%) | 127 (17.6%) |
| 55 to 64 Years | 213 (32.5%) | 212 (30.1%) |
| 65 to 74 Years | 75 (20.7%) | 83 (18.4%) |
| 75 Years and over | 128 (45.9%) | 40 (9.2%) |
| Total | 1,044 (21.4%) | 927 (18.4%) |
Income Above Poverty by Sex and Age in Paris
According to the poverty statistics in Paris, males aged 16 and 17 years and females aged 15 years are the age groups that are most secure financially, with 100.0% of males and 100.0% of females in these age groups living above the poverty line.
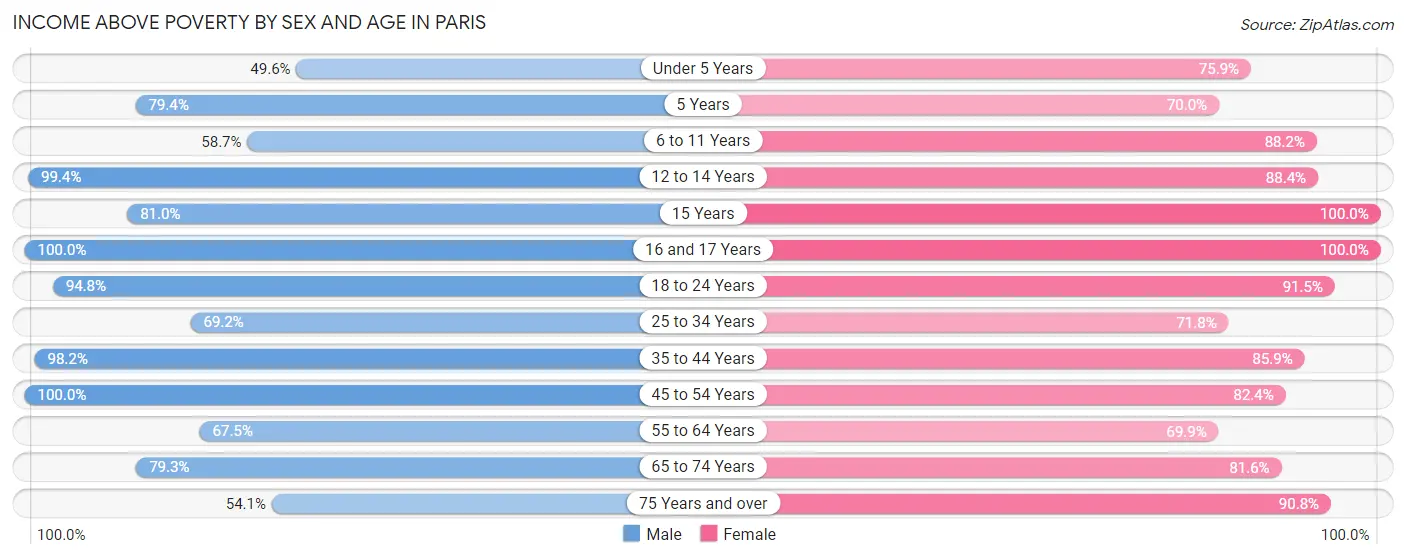
| Age Bracket | Male | Female |
| Under 5 Years | 222 (49.5%) | 243 (75.9%) |
| 5 Years | 108 (79.4%) | 28 (70.0%) |
| 6 to 11 Years | 200 (58.7%) | 238 (88.1%) |
| 12 to 14 Years | 309 (99.4%) | 228 (88.4%) |
| 15 Years | 17 (80.9%) | 25 (100.0%) |
| 16 and 17 Years | 138 (100.0%) | 85 (100.0%) |
| 18 to 24 Years | 470 (94.8%) | 505 (91.5%) |
| 25 to 34 Years | 427 (69.2%) | 506 (71.8%) |
| 35 to 44 Years | 584 (98.2%) | 414 (85.9%) |
| 45 to 54 Years | 470 (100.0%) | 593 (82.4%) |
| 55 to 64 Years | 443 (67.5%) | 493 (69.9%) |
| 65 to 74 Years | 287 (79.3%) | 368 (81.6%) |
| 75 Years and over | 151 (54.1%) | 394 (90.8%) |
| Total | 3,826 (78.6%) | 4,120 (81.6%) |
Income Below Poverty Among Married-Couple Families in Paris
The poverty statistics for married-couple families in Paris show that 9.9% or 153 of the total 1,541 families live below the poverty line. Families with 5 or more children have the highest poverty rate of 54.1%, comprising of 46 families. On the other hand, families with 1 or 2 children have the lowest poverty rate of 2.0%, which includes 7 families.
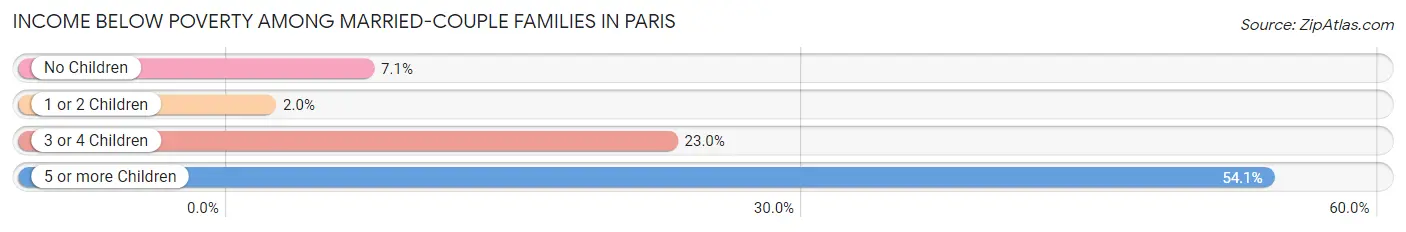
| Children | Above Poverty | Below Poverty |
| No Children | 901 (92.9%) | 69 (7.1%) |
| 1 or 2 Children | 344 (98.0%) | 7 (2.0%) |
| 3 or 4 Children | 104 (77.0%) | 31 (23.0%) |
| 5 or more Children | 39 (45.9%) | 46 (54.1%) |
| Total | 1,388 (90.1%) | 153 (9.9%) |
Income Below Poverty Among Single-Parent Households in Paris
According to the poverty data in Paris, 42.9% or 158 single-father households and 16.6% or 82 single-mother households are living below the poverty line. Among single-father households, those with no children have the highest poverty rate, with 77 households (57.9%) experiencing poverty. Likewise, among single-mother households, those with 3 or 4 children have the highest poverty rate, with 23 households (54.8%) falling below the poverty line.
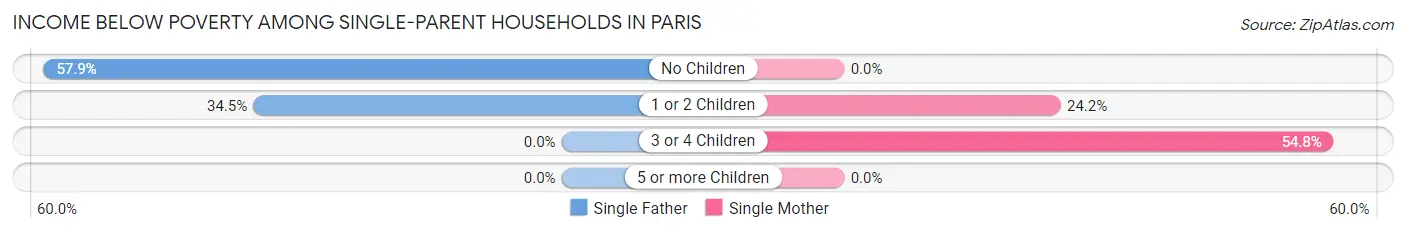
| Children | Single Father | Single Mother |
| No Children | 77 (57.9%) | 0 (0.0%) |
| 1 or 2 Children | 81 (34.5%) | 59 (24.2%) |
| 3 or 4 Children | 0 (0.0%) | 23 (54.8%) |
| 5 or more Children | 0 (0.0%) | 0 (0.0%) |
| Total | 158 (42.9%) | 82 (16.6%) |
Income Below Poverty Among Married-Couple vs Single-Parent Households in Paris
The poverty data for Paris shows that 153 of the married-couple family households (9.9%) and 240 of the single-parent households (27.9%) are living below the poverty level. Within the married-couple family households, those with 5 or more children have the highest poverty rate, with 46 households (54.1%) falling below the poverty line. Among the single-parent households, those with 3 or 4 children have the highest poverty rate, with 23 household (54.8%) living below poverty.
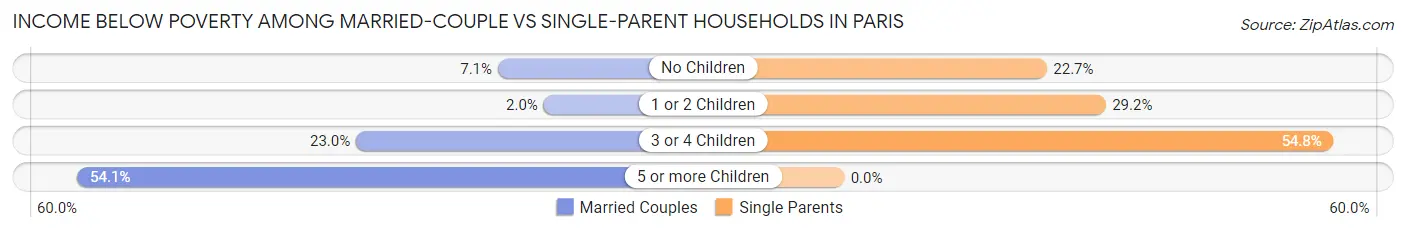
| Children | Married-Couple Families | Single-Parent Households |
| No Children | 69 (7.1%) | 77 (22.7%) |
| 1 or 2 Children | 7 (2.0%) | 140 (29.2%) |
| 3 or 4 Children | 31 (23.0%) | 23 (54.8%) |
| 5 or more Children | 46 (54.1%) | 0 (0.0%) |
| Total | 153 (9.9%) | 240 (27.9%) |
Race in Paris
The most populous races in Paris are White / Caucasian (8,468 | 83.5%), Black / African American (831 | 8.2%), and Two or more Races (695 | 6.9%).
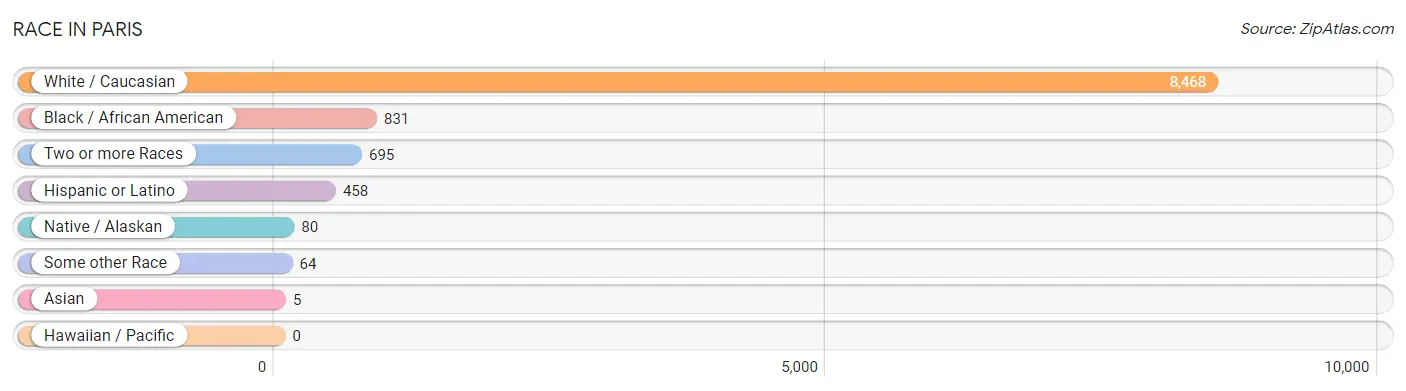
| Race | # Population | % Population |
| Asian | 5 | 0.1% |
| Black / African American | 831 | 8.2% |
| Hawaiian / Pacific | 0 | 0.0% |
| Hispanic or Latino | 458 | 4.5% |
| Native / Alaskan | 80 | 0.8% |
| White / Caucasian | 8,468 | 83.5% |
| Two or more Races | 695 | 6.9% |
| Some other Race | 64 | 0.6% |
| Total | 10,143 | 100.0% |
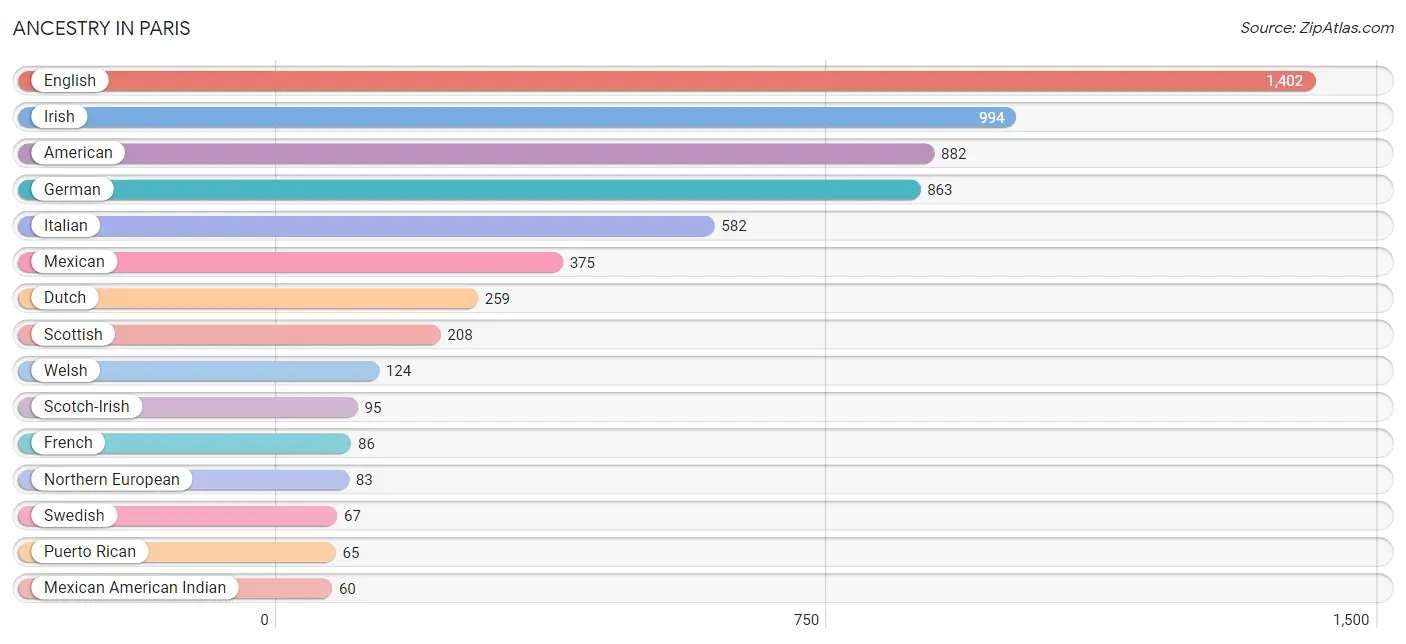
Ancestry in Paris
The most populous ancestries reported in Paris are English (1,402 | 13.8%), Irish (994 | 9.8%), American (882 | 8.7%), German (863 | 8.5%), and Italian (582 | 5.7%), together accounting for 46.6% of all Paris residents.
| Ancestry | # Population | % Population |
| African | 18 | 0.2% |
| American | 882 | 8.7% |
| British | 23 | 0.2% |
| Canadian | 8 | 0.1% |
| Central American Indian | 36 | 0.4% |
| Danish | 15 | 0.2% |
| Dutch | 259 | 2.5% |
| English | 1,402 | 13.8% |
| European | 55 | 0.5% |
| French | 86 | 0.9% |
| French Canadian | 7 | 0.1% |
| German | 863 | 8.5% |
| Indian (Asian) | 18 | 0.2% |
| Irish | 994 | 9.8% |
| Italian | 582 | 5.7% |
| Mexican | 375 | 3.7% |
| Mexican American Indian | 60 | 0.6% |
| Mongolian | 18 | 0.2% |
| Northern European | 83 | 0.8% |
| Norwegian | 13 | 0.1% |
| Polish | 17 | 0.2% |
| Portuguese | 34 | 0.3% |
| Puerto Rican | 65 | 0.6% |
| Scandinavian | 36 | 0.4% |
| Scotch-Irish | 95 | 0.9% |
| Scottish | 208 | 2.1% |
| Sioux | 7 | 0.1% |
| South American | 18 | 0.2% |
| Subsaharan African | 55 | 0.5% |
| Swedish | 67 | 0.7% |
| Ukrainian | 7 | 0.1% |
| Welsh | 124 | 1.2% | View All 32 Rows |
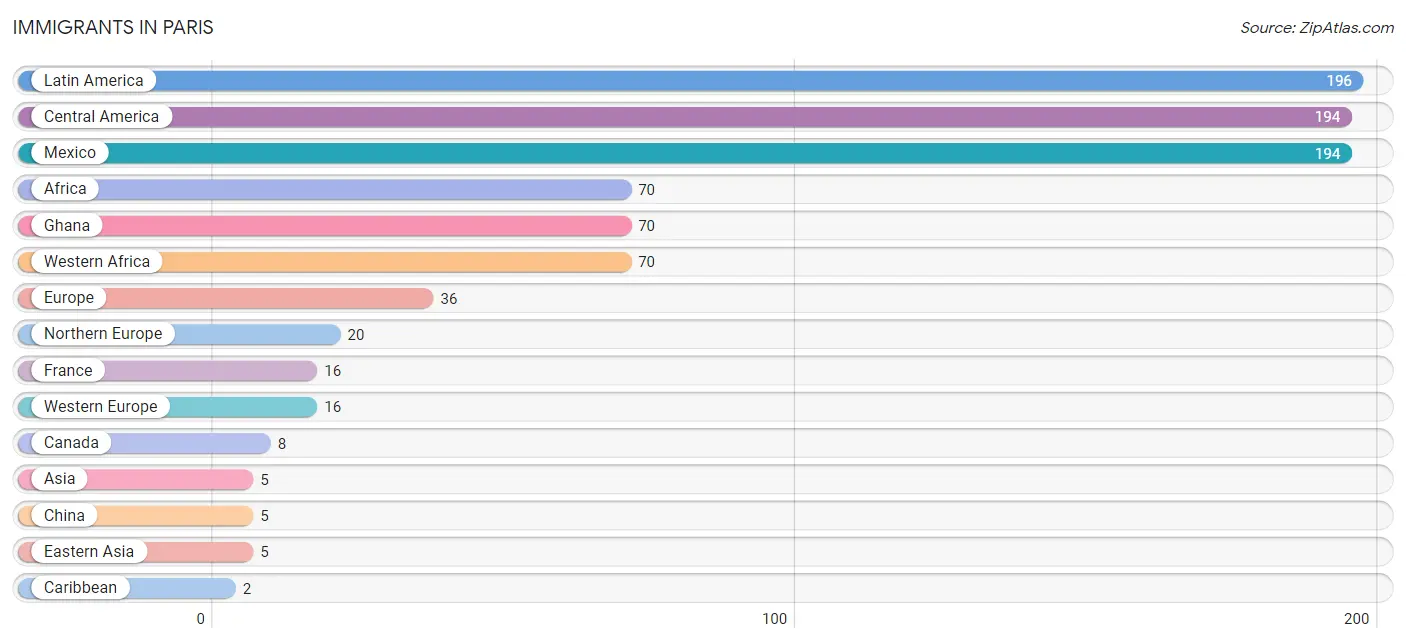
Immigrants in Paris
The most numerous immigrant groups reported in Paris came from Latin America (196 | 1.9%), Central America (194 | 1.9%), Mexico (194 | 1.9%), Africa (70 | 0.7%), and Ghana (70 | 0.7%), together accounting for 7.1% of all Paris residents.
| Immigration Origin | # Population | % Population |
| Africa | 70 | 0.7% |
| Asia | 5 | 0.1% |
| Canada | 8 | 0.1% |
| Caribbean | 2 | 0.0% |
| Central America | 194 | 1.9% |
| China | 5 | 0.1% |
| Eastern Asia | 5 | 0.1% |
| Europe | 36 | 0.4% |
| France | 16 | 0.2% |
| Ghana | 70 | 0.7% |
| Jamaica | 2 | 0.0% |
| Latin America | 196 | 1.9% |
| Mexico | 194 | 1.9% |
| Northern Europe | 20 | 0.2% |
| Western Africa | 70 | 0.7% |
| Western Europe | 16 | 0.2% | View All 16 Rows |
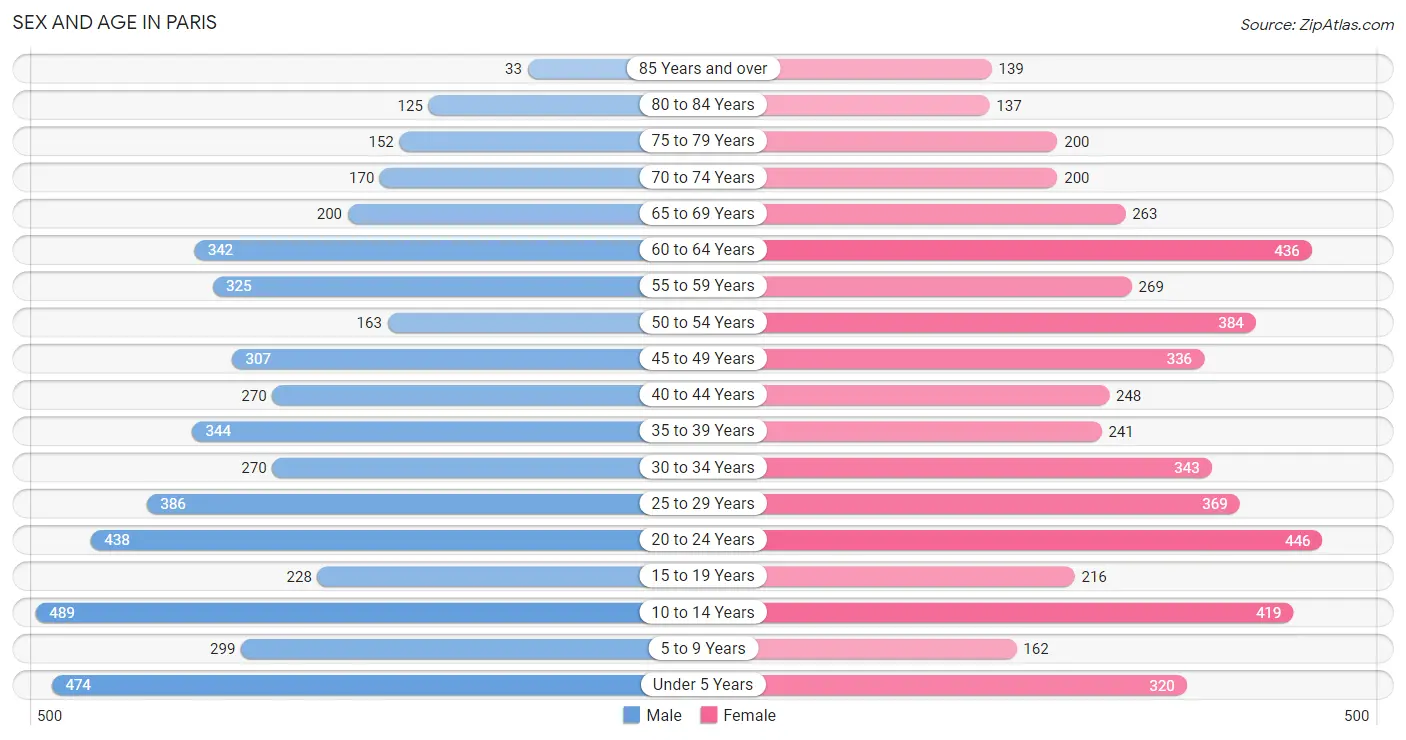
Sex and Age in Paris
Sex and Age in Paris
The most populous age groups in Paris are 10 to 14 Years (489 | 9.8%) for men and 20 to 24 Years (446 | 8.7%) for women.
| Age Bracket | Male | Female |
| Under 5 Years | 474 (9.5%) | 320 (6.2%) |
| 5 to 9 Years | 299 (6.0%) | 162 (3.2%) |
| 10 to 14 Years | 489 (9.8%) | 419 (8.2%) |
| 15 to 19 Years | 228 (4.5%) | 216 (4.2%) |
| 20 to 24 Years | 438 (8.7%) | 446 (8.7%) |
| 25 to 29 Years | 386 (7.7%) | 369 (7.2%) |
| 30 to 34 Years | 270 (5.4%) | 343 (6.7%) |
| 35 to 39 Years | 344 (6.9%) | 241 (4.7%) |
| 40 to 44 Years | 270 (5.4%) | 248 (4.8%) |
| 45 to 49 Years | 307 (6.1%) | 336 (6.6%) |
| 50 to 54 Years | 163 (3.3%) | 384 (7.5%) |
| 55 to 59 Years | 325 (6.5%) | 269 (5.2%) |
| 60 to 64 Years | 342 (6.8%) | 436 (8.5%) |
| 65 to 69 Years | 200 (4.0%) | 263 (5.1%) |
| 70 to 74 Years | 170 (3.4%) | 200 (3.9%) |
| 75 to 79 Years | 152 (3.0%) | 200 (3.9%) |
| 80 to 84 Years | 125 (2.5%) | 137 (2.7%) |
| 85 Years and over | 33 (0.7%) | 139 (2.7%) |
| Total | 5,015 (100.0%) | 5,128 (100.0%) |
Families and Households in Paris
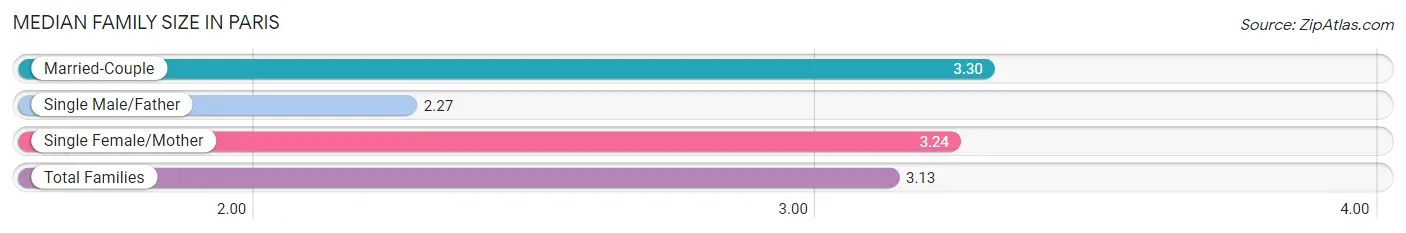
Median Family Size in Paris
The median family size in Paris is 3.13 persons per family, with married-couple families (1,541 | 64.1%) accounting for the largest median family size of 3.3 persons per family. On the other hand, single male/father families (368 | 15.3%) represent the smallest median family size with 2.27 persons per family.
| Family Type | # Families | Family Size |
| Married-Couple | 1,541 (64.1%) | 3.30 |
| Single Male/Father | 368 (15.3%) | 2.27 |
| Single Female/Mother | 493 (20.5%) | 3.24 |
| Total Families | 2,402 (100.0%) | 3.13 |
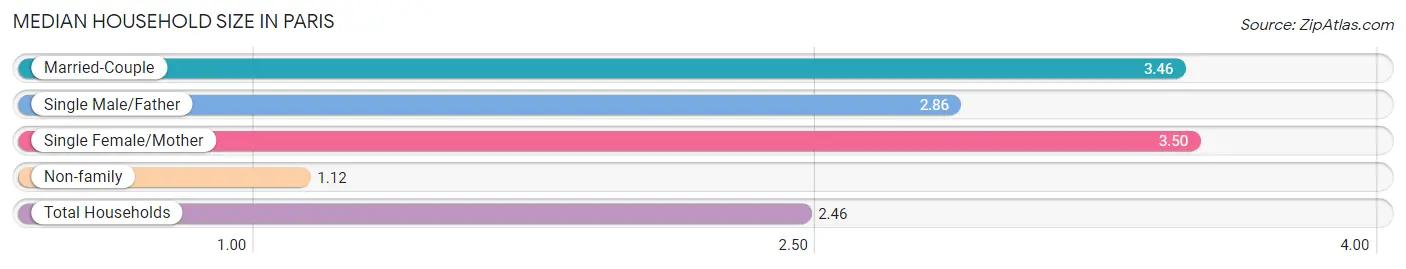
Median Household Size in Paris
The median household size in Paris is 2.46 persons per household, with single female/mother households (493 | 12.2%) accounting for the largest median household size of 3.5 persons per household. non-family households (1,648 | 40.7%) represent the smallest median household size with 1.12 persons per household.
| Household Type | # Households | Household Size |
| Married-Couple | 1,541 (38.1%) | 3.46 |
| Single Male/Father | 368 (9.1%) | 2.86 |
| Single Female/Mother | 493 (12.2%) | 3.50 |
| Non-family | 1,648 (40.7%) | 1.12 |
| Total Households | 4,050 (100.0%) | 2.46 |
Household Size by Marriage Status in Paris
Out of a total of 4,050 households in Paris, 2,402 (59.3%) are family households, while 1,648 (40.7%) are nonfamily households. The most numerous type of family households are 2-person households, comprising 1,075, and the most common type of nonfamily households are 1-person households, comprising 1,519.
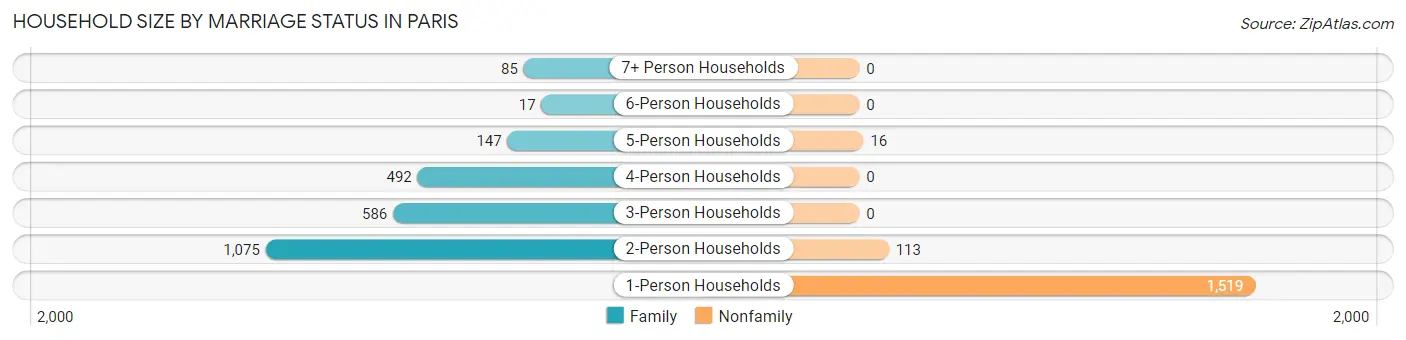
| Household Size | Family Households | Nonfamily Households |
| 1-Person Households | - | 1,519 (37.5%) |
| 2-Person Households | 1,075 (26.5%) | 113 (2.8%) |
| 3-Person Households | 586 (14.5%) | 0 (0.0%) |
| 4-Person Households | 492 (12.1%) | 0 (0.0%) |
| 5-Person Households | 147 (3.6%) | 16 (0.4%) |
| 6-Person Households | 17 (0.4%) | 0 (0.0%) |
| 7+ Person Households | 85 (2.1%) | 0 (0.0%) |
| Total | 2,402 (59.3%) | 1,648 (40.7%) |
Female Fertility in Paris
Fertility by Age in Paris
Average fertility rate in Paris is 35.0 births per 1,000 women. Women in the age bracket of 20 to 34 years have the highest fertility rate with 72.0 births per 1,000 women. Women in the age bracket of 20 to 34 years acount for 100.0% of all women with births.
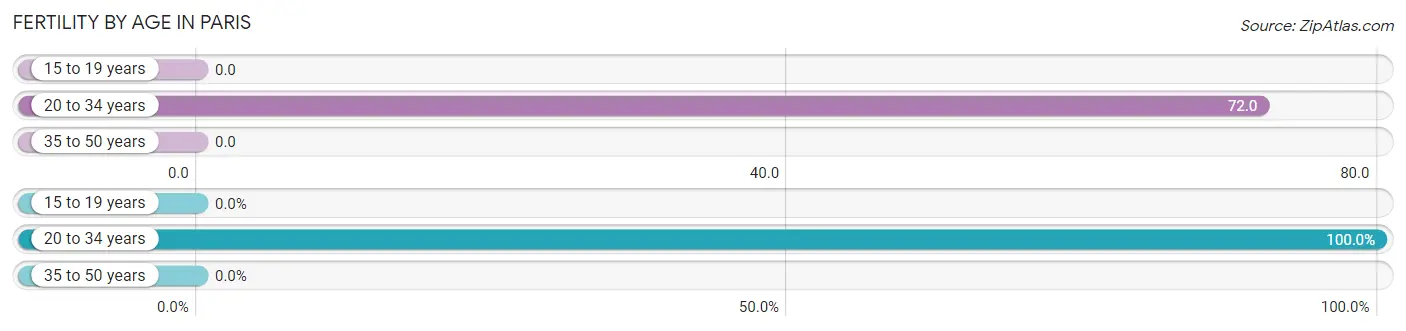
| Age Bracket | Women with Births | Births / 1,000 Women |
| 15 to 19 years | 0 (0.0%) | 0.0 |
| 20 to 34 years | 83 (100.0%) | 72.0 |
| 35 to 50 years | 0 (0.0%) | 0.0 |
| Total | 83 (100.0%) | 35.0 |
Fertility by Age by Marriage Status in Paris
62.7% of women with births (83) in Paris are married. The highest percentage of unmarried women with births falls into 20 to 34 years age bracket with 37.3% of them unmarried at the time of birth, while the lowest percentage of unmarried women with births belong to 20 to 34 years age bracket with 37.4% of them unmarried.
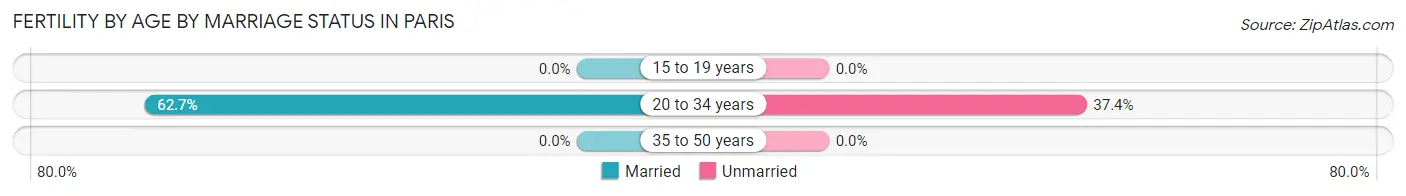
| Age Bracket | Married | Unmarried |
| 15 to 19 years | 0 (0.0%) | 0 (0.0%) |
| 20 to 34 years | 52 (62.6%) | 31 (37.3%) |
| 35 to 50 years | 0 (0.0%) | 0 (0.0%) |
| Total | 52 (62.6%) | 31 (37.3%) |
Fertility by Education in Paris
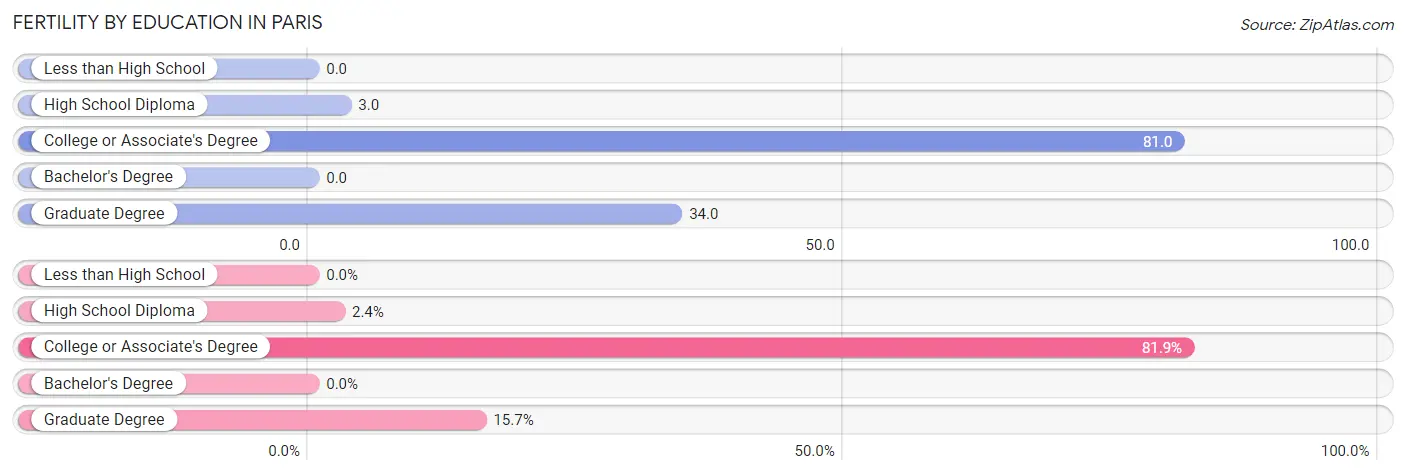
| Educational Attainment | Women with Births | Births / 1,000 Women |
| Less than High School | 0 (0.0%) | 0.0 |
| High School Diploma | 2 (2.4%) | 3.0 |
| College or Associate's Degree | 68 (81.9%) | 81.0 |
| Bachelor's Degree | 0 (0.0%) | 0.0 |
| Graduate Degree | 13 (15.7%) | 34.0 |
| Total | 83 (100.0%) | 35.0 |
Fertility by Education by Marriage Status in Paris
37.3% of women with births in Paris are unmarried. Women with the educational attainment of high school diploma are most likely to be married with 100.0% of them married at childbirth, while women with the educational attainment of college or associate's degree are least likely to be married with 45.6% of them unmarried at childbirth.
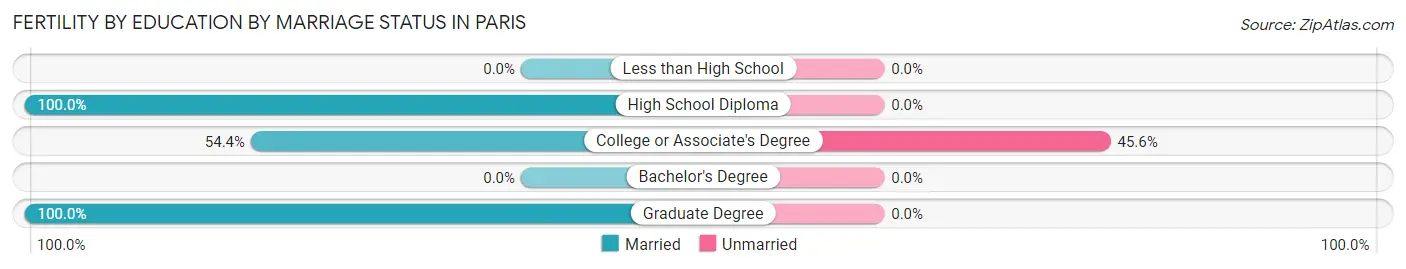
| Educational Attainment | Married | Unmarried |
| Less than High School | 0 (0.0%) | 0 (0.0%) |
| High School Diploma | 2 (100.0%) | 0 (0.0%) |
| College or Associate's Degree | 37 (54.4%) | 31 (45.6%) |
| Bachelor's Degree | 0 (0.0%) | 0 (0.0%) |
| Graduate Degree | 13 (100.0%) | 0 (0.0%) |
| Total | 52 (62.6%) | 31 (37.3%) |
Employment Characteristics in Paris
Employment by Class of Employer in Paris
Among the 4,258 employed individuals in Paris, private company employees (2,909 | 68.3%), not-for-profit organizations (465 | 10.9%), and self-employed (not incorporated) (285 | 6.7%) make up the most common classes of employment.
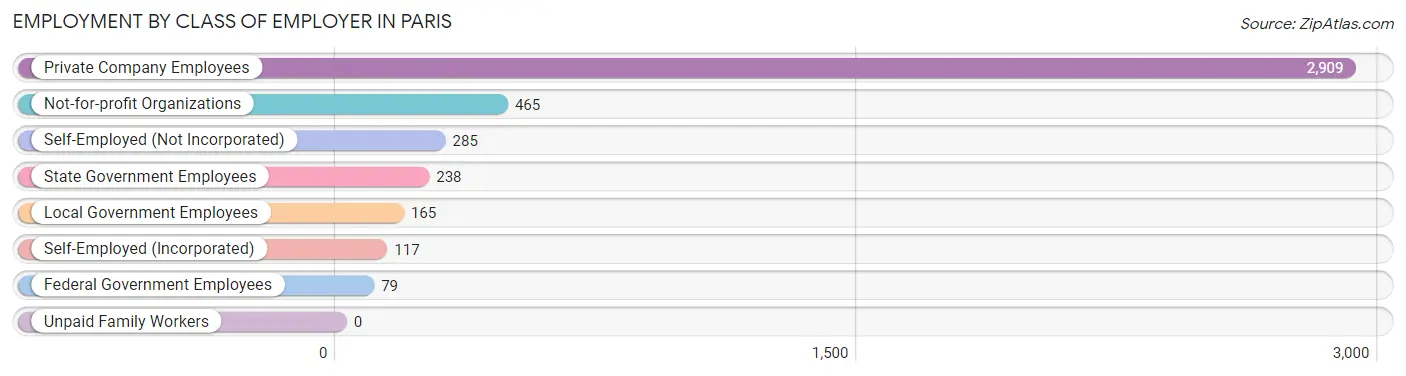
| Employer Class | # Employees | % Employees |
| Private Company Employees | 2,909 | 68.3% |
| Self-Employed (Incorporated) | 117 | 2.8% |
| Self-Employed (Not Incorporated) | 285 | 6.7% |
| Not-for-profit Organizations | 465 | 10.9% |
| Local Government Employees | 165 | 3.9% |
| State Government Employees | 238 | 5.6% |
| Federal Government Employees | 79 | 1.9% |
| Unpaid Family Workers | 0 | 0.0% |
| Total | 4,258 | 100.0% |
Employment Status by Age in Paris
According to the labor force statistics for Paris, out of the total population over 16 years of age (7,934), 58.0% or 4,602 individuals are in the labor force, with 5.9% or 272 of them unemployed. The age group with the highest labor force participation rate is 25 to 29 years, with 82.8% or 625 individuals in the labor force. Within the labor force, the 60 to 64 years age range has the highest percentage of unemployed individuals, with 29.4% or 113 of them being unemployed.
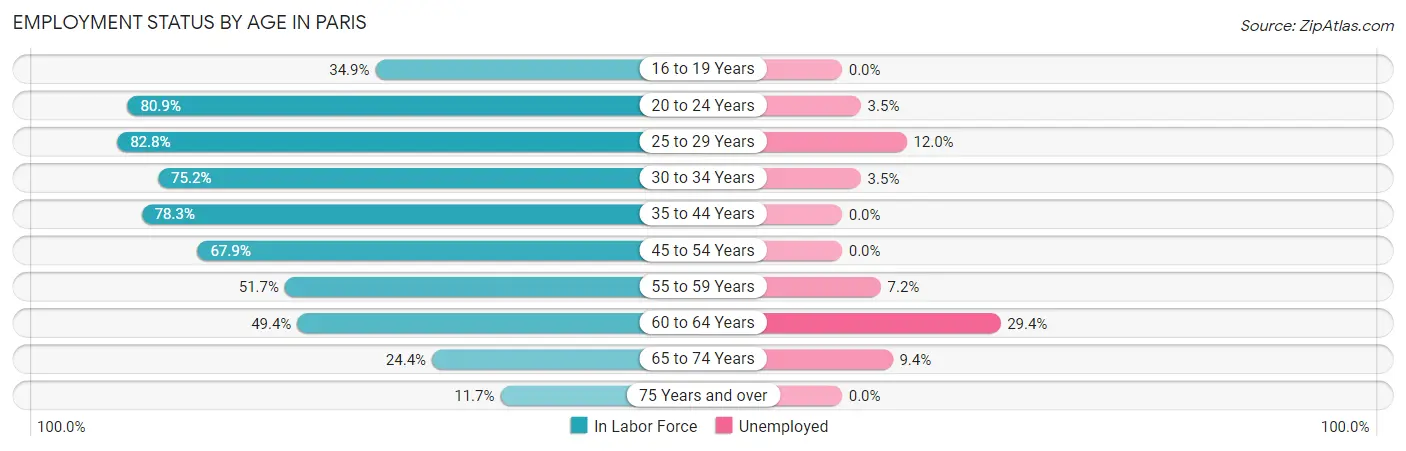
| Age Bracket | In Labor Force | Unemployed |
| 16 to 19 Years | 139 (34.9%) | 0 (0.0%) |
| 20 to 24 Years | 715 (80.9%) | 25 (3.5%) |
| 25 to 29 Years | 625 (82.8%) | 75 (12.0%) |
| 30 to 34 Years | 461 (75.2%) | 16 (3.5%) |
| 35 to 44 Years | 864 (78.3%) | 0 (0.0%) |
| 45 to 54 Years | 808 (67.9%) | 0 (0.0%) |
| 55 to 59 Years | 307 (51.7%) | 22 (7.2%) |
| 60 to 64 Years | 384 (49.4%) | 113 (29.4%) |
| 65 to 74 Years | 203 (24.4%) | 19 (9.4%) |
| 75 Years and over | 92 (11.7%) | 0 (0.0%) |
| Total | 4,602 (58.0%) | 272 (5.9%) |
Employment Status by Educational Attainment in Paris
According to labor force statistics for Paris, 68.5% of individuals (3,448) out of the total population between 25 and 64 years of age (5,033) are in the labor force, with 6.6% or 228 of them being unemployed. The group with the highest labor force participation rate are those with the educational attainment of bachelor's degree or higher, with 77.7% or 853 individuals in the labor force. Within the labor force, individuals with less than high school education have the highest percentage of unemployment, with 17.2% or 68 of them being unemployed.
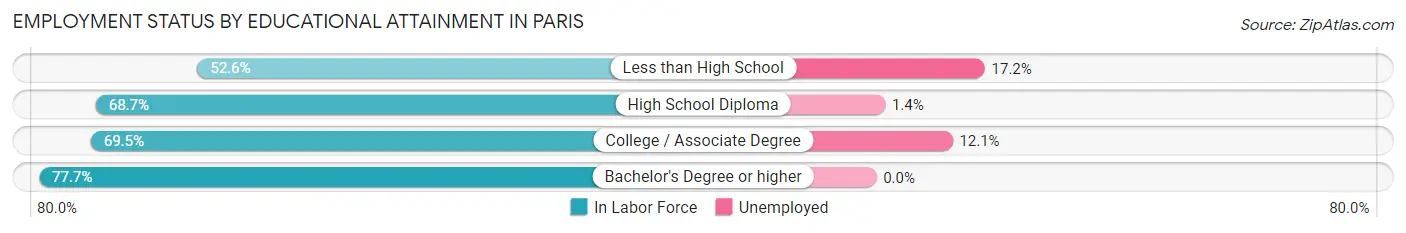
| Educational Attainment | In Labor Force | Unemployed |
| Less than High School | 396 (52.6%) | 130 (17.2%) |
| High School Diploma | 1,007 (68.7%) | 21 (1.4%) |
| College / Associate Degree | 1,193 (69.5%) | 208 (12.1%) |
| Bachelor's Degree or higher | 853 (77.7%) | 0 (0.0%) |
| Total | 3,448 (68.5%) | 332 (6.6%) |
Employment Occupations by Sex in Paris
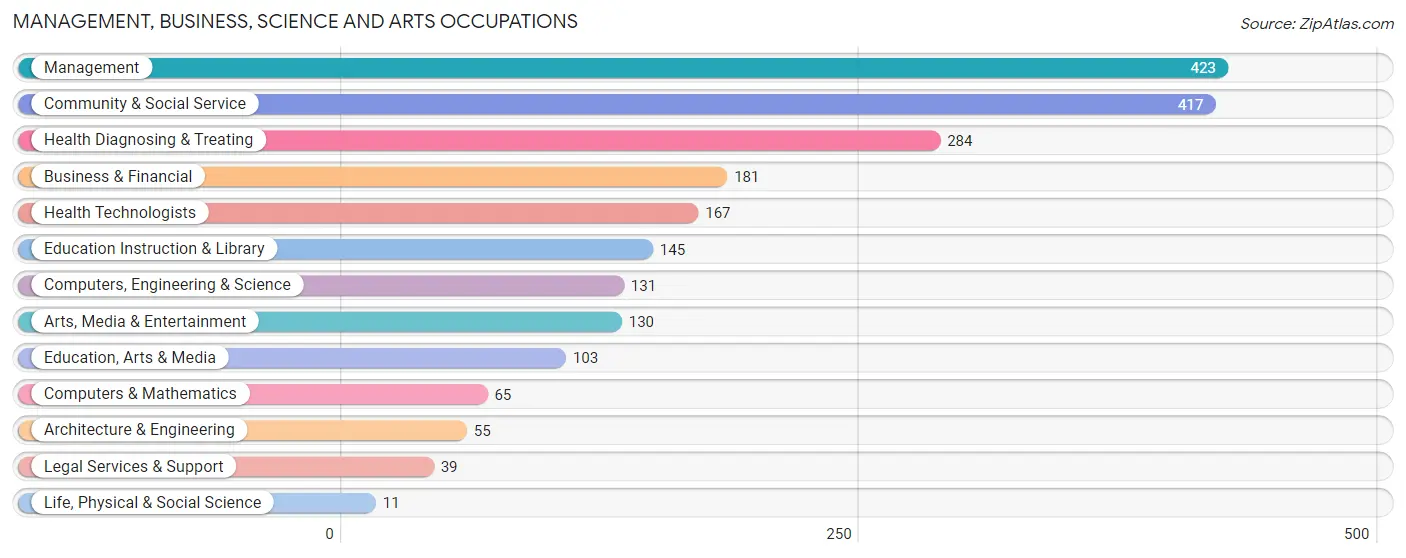
Management, Business, Science and Arts Occupations
The most common Management, Business, Science and Arts occupations in Paris are Management (423 | 9.8%), Community & Social Service (417 | 9.6%), Health Diagnosing & Treating (284 | 6.6%), Business & Financial (181 | 4.2%), and Health Technologists (167 | 3.9%).
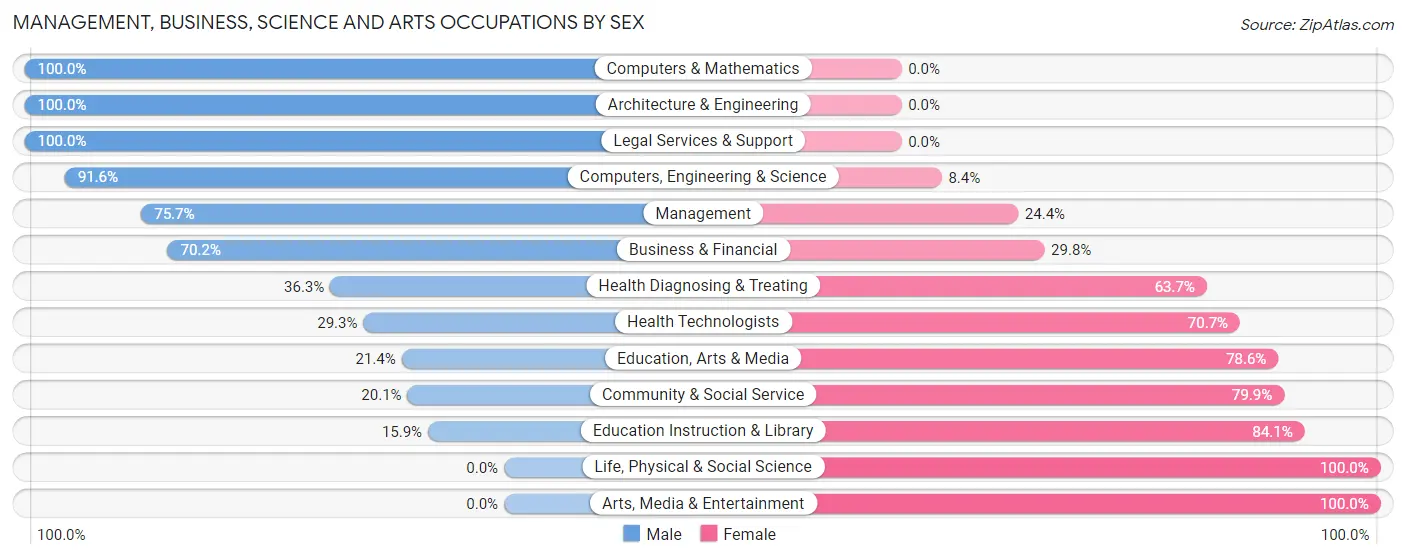
Management, Business, Science and Arts Occupations by Sex
Within the Management, Business, Science and Arts occupations in Paris, the most male-oriented occupations are Computers & Mathematics (100.0%), Architecture & Engineering (100.0%), and Legal Services & Support (100.0%), while the most female-oriented occupations are Life, Physical & Social Science (100.0%), Arts, Media & Entertainment (100.0%), and Education Instruction & Library (84.1%).
| Occupation | Male | Female |
| Management | 320 (75.6%) | 103 (24.3%) |
| Business & Financial | 127 (70.2%) | 54 (29.8%) |
| Computers, Engineering & Science | 120 (91.6%) | 11 (8.4%) |
| Computers & Mathematics | 65 (100.0%) | 0 (0.0%) |
| Architecture & Engineering | 55 (100.0%) | 0 (0.0%) |
| Life, Physical & Social Science | 0 (0.0%) | 11 (100.0%) |
| Community & Social Service | 84 (20.1%) | 333 (79.9%) |
| Education, Arts & Media | 22 (21.4%) | 81 (78.6%) |
| Legal Services & Support | 39 (100.0%) | 0 (0.0%) |
| Education Instruction & Library | 23 (15.9%) | 122 (84.1%) |
| Arts, Media & Entertainment | 0 (0.0%) | 130 (100.0%) |
| Health Diagnosing & Treating | 103 (36.3%) | 181 (63.7%) |
| Health Technologists | 49 (29.3%) | 118 (70.7%) |
| Total (Category) | 754 (52.5%) | 682 (47.5%) |
| Total (Overall) | 2,233 (51.6%) | 2,095 (48.4%) |
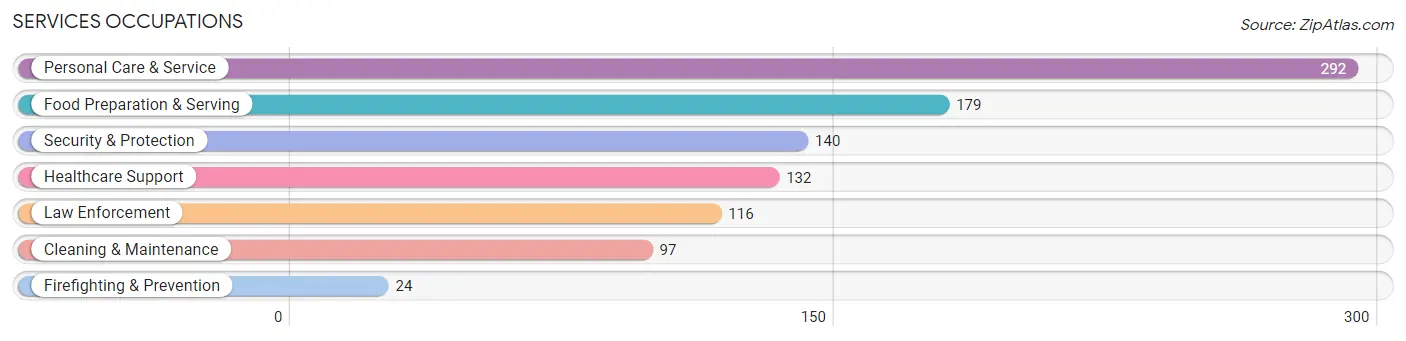
Services Occupations
The most common Services occupations in Paris are Personal Care & Service (292 | 6.8%), Food Preparation & Serving (179 | 4.1%), Security & Protection (140 | 3.2%), Healthcare Support (132 | 3.0%), and Law Enforcement (116 | 2.7%).
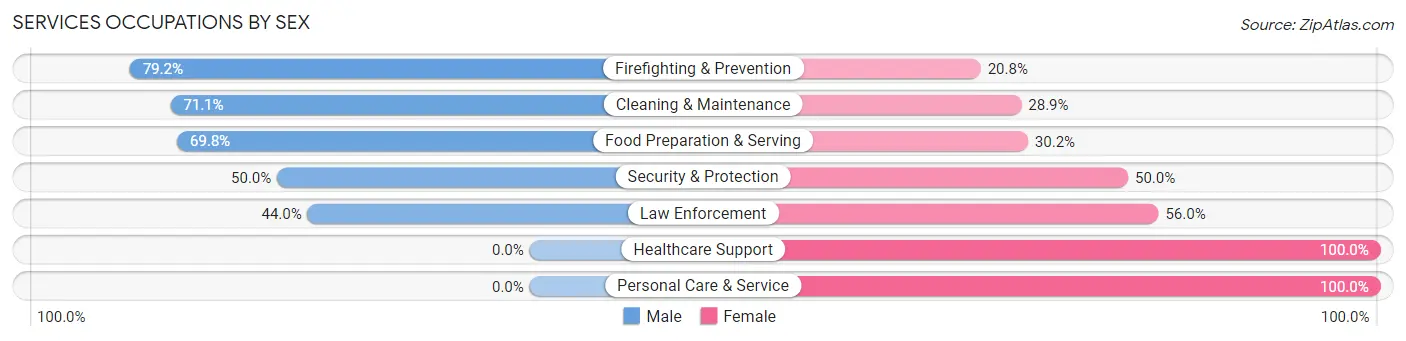
Services Occupations by Sex
Within the Services occupations in Paris, the most male-oriented occupations are Firefighting & Prevention (79.2%), Cleaning & Maintenance (71.1%), and Food Preparation & Serving (69.8%), while the most female-oriented occupations are Healthcare Support (100.0%), Personal Care & Service (100.0%), and Law Enforcement (56.0%).
| Occupation | Male | Female |
| Healthcare Support | 0 (0.0%) | 132 (100.0%) |
| Security & Protection | 70 (50.0%) | 70 (50.0%) |
| Firefighting & Prevention | 19 (79.2%) | 5 (20.8%) |
| Law Enforcement | 51 (44.0%) | 65 (56.0%) |
| Food Preparation & Serving | 125 (69.8%) | 54 (30.2%) |
| Cleaning & Maintenance | 69 (71.1%) | 28 (28.9%) |
| Personal Care & Service | 0 (0.0%) | 292 (100.0%) |
| Total (Category) | 264 (31.4%) | 576 (68.6%) |
| Total (Overall) | 2,233 (51.6%) | 2,095 (48.4%) |
Sales and Office Occupations
The most common Sales and Office occupations in Paris are Office & Administration (583 | 13.5%), and Sales & Related (545 | 12.6%).

Sales and Office Occupations by Sex

| Occupation | Male | Female |
| Sales & Related | 272 (49.9%) | 273 (50.1%) |
| Office & Administration | 177 (30.4%) | 406 (69.6%) |
| Total (Category) | 449 (39.8%) | 679 (60.2%) |
| Total (Overall) | 2,233 (51.6%) | 2,095 (48.4%) |
Natural Resources, Construction and Maintenance Occupations
The most common Natural Resources, Construction and Maintenance occupations in Paris are Construction & Extraction (194 | 4.5%), Farming, Fishing & Forestry (121 | 2.8%), and Installation, Maintenance & Repair (48 | 1.1%).

Natural Resources, Construction and Maintenance Occupations by Sex

| Occupation | Male | Female |
| Farming, Fishing & Forestry | 121 (100.0%) | 0 (0.0%) |
| Construction & Extraction | 194 (100.0%) | 0 (0.0%) |
| Installation, Maintenance & Repair | 48 (100.0%) | 0 (0.0%) |
| Total (Category) | 363 (100.0%) | 0 (0.0%) |
| Total (Overall) | 2,233 (51.6%) | 2,095 (48.4%) |
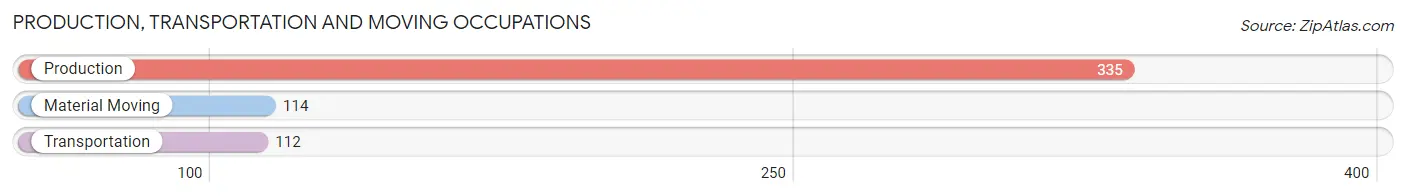
Production, Transportation and Moving Occupations
The most common Production, Transportation and Moving occupations in Paris are Production (335 | 7.7%), Material Moving (114 | 2.6%), and Transportation (112 | 2.6%).
Production, Transportation and Moving Occupations by Sex

| Occupation | Male | Female |
| Production | 183 (54.6%) | 152 (45.4%) |
| Transportation | 106 (94.6%) | 6 (5.4%) |
| Material Moving | 114 (100.0%) | 0 (0.0%) |
| Total (Category) | 403 (71.8%) | 158 (28.2%) |
| Total (Overall) | 2,233 (51.6%) | 2,095 (48.4%) |
Employment Industries by Sex in Paris
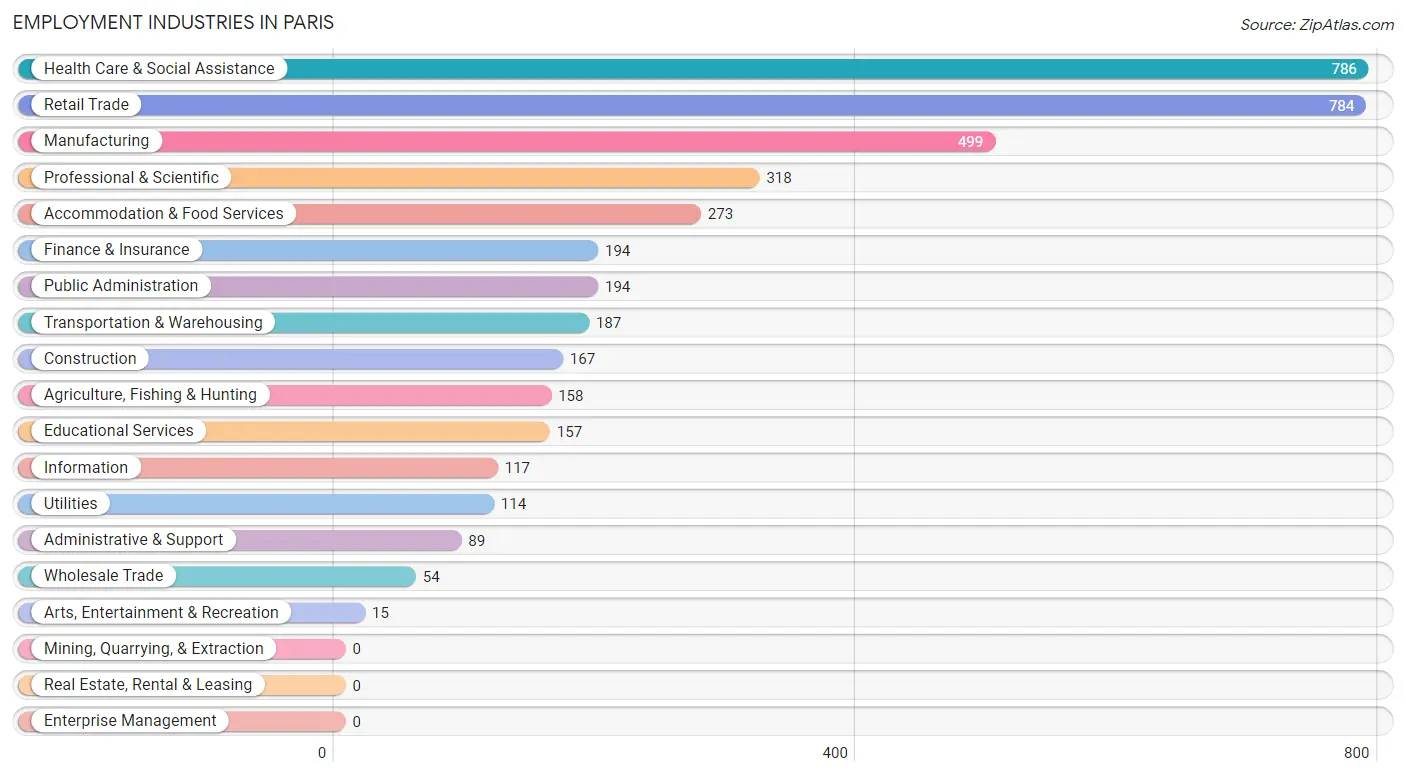
Employment Industries in Paris
The major employment industries in Paris include Health Care & Social Assistance (786 | 18.2%), Retail Trade (784 | 18.1%), Manufacturing (499 | 11.5%), Professional & Scientific (318 | 7.3%), and Accommodation & Food Services (273 | 6.3%).
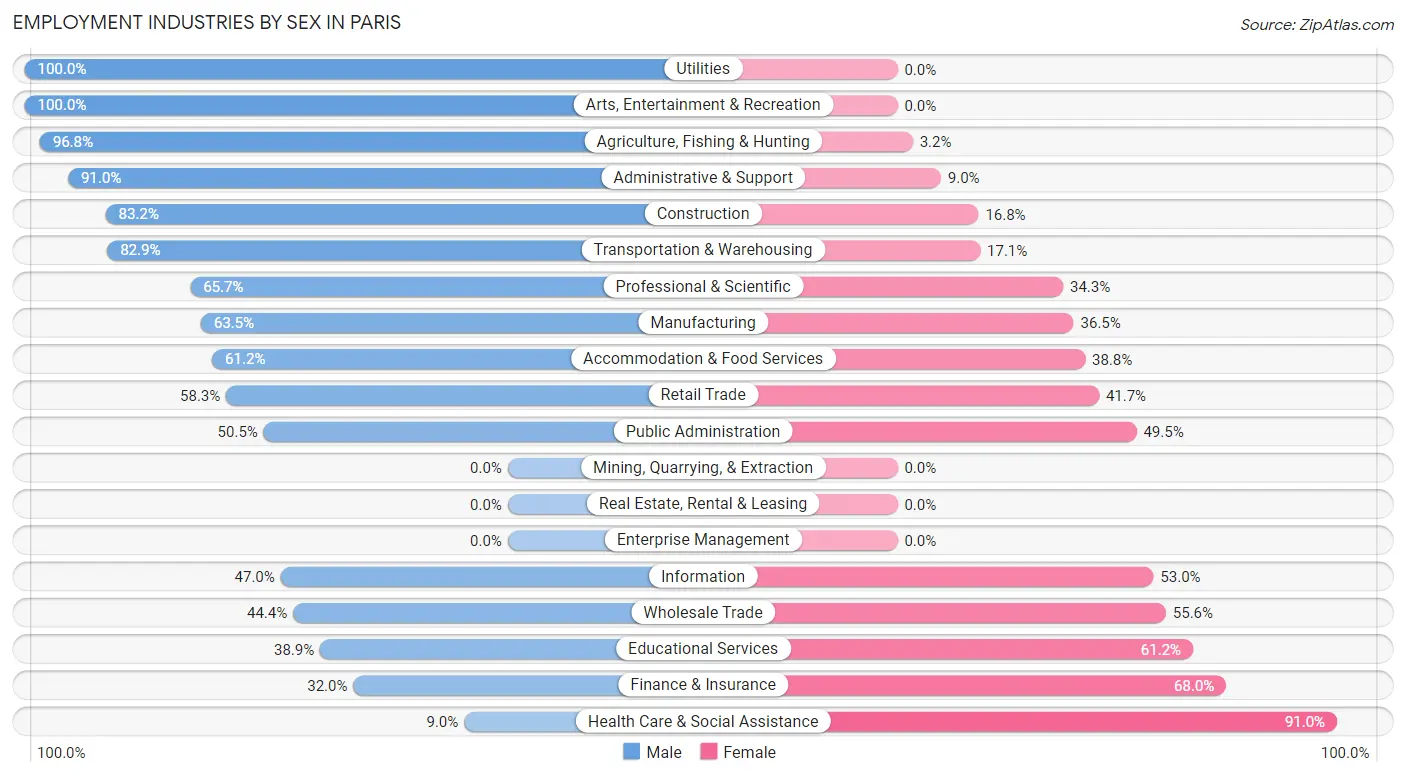
Employment Industries by Sex in Paris
The Paris industries that see more men than women are Utilities (100.0%), Arts, Entertainment & Recreation (100.0%), and Agriculture, Fishing & Hunting (96.8%), whereas the industries that tend to have a higher number of women are Health Care & Social Assistance (91.0%), Finance & Insurance (68.0%), and Educational Services (61.2%).
| Industry | Male | Female |
| Agriculture, Fishing & Hunting | 153 (96.8%) | 5 (3.2%) |
| Mining, Quarrying, & Extraction | 0 (0.0%) | 0 (0.0%) |
| Construction | 139 (83.2%) | 28 (16.8%) |
| Manufacturing | 317 (63.5%) | 182 (36.5%) |
| Wholesale Trade | 24 (44.4%) | 30 (55.6%) |
| Retail Trade | 457 (58.3%) | 327 (41.7%) |
| Transportation & Warehousing | 155 (82.9%) | 32 (17.1%) |
| Utilities | 114 (100.0%) | 0 (0.0%) |
| Information | 55 (47.0%) | 62 (53.0%) |
| Finance & Insurance | 62 (32.0%) | 132 (68.0%) |
| Real Estate, Rental & Leasing | 0 (0.0%) | 0 (0.0%) |
| Professional & Scientific | 209 (65.7%) | 109 (34.3%) |
| Enterprise Management | 0 (0.0%) | 0 (0.0%) |
| Administrative & Support | 81 (91.0%) | 8 (9.0%) |
| Educational Services | 61 (38.9%) | 96 (61.2%) |
| Health Care & Social Assistance | 71 (9.0%) | 715 (91.0%) |
| Arts, Entertainment & Recreation | 15 (100.0%) | 0 (0.0%) |
| Accommodation & Food Services | 167 (61.2%) | 106 (38.8%) |
| Public Administration | 98 (50.5%) | 96 (49.5%) |
| Total | 2,233 (51.6%) | 2,095 (48.4%) |
Education in Paris
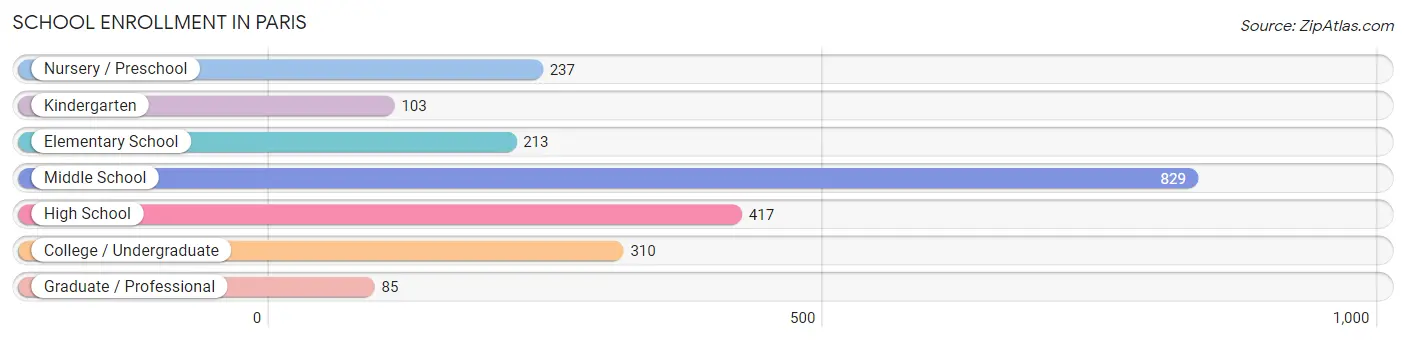
School Enrollment in Paris
The most common levels of schooling among the 2,194 students in Paris are middle school (829 | 37.8%), high school (417 | 19.0%), and college / undergraduate (310 | 14.1%).
| School Level | # Students | % Students |
| Nursery / Preschool | 237 | 10.8% |
| Kindergarten | 103 | 4.7% |
| Elementary School | 213 | 9.7% |
| Middle School | 829 | 37.8% |
| High School | 417 | 19.0% |
| College / Undergraduate | 310 | 14.1% |
| Graduate / Professional | 85 | 3.9% |
| Total | 2,194 | 100.0% |
School Enrollment by Age by Funding Source in Paris
Out of a total of 2,194 students who are enrolled in schools in Paris, 463 (21.1%) attend a private institution, while the remaining 1,731 (78.9%) are enrolled in public schools. The age group of 10 to 14 year olds has the highest likelihood of being enrolled in private schools, with 396 (43.6% in the age bracket) enrolled. Conversely, the age group of 3 to 4 year olds has the lowest likelihood of being enrolled in a private school, with 84 (100.0% in the age bracket) attending a public institution.
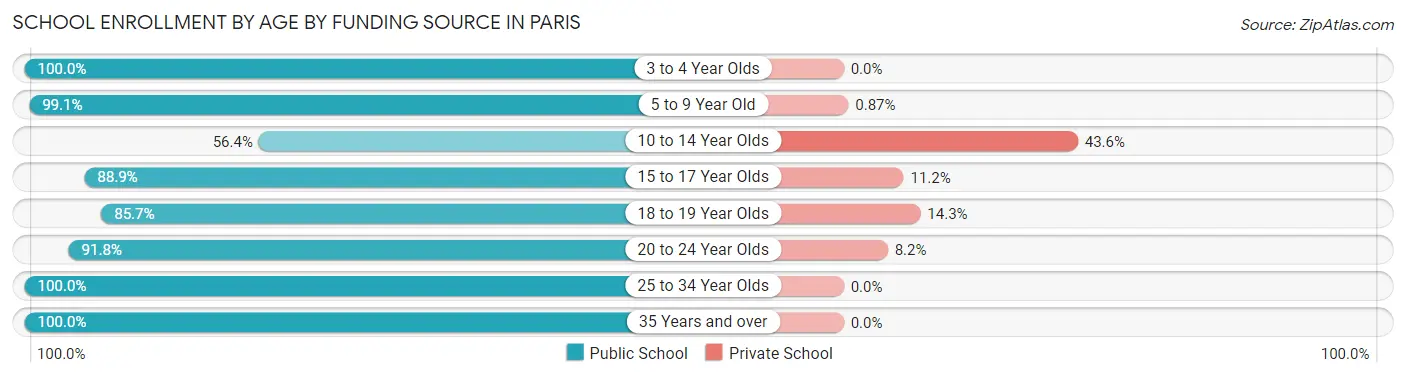
| Age Bracket | Public School | Private School |
| 3 to 4 Year Olds | 84 (100.0%) | 0 (0.0%) |
| 5 to 9 Year Old | 457 (99.1%) | 4 (0.9%) |
| 10 to 14 Year Olds | 512 (56.4%) | 396 (43.6%) |
| 15 to 17 Year Olds | 239 (88.8%) | 30 (11.2%) |
| 18 to 19 Year Olds | 96 (85.7%) | 16 (14.3%) |
| 20 to 24 Year Olds | 190 (91.8%) | 17 (8.2%) |
| 25 to 34 Year Olds | 133 (100.0%) | 0 (0.0%) |
| 35 Years and over | 20 (100.0%) | 0 (0.0%) |
| Total | 1,731 (78.9%) | 463 (21.1%) |
Educational Attainment by Field of Study in Paris
Visual & performing arts (179 | 12.4%), business (164 | 11.3%), bio, nature & agricultural (155 | 10.7%), literature & languages (150 | 10.4%), and social sciences (147 | 10.2%) are the most common fields of study among 1,446 individuals in Paris who have obtained a bachelor's degree or higher.
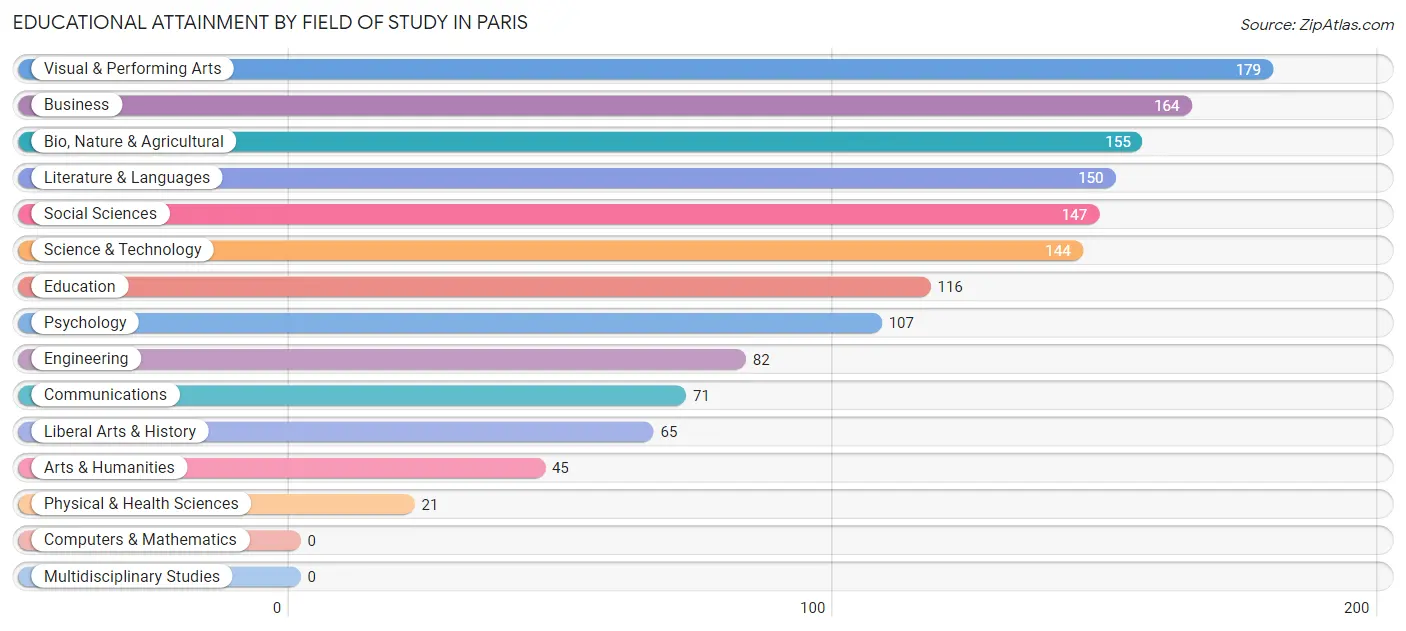
| Field of Study | # Graduates | % Graduates |
| Computers & Mathematics | 0 | 0.0% |
| Bio, Nature & Agricultural | 155 | 10.7% |
| Physical & Health Sciences | 21 | 1.5% |
| Psychology | 107 | 7.4% |
| Social Sciences | 147 | 10.2% |
| Engineering | 82 | 5.7% |
| Multidisciplinary Studies | 0 | 0.0% |
| Science & Technology | 144 | 10.0% |
| Business | 164 | 11.3% |
| Education | 116 | 8.0% |
| Literature & Languages | 150 | 10.4% |
| Liberal Arts & History | 65 | 4.5% |
| Visual & Performing Arts | 179 | 12.4% |
| Communications | 71 | 4.9% |
| Arts & Humanities | 45 | 3.1% |
| Total | 1,446 | 100.0% |
Transportation & Commute in Paris
Vehicle Availability by Sex in Paris
The most prevalent vehicle ownership categories in Paris are males with 2 vehicles (906, accounting for 40.9%) and females with 2 vehicles (742, making up 44.4%).
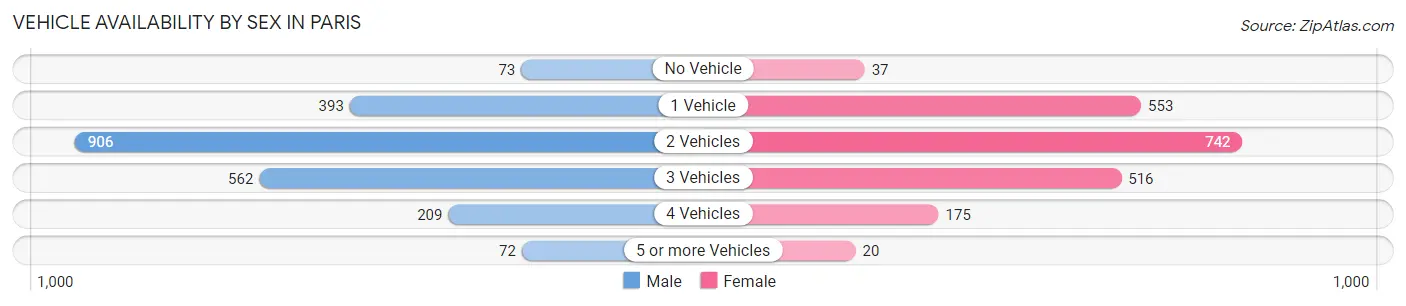
| Vehicles Available | Male | Female |
| No Vehicle | 73 (3.3%) | 37 (1.8%) |
| 1 Vehicle | 393 (17.7%) | 553 (27.1%) |
| 2 Vehicles | 906 (40.9%) | 742 (36.3%) |
| 3 Vehicles | 562 (25.4%) | 516 (25.3%) |
| 4 Vehicles | 209 (9.4%) | 175 (8.6%) |
| 5 or more Vehicles | 72 (3.3%) | 20 (1.0%) |
| Total | 2,215 (100.0%) | 2,043 (100.0%) |
Commute Time in Paris
The most frequently occuring commute durations in Paris are 5 to 9 minutes (801 commuters, 20.6%), 20 to 24 minutes (634 commuters, 16.3%), and 30 to 34 minutes (506 commuters, 13.0%).
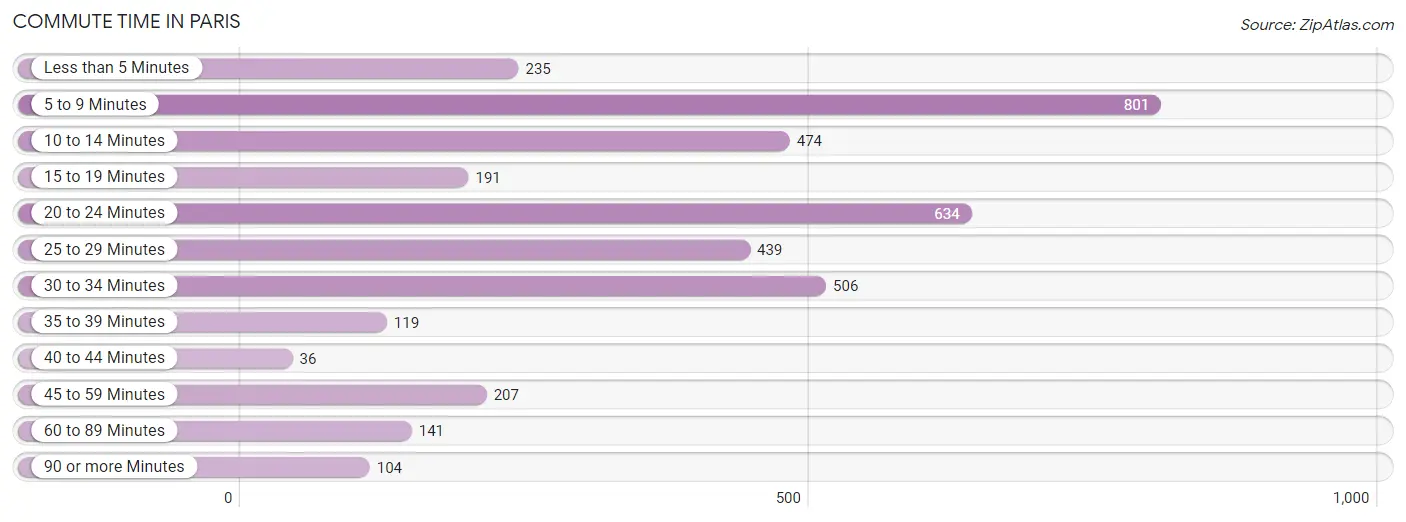
| Commute Time | # Commuters | % Commuters |
| Less than 5 Minutes | 235 | 6.0% |
| 5 to 9 Minutes | 801 | 20.6% |
| 10 to 14 Minutes | 474 | 12.2% |
| 15 to 19 Minutes | 191 | 4.9% |
| 20 to 24 Minutes | 634 | 16.3% |
| 25 to 29 Minutes | 439 | 11.3% |
| 30 to 34 Minutes | 506 | 13.0% |
| 35 to 39 Minutes | 119 | 3.1% |
| 40 to 44 Minutes | 36 | 0.9% |
| 45 to 59 Minutes | 207 | 5.3% |
| 60 to 89 Minutes | 141 | 3.6% |
| 90 or more Minutes | 104 | 2.7% |
Commute Time by Sex in Paris
The most common commute times in Paris are 5 to 9 minutes (409 commuters, 20.8%) for males and 5 to 9 minutes (392 commuters, 20.4%) for females.
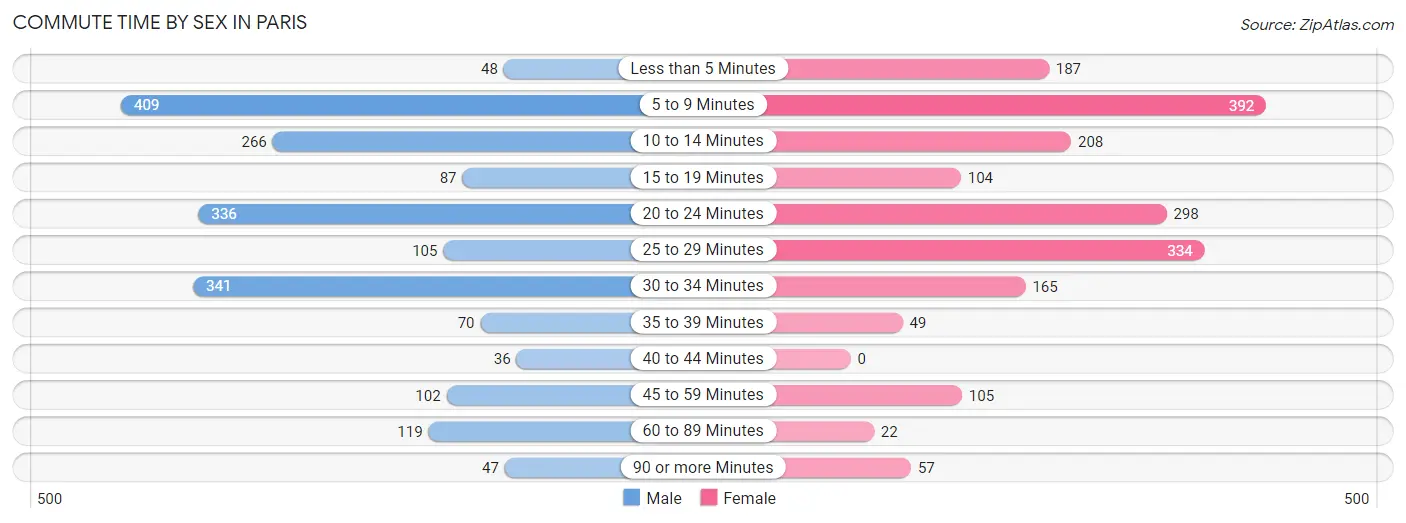
| Commute Time | Male | Female |
| Less than 5 Minutes | 48 (2.4%) | 187 (9.7%) |
| 5 to 9 Minutes | 409 (20.8%) | 392 (20.4%) |
| 10 to 14 Minutes | 266 (13.5%) | 208 (10.8%) |
| 15 to 19 Minutes | 87 (4.4%) | 104 (5.4%) |
| 20 to 24 Minutes | 336 (17.1%) | 298 (15.5%) |
| 25 to 29 Minutes | 105 (5.3%) | 334 (17.4%) |
| 30 to 34 Minutes | 341 (17.3%) | 165 (8.6%) |
| 35 to 39 Minutes | 70 (3.6%) | 49 (2.5%) |
| 40 to 44 Minutes | 36 (1.8%) | 0 (0.0%) |
| 45 to 59 Minutes | 102 (5.2%) | 105 (5.5%) |
| 60 to 89 Minutes | 119 (6.0%) | 22 (1.1%) |
| 90 or more Minutes | 47 (2.4%) | 57 (3.0%) |
Time of Departure to Work by Sex in Paris
The most frequent times of departure to work in Paris are 7:00 AM to 7:29 AM (484, 24.6%) for males and 7:30 AM to 7:59 AM (276, 14.4%) for females.
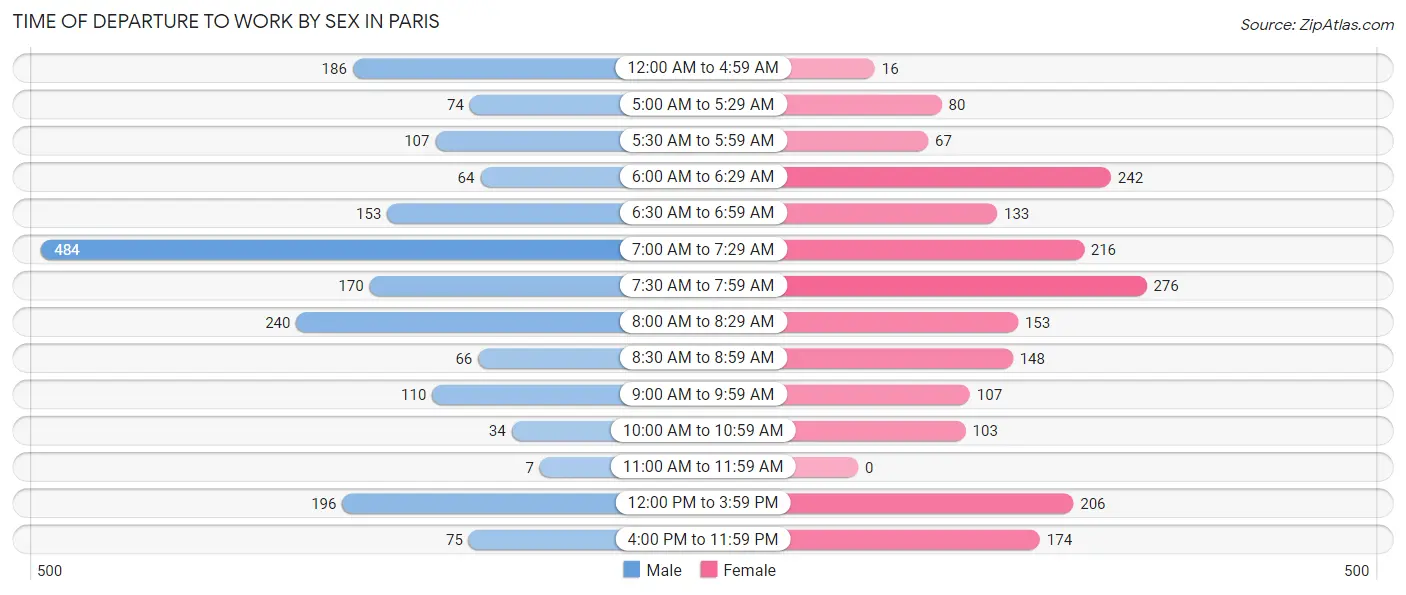
| Time of Departure | Male | Female |
| 12:00 AM to 4:59 AM | 186 (9.5%) | 16 (0.8%) |
| 5:00 AM to 5:29 AM | 74 (3.8%) | 80 (4.2%) |
| 5:30 AM to 5:59 AM | 107 (5.4%) | 67 (3.5%) |
| 6:00 AM to 6:29 AM | 64 (3.3%) | 242 (12.6%) |
| 6:30 AM to 6:59 AM | 153 (7.8%) | 133 (6.9%) |
| 7:00 AM to 7:29 AM | 484 (24.6%) | 216 (11.2%) |
| 7:30 AM to 7:59 AM | 170 (8.6%) | 276 (14.4%) |
| 8:00 AM to 8:29 AM | 240 (12.2%) | 153 (8.0%) |
| 8:30 AM to 8:59 AM | 66 (3.4%) | 148 (7.7%) |
| 9:00 AM to 9:59 AM | 110 (5.6%) | 107 (5.6%) |
| 10:00 AM to 10:59 AM | 34 (1.7%) | 103 (5.4%) |
| 11:00 AM to 11:59 AM | 7 (0.4%) | 0 (0.0%) |
| 12:00 PM to 3:59 PM | 196 (10.0%) | 206 (10.7%) |
| 4:00 PM to 11:59 PM | 75 (3.8%) | 174 (9.1%) |
| Total | 1,966 (100.0%) | 1,921 (100.0%) |
Housing Occupancy in Paris
Occupancy by Ownership in Paris
Of the total 4,050 dwellings in Paris, owner-occupied units account for 2,260 (55.8%), while renter-occupied units make up 1,790 (44.2%).
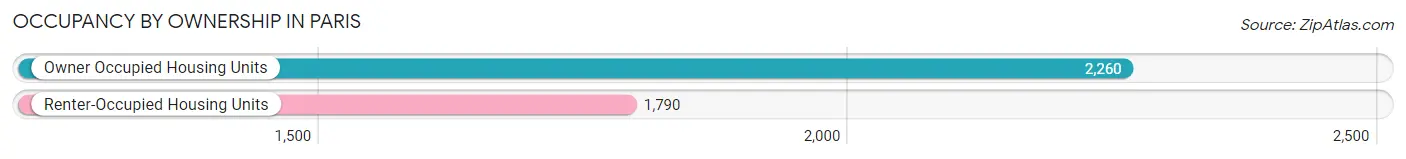
| Occupancy | # Housing Units | % Housing Units |
| Owner Occupied Housing Units | 2,260 | 55.8% |
| Renter-Occupied Housing Units | 1,790 | 44.2% |
| Total Occupied Housing Units | 4,050 | 100.0% |
Occupancy by Household Size in Paris
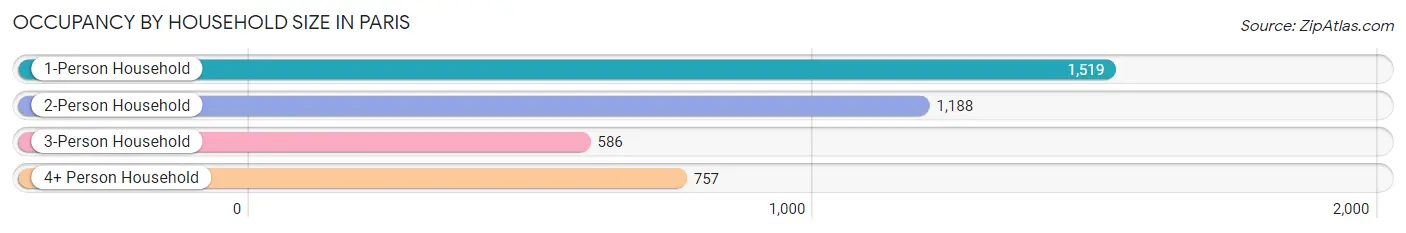
| Household Size | # Housing Units | % Housing Units |
| 1-Person Household | 1,519 | 37.5% |
| 2-Person Household | 1,188 | 29.3% |
| 3-Person Household | 586 | 14.5% |
| 4+ Person Household | 757 | 18.7% |
| Total Housing Units | 4,050 | 100.0% |
Occupancy by Ownership by Household Size in Paris
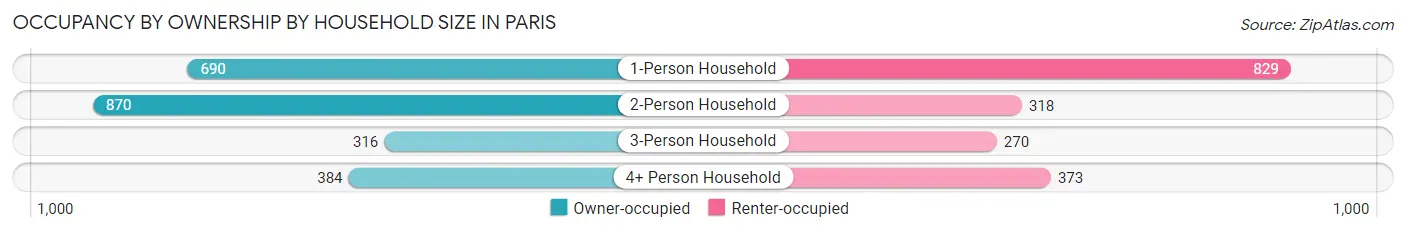
| Household Size | Owner-occupied | Renter-occupied |
| 1-Person Household | 690 (45.4%) | 829 (54.6%) |
| 2-Person Household | 870 (73.2%) | 318 (26.8%) |
| 3-Person Household | 316 (53.9%) | 270 (46.1%) |
| 4+ Person Household | 384 (50.7%) | 373 (49.3%) |
| Total Housing Units | 2,260 (55.8%) | 1,790 (44.2%) |
Occupancy by Educational Attainment in Paris
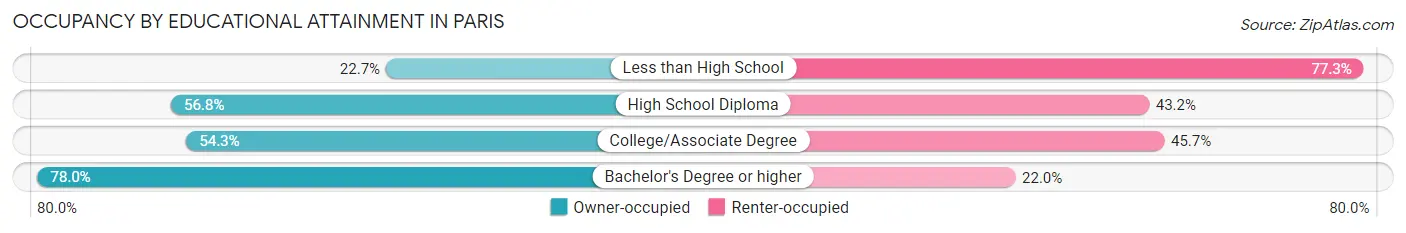
| Household Size | Owner-occupied | Renter-occupied |
| Less than High School | 125 (22.7%) | 426 (77.3%) |
| High School Diploma | 705 (56.8%) | 537 (43.2%) |
| College/Associate Degree | 758 (54.3%) | 637 (45.7%) |
| Bachelor's Degree or higher | 672 (78.0%) | 190 (22.0%) |
Occupancy by Age of Householder in Paris
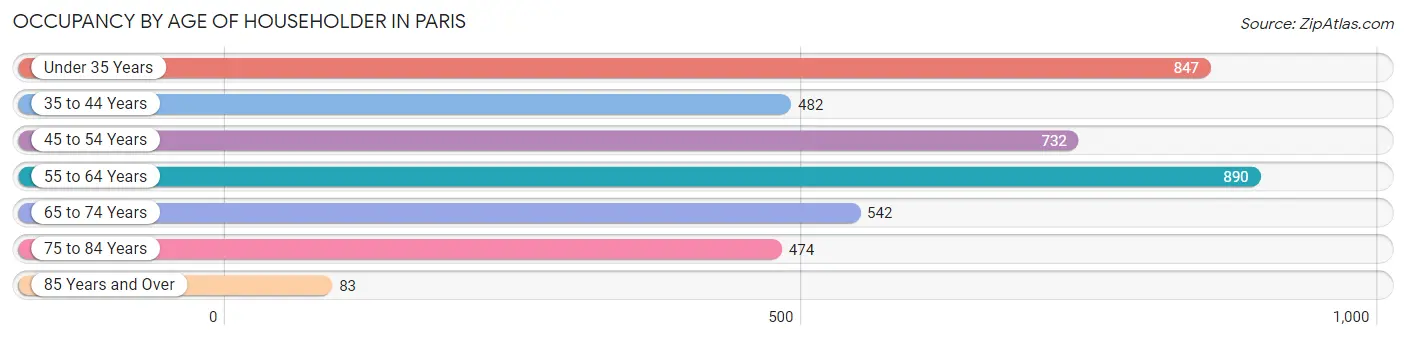
| Age Bracket | # Households | % Households |
| Under 35 Years | 847 | 20.9% |
| 35 to 44 Years | 482 | 11.9% |
| 45 to 54 Years | 732 | 18.1% |
| 55 to 64 Years | 890 | 22.0% |
| 65 to 74 Years | 542 | 13.4% |
| 75 to 84 Years | 474 | 11.7% |
| 85 Years and Over | 83 | 2.1% |
| Total | 4,050 | 100.0% |
Housing Finances in Paris
Median Income by Occupancy in Paris
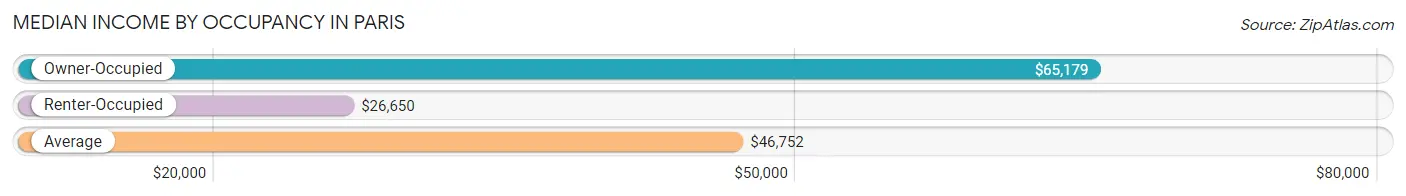
| Occupancy Type | # Households | Median Income |
| Owner-Occupied | 2,260 (55.8%) | $65,179 |
| Renter-Occupied | 1,790 (44.2%) | $26,650 |
| Average | 4,050 (100.0%) | $46,752 |
Occupancy by Householder Income Bracket in Paris
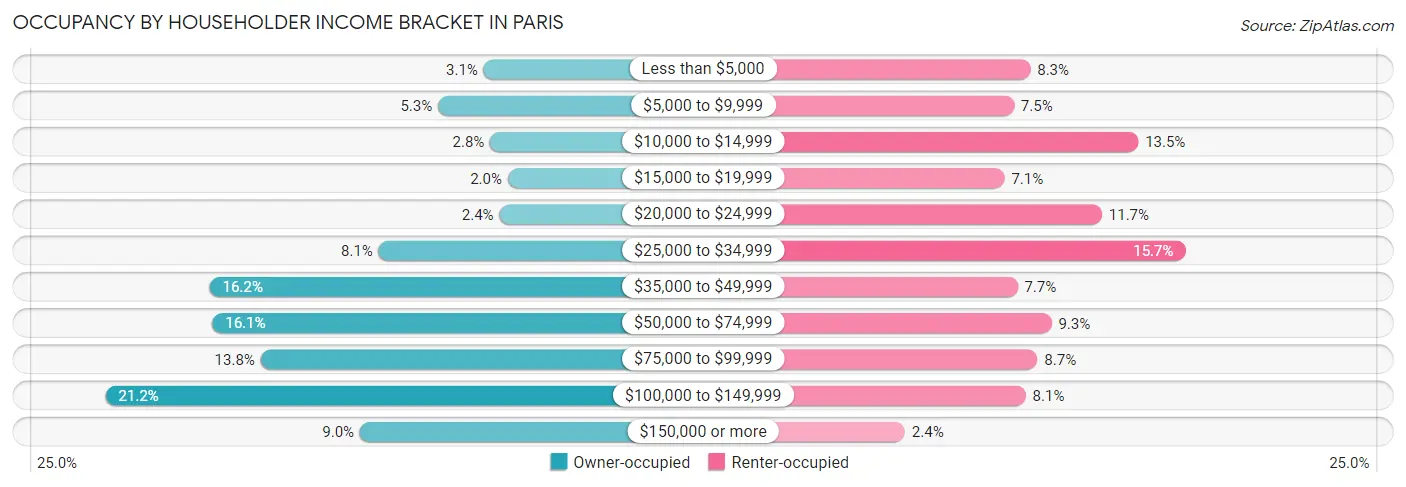
| Income Bracket | Owner-occupied | Renter-occupied |
| Less than $5,000 | 71 (3.1%) | 149 (8.3%) |
| $5,000 to $9,999 | 120 (5.3%) | 135 (7.5%) |
| $10,000 to $14,999 | 64 (2.8%) | 241 (13.5%) |
| $15,000 to $19,999 | 45 (2.0%) | 127 (7.1%) |
| $20,000 to $24,999 | 54 (2.4%) | 210 (11.7%) |
| $25,000 to $34,999 | 184 (8.1%) | 281 (15.7%) |
| $35,000 to $49,999 | 366 (16.2%) | 138 (7.7%) |
| $50,000 to $74,999 | 363 (16.1%) | 167 (9.3%) |
| $75,000 to $99,999 | 311 (13.8%) | 155 (8.7%) |
| $100,000 to $149,999 | 478 (21.1%) | 145 (8.1%) |
| $150,000 or more | 204 (9.0%) | 42 (2.4%) |
| Total | 2,260 (100.0%) | 1,790 (100.0%) |
Monthly Housing Cost Tiers in Paris
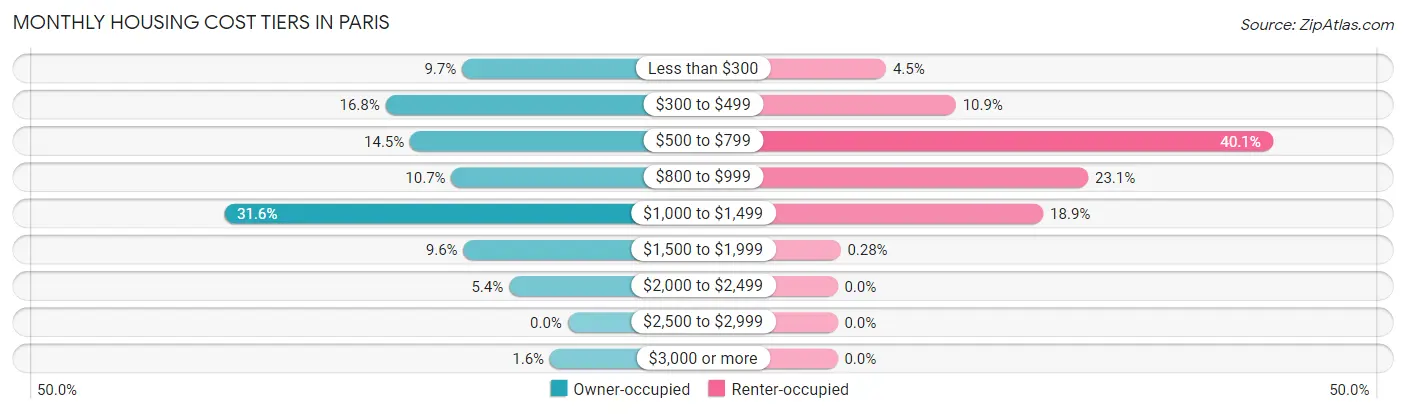
| Monthly Cost | Owner-occupied | Renter-occupied |
| Less than $300 | 220 (9.7%) | 80 (4.5%) |
| $300 to $499 | 379 (16.8%) | 195 (10.9%) |
| $500 to $799 | 328 (14.5%) | 717 (40.1%) |
| $800 to $999 | 242 (10.7%) | 413 (23.1%) |
| $1,000 to $1,499 | 715 (31.6%) | 339 (18.9%) |
| $1,500 to $1,999 | 217 (9.6%) | 5 (0.3%) |
| $2,000 to $2,499 | 122 (5.4%) | 0 (0.0%) |
| $2,500 to $2,999 | 0 (0.0%) | 0 (0.0%) |
| $3,000 or more | 37 (1.6%) | 0 (0.0%) |
| Total | 2,260 (100.0%) | 1,790 (100.0%) |
Physical Housing Characteristics in Paris
Housing Structures in Paris
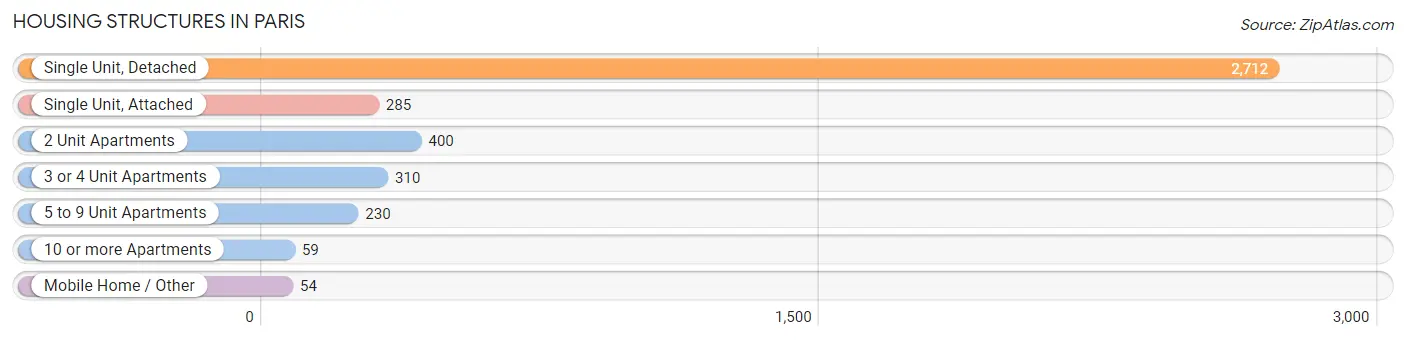
| Structure Type | # Housing Units | % Housing Units |
| Single Unit, Detached | 2,712 | 67.0% |
| Single Unit, Attached | 285 | 7.0% |
| 2 Unit Apartments | 400 | 9.9% |
| 3 or 4 Unit Apartments | 310 | 7.6% |
| 5 to 9 Unit Apartments | 230 | 5.7% |
| 10 or more Apartments | 59 | 1.5% |
| Mobile Home / Other | 54 | 1.3% |
| Total | 4,050 | 100.0% |
Housing Structures by Occupancy in Paris
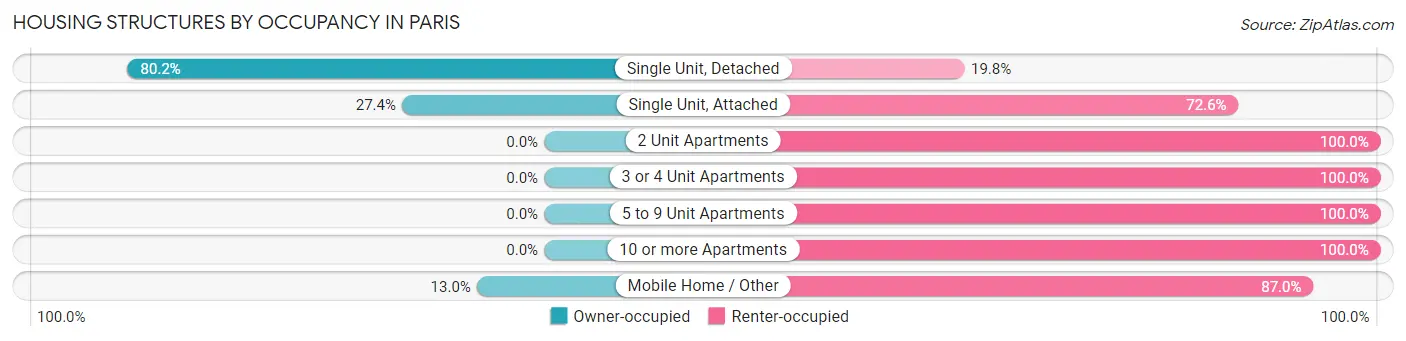
| Structure Type | Owner-occupied | Renter-occupied |
| Single Unit, Detached | 2,175 (80.2%) | 537 (19.8%) |
| Single Unit, Attached | 78 (27.4%) | 207 (72.6%) |
| 2 Unit Apartments | 0 (0.0%) | 400 (100.0%) |
| 3 or 4 Unit Apartments | 0 (0.0%) | 310 (100.0%) |
| 5 to 9 Unit Apartments | 0 (0.0%) | 230 (100.0%) |
| 10 or more Apartments | 0 (0.0%) | 59 (100.0%) |
| Mobile Home / Other | 7 (13.0%) | 47 (87.0%) |
| Total | 2,260 (55.8%) | 1,790 (44.2%) |
Housing Structures by Number of Rooms in Paris
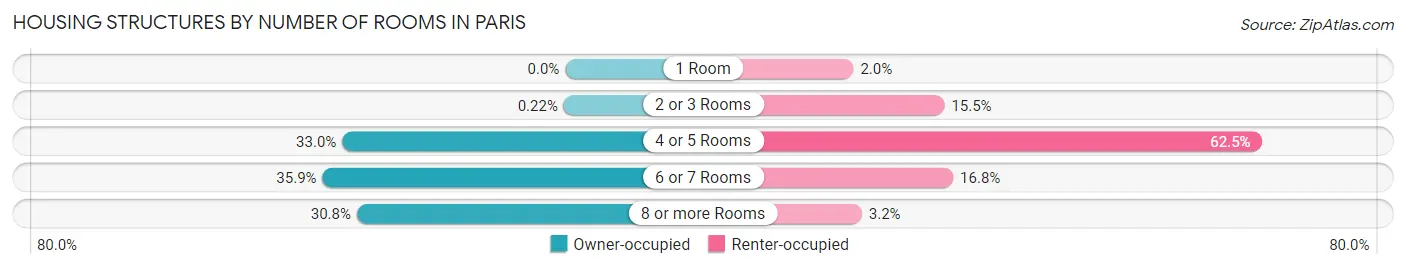
| Number of Rooms | Owner-occupied | Renter-occupied |
| 1 Room | 0 (0.0%) | 36 (2.0%) |
| 2 or 3 Rooms | 5 (0.2%) | 277 (15.5%) |
| 4 or 5 Rooms | 746 (33.0%) | 1,119 (62.5%) |
| 6 or 7 Rooms | 812 (35.9%) | 300 (16.8%) |
| 8 or more Rooms | 697 (30.8%) | 58 (3.2%) |
| Total | 2,260 (100.0%) | 1,790 (100.0%) |
Housing Structure by Heating Type in Paris
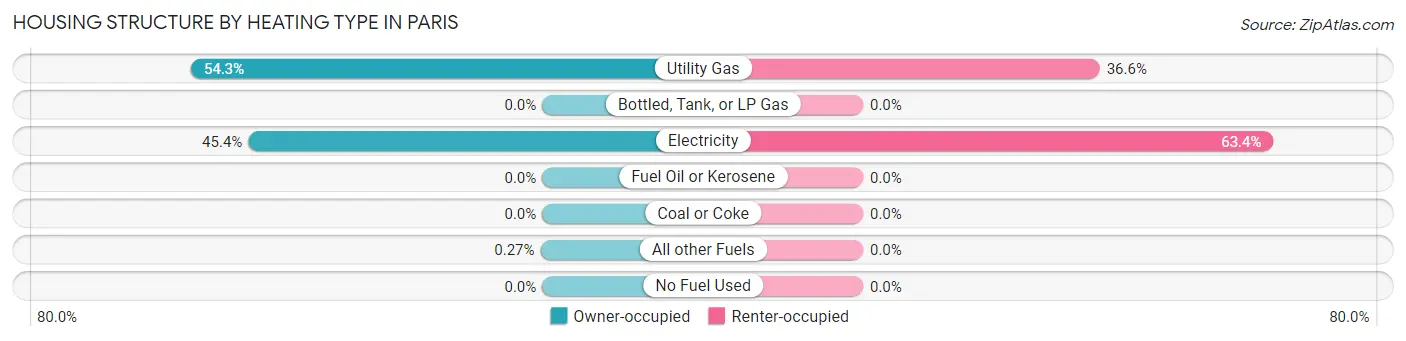
| Heating Type | Owner-occupied | Renter-occupied |
| Utility Gas | 1,227 (54.3%) | 655 (36.6%) |
| Bottled, Tank, or LP Gas | 0 (0.0%) | 0 (0.0%) |
| Electricity | 1,027 (45.4%) | 1,135 (63.4%) |
| Fuel Oil or Kerosene | 0 (0.0%) | 0 (0.0%) |
| Coal or Coke | 0 (0.0%) | 0 (0.0%) |
| All other Fuels | 6 (0.3%) | 0 (0.0%) |
| No Fuel Used | 0 (0.0%) | 0 (0.0%) |
| Total | 2,260 (100.0%) | 1,790 (100.0%) |
Household Vehicle Usage in Paris
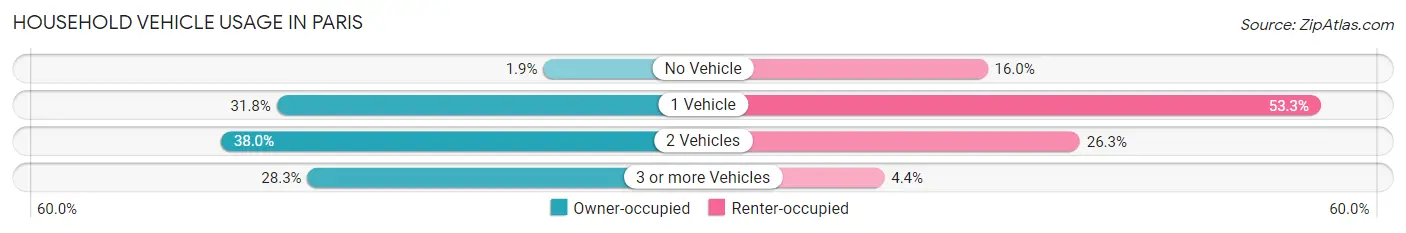
| Vehicles per Household | Owner-occupied | Renter-occupied |
| No Vehicle | 43 (1.9%) | 286 (16.0%) |
| 1 Vehicle | 718 (31.8%) | 954 (53.3%) |
| 2 Vehicles | 859 (38.0%) | 471 (26.3%) |
| 3 or more Vehicles | 640 (28.3%) | 79 (4.4%) |
| Total | 2,260 (100.0%) | 1,790 (100.0%) |
Real Estate & Mortgages in Paris
Real Estate and Mortgage Overview in Paris
| Characteristic | Without Mortgage | With Mortgage |
| Housing Units | 798 | 1,462 |
| Median Property Value | $136,400 | $168,400 |
| Median Household Income | $46,757 | $152 |
| Monthly Housing Costs | $422 | $37 |
| Real Estate Taxes | $1,119 | $17 |
Property Value by Mortgage Status in Paris
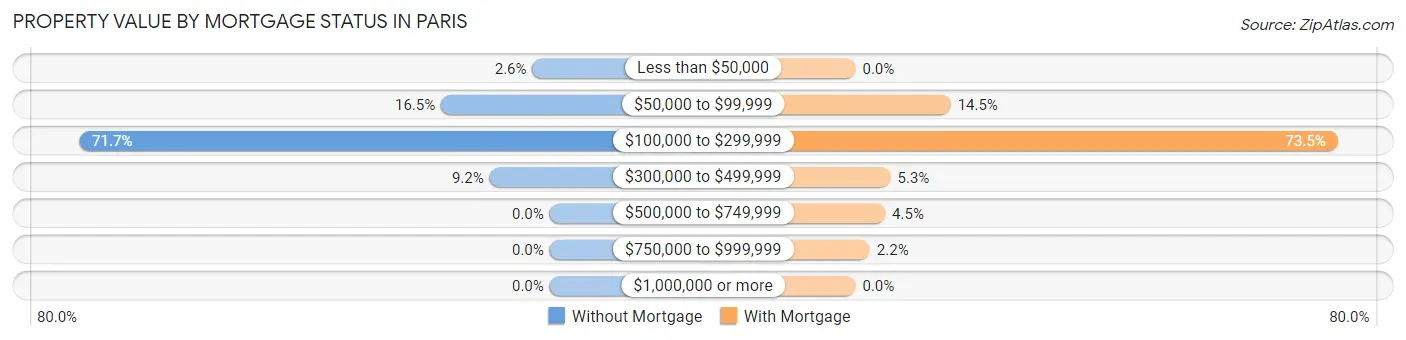
| Property Value | Without Mortgage | With Mortgage |
| Less than $50,000 | 21 (2.6%) | 0 (0.0%) |
| $50,000 to $99,999 | 132 (16.5%) | 212 (14.5%) |
| $100,000 to $299,999 | 572 (71.7%) | 1,074 (73.5%) |
| $300,000 to $499,999 | 73 (9.1%) | 78 (5.3%) |
| $500,000 to $749,999 | 0 (0.0%) | 66 (4.5%) |
| $750,000 to $999,999 | 0 (0.0%) | 32 (2.2%) |
| $1,000,000 or more | 0 (0.0%) | 0 (0.0%) |
| Total | 798 (100.0%) | 1,462 (100.0%) |
Household Income by Mortgage Status in Paris
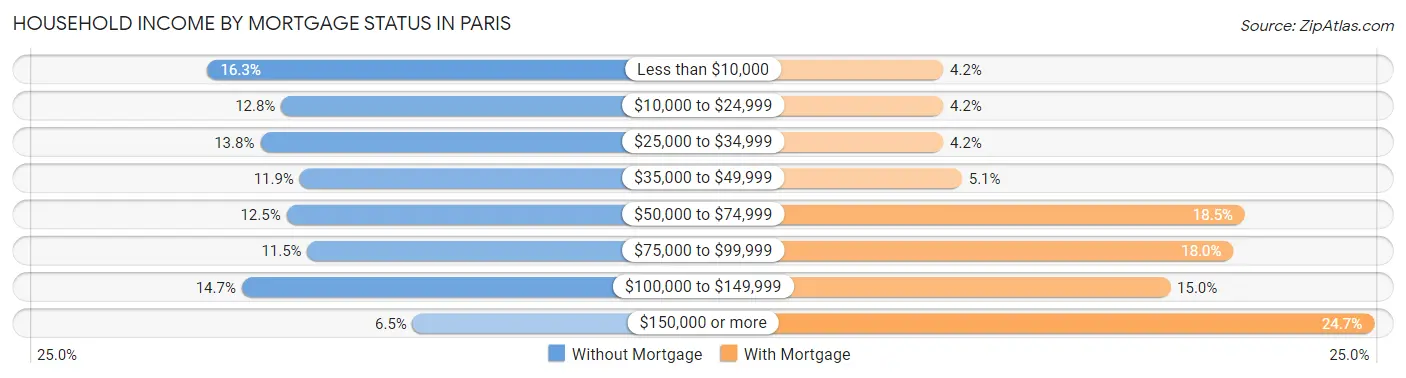
| Household Income | Without Mortgage | With Mortgage |
| Less than $10,000 | 130 (16.3%) | 61 (4.2%) |
| $10,000 to $24,999 | 102 (12.8%) | 61 (4.2%) |
| $25,000 to $34,999 | 110 (13.8%) | 61 (4.2%) |
| $35,000 to $49,999 | 95 (11.9%) | 74 (5.1%) |
| $50,000 to $74,999 | 100 (12.5%) | 271 (18.5%) |
| $75,000 to $99,999 | 92 (11.5%) | 263 (18.0%) |
| $100,000 to $149,999 | 117 (14.7%) | 219 (15.0%) |
| $150,000 or more | 52 (6.5%) | 361 (24.7%) |
| Total | 798 (100.0%) | 1,462 (100.0%) |
Property Value to Household Income Ratio in Paris
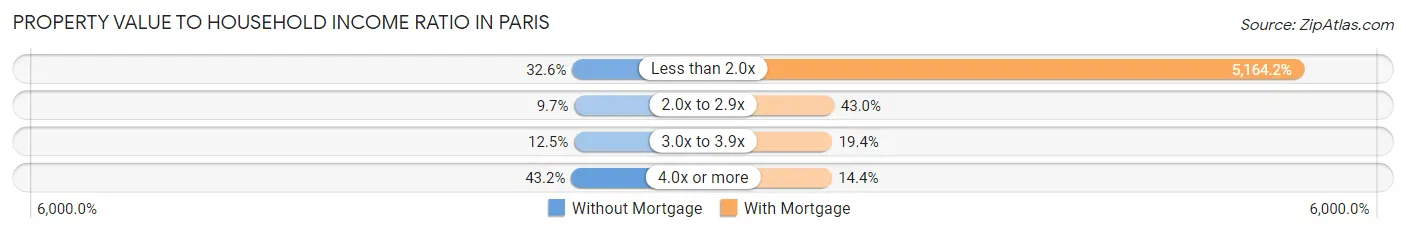
| Value-to-Income Ratio | Without Mortgage | With Mortgage |
| Less than 2.0x | 260 (32.6%) | 75,500 (5,164.2%) |
| 2.0x to 2.9x | 77 (9.7%) | 628 (42.9%) |
| 3.0x to 3.9x | 100 (12.5%) | 284 (19.4%) |
| 4.0x or more | 345 (43.2%) | 210 (14.4%) |
| Total | 798 (100.0%) | 1,462 (100.0%) |
Real Estate Taxes by Mortgage Status in Paris
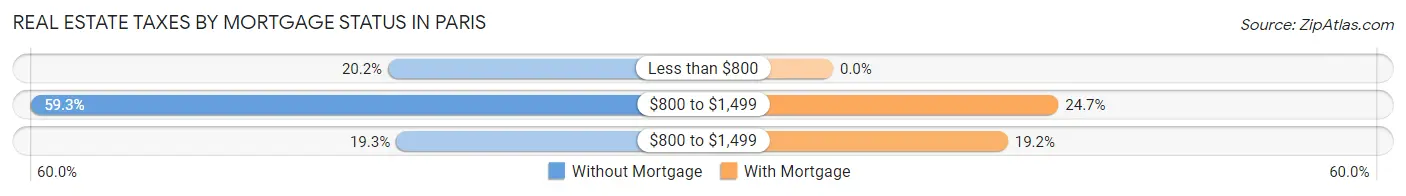
| Property Taxes | Without Mortgage | With Mortgage |
| Less than $800 | 161 (20.2%) | 0 (0.0%) |
| $800 to $1,499 | 473 (59.3%) | 361 (24.7%) |
| $800 to $1,499 | 154 (19.3%) | 280 (19.2%) |
| Total | 798 (100.0%) | 1,462 (100.0%) |
Health & Disability in Paris
Health Insurance Coverage by Age in Paris
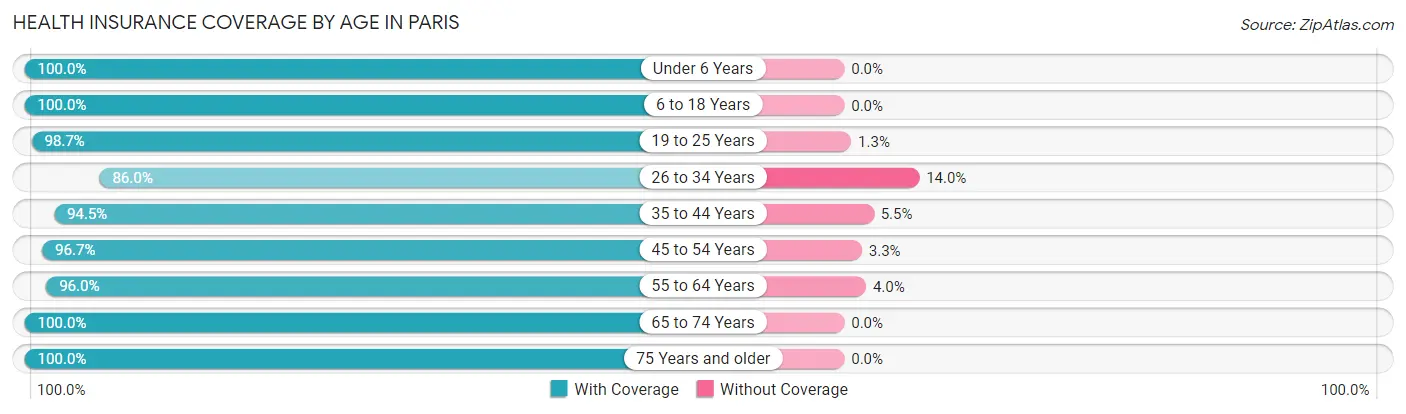
| Age Bracket | With Coverage | Without Coverage |
| Under 6 Years | 970 (100.0%) | 0 (0.0%) |
| 6 to 18 Years | 1,537 (100.0%) | 0 (0.0%) |
| 19 to 25 Years | 1,156 (98.7%) | 15 (1.3%) |
| 26 to 34 Years | 967 (86.0%) | 157 (14.0%) |
| 35 to 44 Years | 1,018 (94.5%) | 59 (5.5%) |
| 45 to 54 Years | 1,151 (96.7%) | 39 (3.3%) |
| 55 to 64 Years | 1,306 (96.0%) | 55 (4.0%) |
| 65 to 74 Years | 813 (100.0%) | 0 (0.0%) |
| 75 Years and older | 713 (100.0%) | 0 (0.0%) |
| Total | 9,631 (96.7%) | 325 (3.3%) |
Health Insurance Coverage by Citizenship Status in Paris

| Citizenship Status | With Coverage | Without Coverage |
| Native Born | 970 (100.0%) | 0 (0.0%) |
| Foreign Born, Citizen | 1,537 (100.0%) | 0 (0.0%) |
| Foreign Born, not a Citizen | 1,156 (98.7%) | 15 (1.3%) |
Health Insurance Coverage by Household Income in Paris
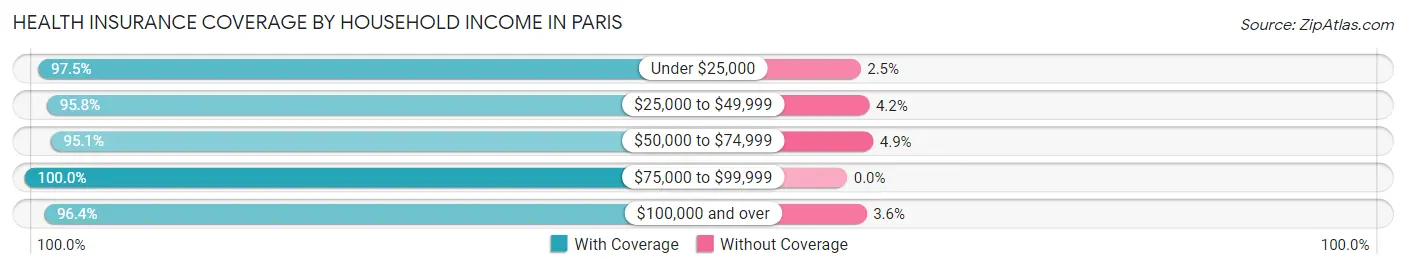
| Household Income | With Coverage | Without Coverage |
| Under $25,000 | 1,886 (97.5%) | 49 (2.5%) |
| $25,000 to $49,999 | 2,370 (95.8%) | 103 (4.2%) |
| $50,000 to $74,999 | 1,266 (95.1%) | 65 (4.9%) |
| $75,000 to $99,999 | 1,248 (100.0%) | 0 (0.0%) |
| $100,000 and over | 2,861 (96.4%) | 108 (3.6%) |
Public vs Private Health Insurance Coverage by Age in Paris
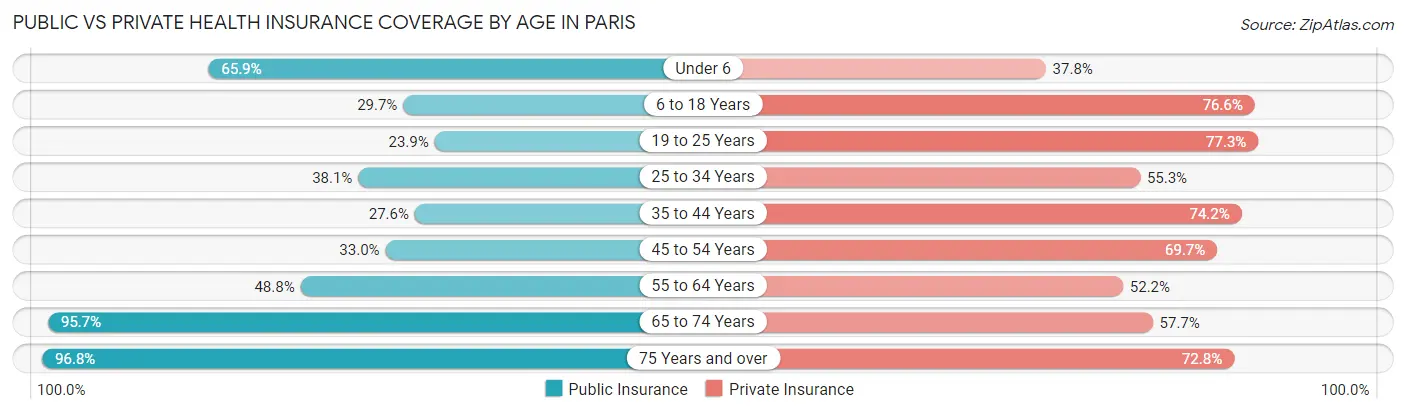
| Age Bracket | Public Insurance | Private Insurance |
| Under 6 | 639 (65.9%) | 367 (37.8%) |
| 6 to 18 Years | 457 (29.7%) | 1,178 (76.6%) |
| 19 to 25 Years | 280 (23.9%) | 905 (77.3%) |
| 25 to 34 Years | 428 (38.1%) | 622 (55.3%) |
| 35 to 44 Years | 297 (27.6%) | 799 (74.2%) |
| 45 to 54 Years | 393 (33.0%) | 829 (69.7%) |
| 55 to 64 Years | 664 (48.8%) | 710 (52.2%) |
| 65 to 74 Years | 778 (95.7%) | 469 (57.7%) |
| 75 Years and over | 690 (96.8%) | 519 (72.8%) |
| Total | 4,626 (46.5%) | 6,398 (64.3%) |
Disability Status by Sex by Age in Paris
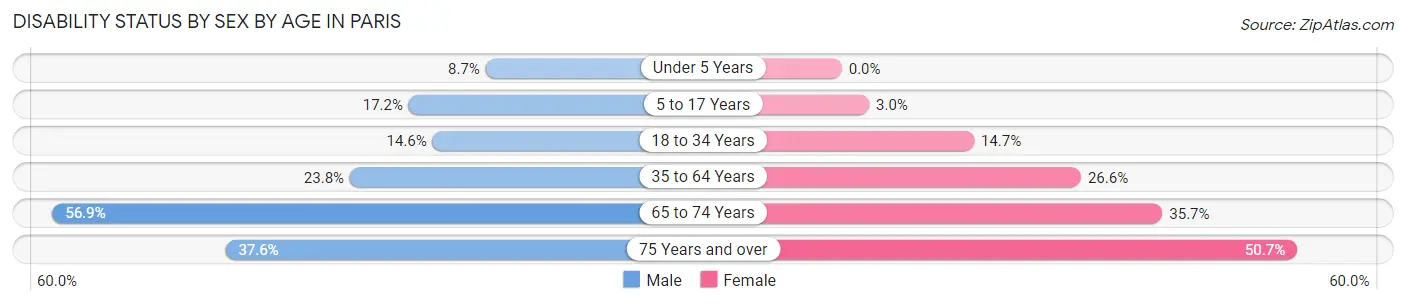
| Age Bracket | Male | Female |
| Under 5 Years | 41 (8.6%) | 0 (0.0%) |
| 5 to 17 Years | 163 (17.2%) | 21 (3.0%) |
| 18 to 34 Years | 162 (14.6%) | 185 (14.7%) |
| 35 to 64 Years | 409 (23.8%) | 508 (26.6%) |
| 65 to 74 Years | 206 (56.9%) | 161 (35.7%) |
| 75 Years and over | 105 (37.6%) | 220 (50.7%) |
Disability Class by Sex by Age in Paris
Disability Class: Hearing Difficulty
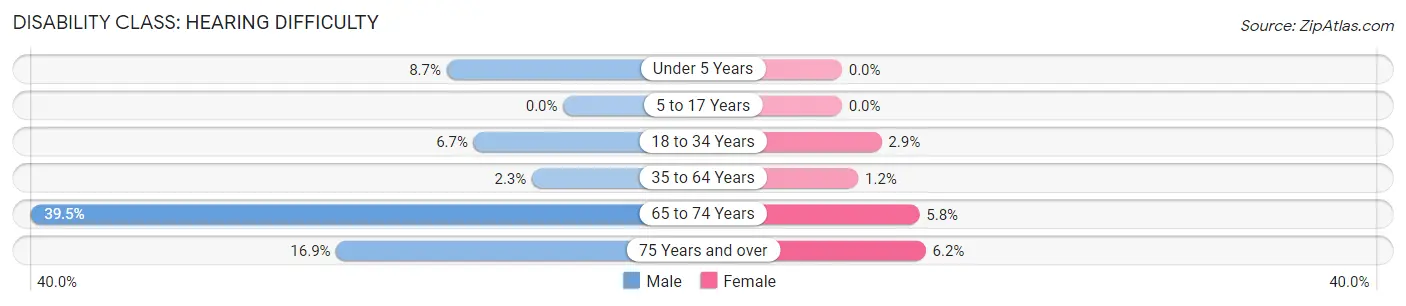
| Age Bracket | Male | Female |
| Under 5 Years | 41 (8.6%) | 0 (0.0%) |
| 5 to 17 Years | 0 (0.0%) | 0 (0.0%) |
| 18 to 34 Years | 74 (6.7%) | 37 (2.9%) |
| 35 to 64 Years | 40 (2.3%) | 23 (1.2%) |
| 65 to 74 Years | 143 (39.5%) | 26 (5.8%) |
| 75 Years and over | 47 (16.9%) | 27 (6.2%) |
Disability Class: Vision Difficulty
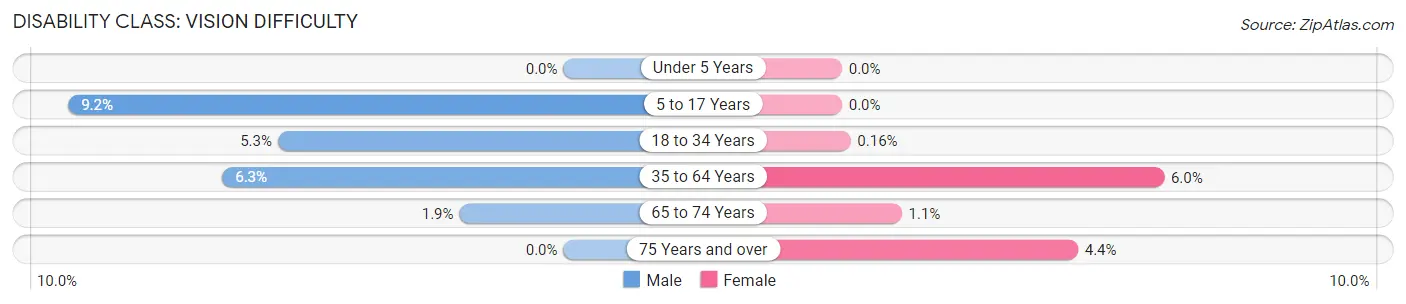
| Age Bracket | Male | Female |
| Under 5 Years | 0 (0.0%) | 0 (0.0%) |
| 5 to 17 Years | 87 (9.2%) | 0 (0.0%) |
| 18 to 34 Years | 59 (5.3%) | 2 (0.2%) |
| 35 to 64 Years | 109 (6.3%) | 114 (6.0%) |
| 65 to 74 Years | 7 (1.9%) | 5 (1.1%) |
| 75 Years and over | 0 (0.0%) | 19 (4.4%) |
Disability Class: Cognitive Difficulty
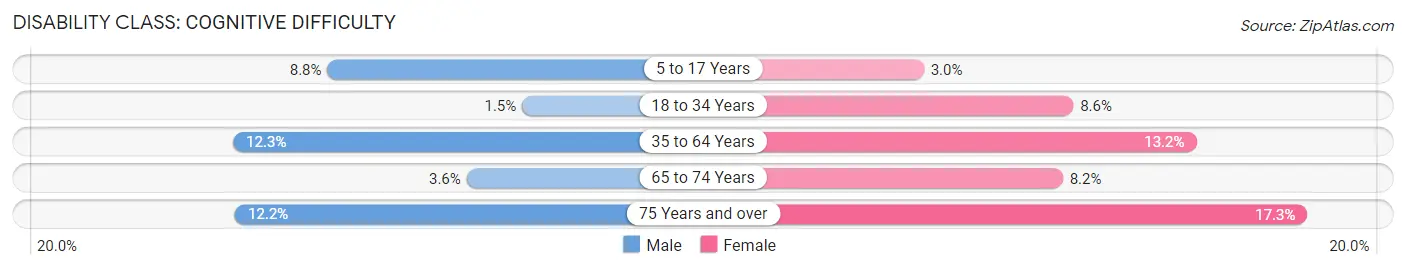
| Age Bracket | Male | Female |
| 5 to 17 Years | 83 (8.8%) | 21 (3.0%) |
| 18 to 34 Years | 17 (1.5%) | 108 (8.6%) |
| 35 to 64 Years | 211 (12.3%) | 251 (13.2%) |
| 65 to 74 Years | 13 (3.6%) | 37 (8.2%) |
| 75 Years and over | 34 (12.2%) | 75 (17.3%) |
Disability Class: Ambulatory Difficulty
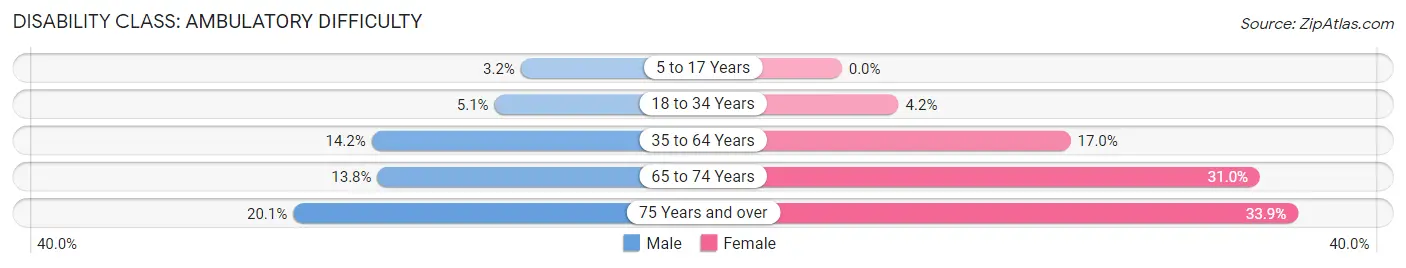
| Age Bracket | Male | Female |
| 5 to 17 Years | 30 (3.2%) | 0 (0.0%) |
| 18 to 34 Years | 57 (5.1%) | 53 (4.2%) |
| 35 to 64 Years | 245 (14.2%) | 324 (17.0%) |
| 65 to 74 Years | 50 (13.8%) | 140 (31.0%) |
| 75 Years and over | 56 (20.1%) | 147 (33.9%) |
Disability Class: Self-Care Difficulty
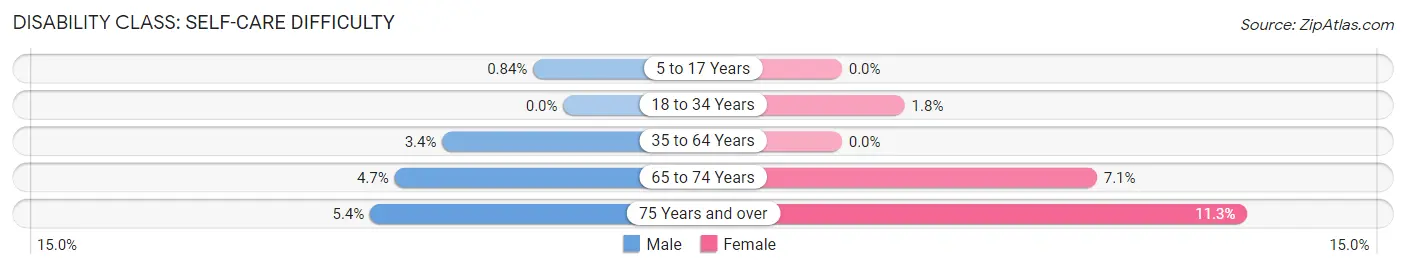
| Age Bracket | Male | Female |
| 5 to 17 Years | 8 (0.8%) | 0 (0.0%) |
| 18 to 34 Years | 0 (0.0%) | 22 (1.8%) |
| 35 to 64 Years | 58 (3.4%) | 0 (0.0%) |
| 65 to 74 Years | 17 (4.7%) | 32 (7.1%) |
| 75 Years and over | 15 (5.4%) | 49 (11.3%) |
Technology Access in Paris
Computing Device Access in Paris
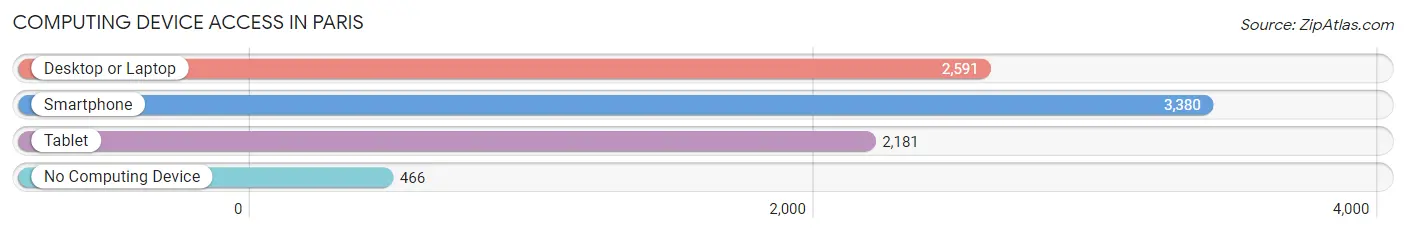
| Device Type | # Households | % Households |
| Desktop or Laptop | 2,591 | 64.0% |
| Smartphone | 3,380 | 83.5% |
| Tablet | 2,181 | 53.8% |
| No Computing Device | 466 | 11.5% |
| Total | 4,050 | 100.0% |
Internet Access in Paris
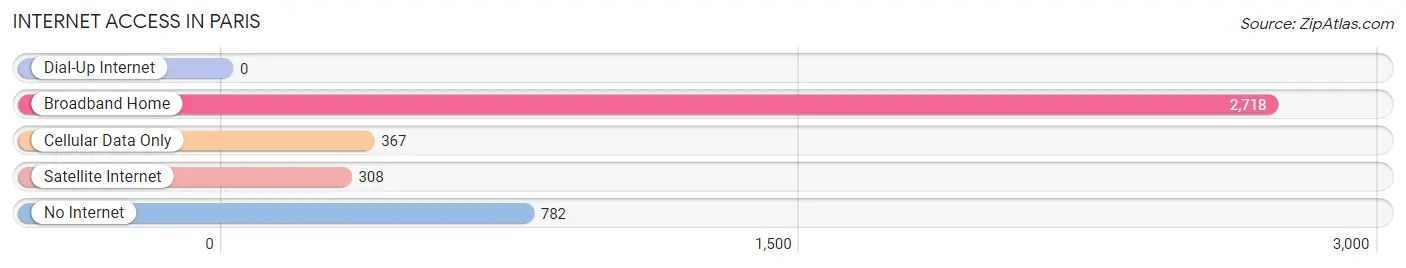
| Internet Type | # Households | % Households |
| Dial-Up Internet | 0 | 0.0% |
| Broadband Home | 2,718 | 67.1% |
| Cellular Data Only | 367 | 9.1% |
| Satellite Internet | 308 | 7.6% |
| No Internet | 782 | 19.3% |
| Total | 4,050 | 100.0% |
Paris Summary
Paris, Kentucky is a small city located in the heart of Bourbon County, Kentucky. It is the county seat of Bourbon County and is located in the Bluegrass region of the state. The city is situated on the banks of the Licking River and is home to a population of 8,553 people as of the 2010 census.
History
Paris, Kentucky was founded in 1789 by Colonel John Holder, a Revolutionary War veteran. The city was named after the French capital of Paris, and was the first settlement in Bourbon County. The city was incorporated in 1839 and has since grown to become the county seat of Bourbon County.
In the early 19th century, Paris was a major center for the production of hemp and tobacco. The city was also home to a number of distilleries, which produced bourbon whiskey. The city was also a major stop on the Underground Railroad, with many slaves escaping to freedom in the North.
Geography
Paris is located in the Bluegrass region of Kentucky, in the heart of Bourbon County. The city is situated on the banks of the Licking River, and is surrounded by rolling hills and farmland. The city has a total area of 4.2 square miles, all of which is land.
The climate in Paris is humid subtropical, with hot, humid summers and mild winters. The average annual temperature is 57 degrees Fahrenheit, with an average high of 79 degrees in the summer and an average low of 35 degrees in the winter.
Economy
The economy of Paris is largely based on agriculture and manufacturing. The city is home to a number of manufacturing plants, including a General Electric plant and a Toyota plant. The city is also home to a number of agricultural businesses, including dairy farms, beef farms, and horse farms.
The city is also home to a number of retail stores, restaurants, and other businesses. The city is home to a number of historic buildings, including the Bourbon County Courthouse and the Paris Opera House.
Demographics
As of the 2010 census, the population of Paris was 8,553 people. The racial makeup of the city was 92.3% White, 4.3% African American, 0.3% Native American, 0.7% Asian, 0.1% Pacific Islander, and 2.3% from other races. The median household income in the city was $37,945, and the median family income was $45,945.
The city is home to a number of churches, including the First Baptist Church, the First Presbyterian Church, and the First Christian Church. The city is also home to a number of schools, including the Paris Independent School District, the Bourbon County High School, and the Paris Junior College.
Conclusion
Paris, Kentucky is a small city located in the heart of Bourbon County, Kentucky. The city was founded in 1789 and has since grown to become the county seat of Bourbon County. The city is situated on the banks of the Licking River and is home to a population of 8,553 people as of the 2010 census. The economy of Paris is largely based on agriculture and manufacturing, and the city is home to a number of historic buildings, churches, and schools.
Common Questions
What is Per Capita Income in Paris?
Per Capita income in Paris is $25,222.
What is the Median Family Income in Paris?
Median Family Income in Paris is $60,786.
What is the Median Household income in Paris?
Median Household Income in Paris is $46,752.
What is Income or Wage Gap in Paris?
Income or Wage Gap in Paris is 27.1%.
Women in Paris earn 72.9 cents for every dollar earned by a man.
What is Family Income Deficit in Paris?
Family Income Deficit in Paris is $8,416.
Families that are below poverty line in Paris earn $8,416 less on average than the poverty threshold level.
What is Inequality or Gini Index in Paris?
Inequality or Gini Index in Paris is 0.45.
What is the Total Population of Paris?
Total Population of Paris is 10,143.
What is the Total Male Population of Paris?
Total Male Population of Paris is 5,015.
What is the Total Female Population of Paris?
Total Female Population of Paris is 5,128.
What is the Ratio of Males per 100 Females in Paris?
There are 97.80 Males per 100 Females in Paris.
What is the Ratio of Females per 100 Males in Paris?
There are 102.25 Females per 100 Males in Paris.
What is the Median Population Age in Paris?
Median Population Age in Paris is 36.6 Years.
What is the Average Family Size in Paris
Average Family Size in Paris is 3.1 People.
What is the Average Household Size in Paris
Average Household Size in Paris is 2.5 People.
How Large is the Labor Force in Paris?
There are 4,602 People in the Labor Forcein in Paris.
What is the Percentage of People in the Labor Force in Paris?
58.0% of People are in the Labor Force in Paris.
What is the Unemployment Rate in Paris?
Unemployment Rate in Paris is 5.9%.