Zip Codes with the Highest Percentage of Population Employed in Architecture & Engineering in Paducah, KY
RELATED REPORTS & OPTIONS
Architecture & Engineering
Paducah
Compare Zip Codes
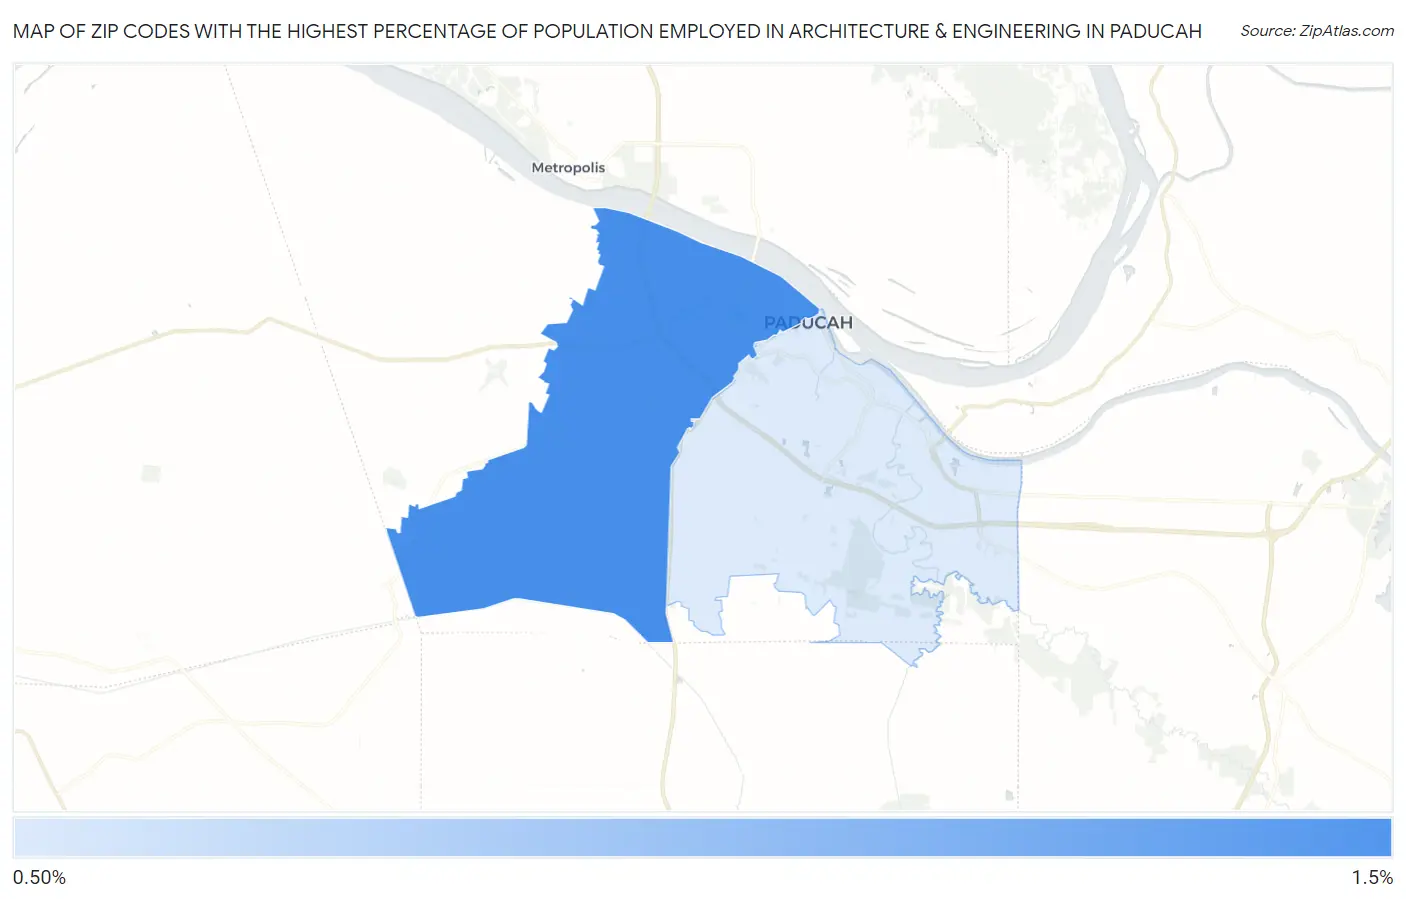
Map of Zip Codes with the Highest Percentage of Population Employed in Architecture & Engineering in Paducah
1.1%
1.3%
Zip Codes with the Highest Percentage of Population Employed in Architecture & Engineering in Paducah, KY
| Zip Code | % Employed | vs State | vs National | |
| 1. | 42001 | 1.3% | 1.7%(-0.441)#205 | 2.1%(-0.890)#14,610 |
| 2. | 42003 | 1.1% | 1.7%(-0.603)#232 | 2.1%(-1.05)#15,880 |
1
Common Questions
What are the Top Zip Codes with the Highest Percentage of Population Employed in Architecture & Engineering in Paducah, KY?
Top Zip Codes with the Highest Percentage of Population Employed in Architecture & Engineering in Paducah, KY are:
What zip code has the Highest Percentage of Population Employed in Architecture & Engineering in Paducah, KY?
42001 has the Highest Percentage of Population Employed in Architecture & Engineering in Paducah, KY with 1.3%.
What is the Percentage of Population Employed in Architecture & Engineering in Paducah, KY?
Percentage of Population Employed in Architecture & Engineering in Paducah is 1.3%.
What is the Percentage of Population Employed in Architecture & Engineering in Kentucky?
Percentage of Population Employed in Architecture & Engineering in Kentucky is 1.7%.
What is the Percentage of Population Employed in Architecture & Engineering in the United States?
Percentage of Population Employed in Architecture & Engineering in the United States is 2.1%.