Zip Codes with the Highest Percentage of Population Employed in Legal Services & Support in Paducah, KY
RELATED REPORTS & OPTIONS
Legal Services & Support
Paducah
Compare Zip Codes
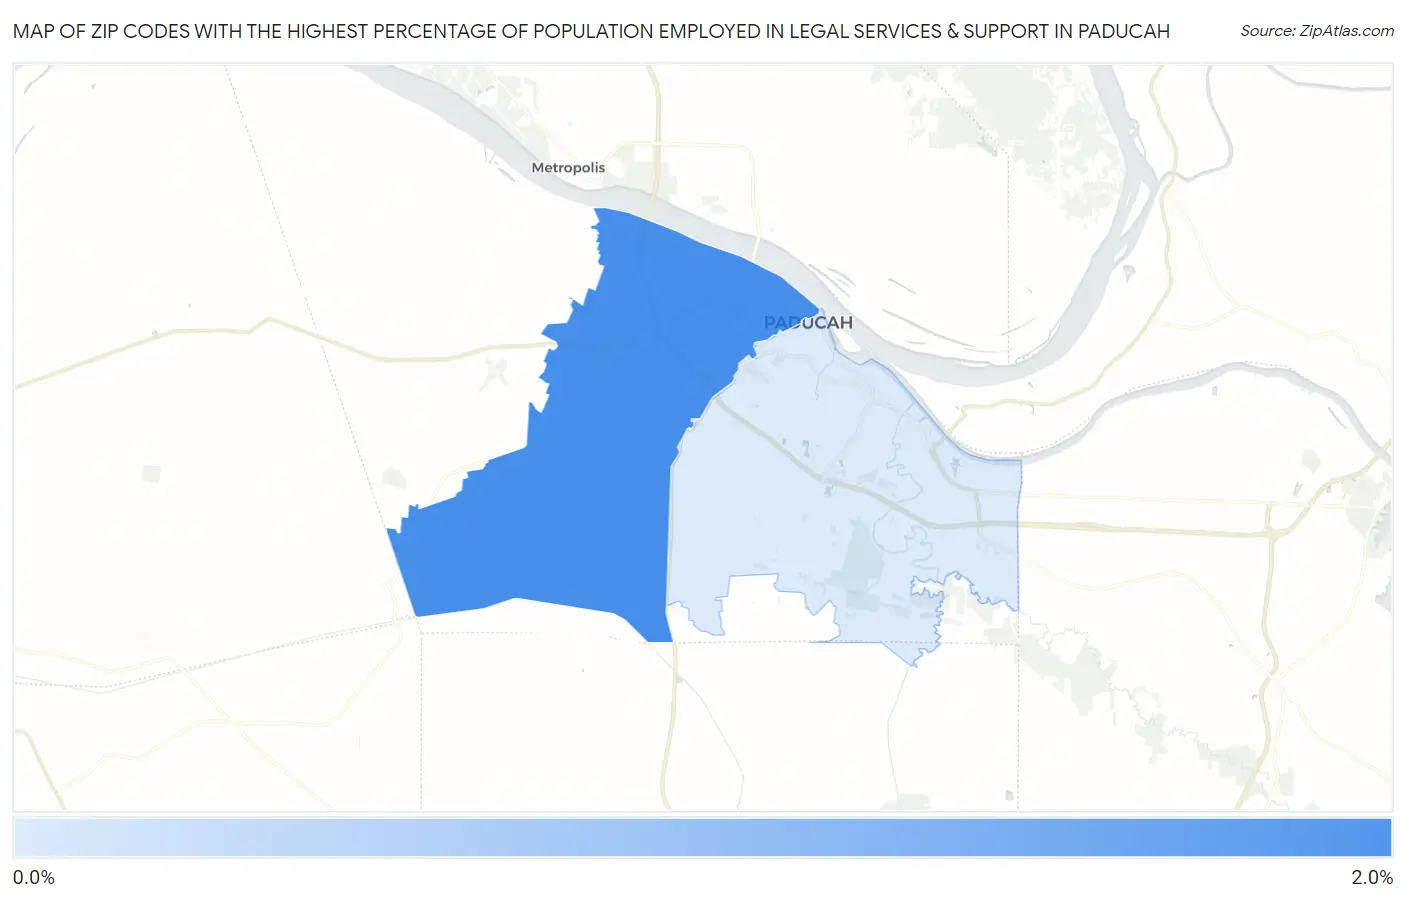
Map of Zip Codes with the Highest Percentage of Population Employed in Legal Services & Support in Paducah
0.63%
2.0%
Zip Codes with the Highest Percentage of Population Employed in Legal Services & Support in Paducah, KY
| Zip Code | % Employed | vs State | vs National | |
| 1. | 42001 | 2.0% | 0.95%(+1.01)#53 | 1.2%(+0.772)#3,586 |
| 2. | 42003 | 0.63% | 0.95%(-0.316)#152 | 1.2%(-0.554)#11,138 |
1
Common Questions
What are the Top Zip Codes with the Highest Percentage of Population Employed in Legal Services & Support in Paducah, KY?
Top Zip Codes with the Highest Percentage of Population Employed in Legal Services & Support in Paducah, KY are:
What zip code has the Highest Percentage of Population Employed in Legal Services & Support in Paducah, KY?
42001 has the Highest Percentage of Population Employed in Legal Services & Support in Paducah, KY with 2.0%.
What is the Percentage of Population Employed in Legal Services & Support in Paducah, KY?
Percentage of Population Employed in Legal Services & Support in Paducah is 1.5%.
What is the Percentage of Population Employed in Legal Services & Support in Kentucky?
Percentage of Population Employed in Legal Services & Support in Kentucky is 0.95%.
What is the Percentage of Population Employed in Legal Services & Support in the United States?
Percentage of Population Employed in Legal Services & Support in the United States is 1.2%.