Eddyville, KY Map & Demographics
Eddyville Map
Eddyville Overview
$20,022
PER CAPITA INCOME
$70,625
AVG FAMILY INCOME
$37,475
AVG HOUSEHOLD INCOME
39.1%
WAGE / INCOME GAP [ % ]
60.9¢/ $1
WAGE / INCOME GAP [ $ ]
0.50
INEQUALITY / GINI INDEX
2,783
TOTAL POPULATION
1,962
MALE POPULATION
821
FEMALE POPULATION
238.98
MALES / 100 FEMALES
41.85
FEMALES / 100 MALES
35.7
MEDIAN AGE
3.2
AVG FAMILY SIZE
2.2
AVG HOUSEHOLD SIZE
853
LABOR FORCE [ PEOPLE ]
35.5%
PERCENT IN LABOR FORCE
2.5%
UNEMPLOYMENT RATE
Eddyville Zip Codes
Eddyville Area Codes
Income in Eddyville
Income Overview in Eddyville
Per Capita Income in Eddyville is $20,022, while median incomes of families and households are $70,625 and $37,475 respectively.
| Characteristic | Number | Measure |
| Per Capita Income | 2,783 | $20,022 |
| Median Family Income | 421 | $70,625 |
| Mean Family Income | 421 | $92,081 |
| Median Household Income | 795 | $37,475 |
| Mean Household Income | 795 | $65,377 |
| Income Deficit | 421 | $0 |
| Wage / Income Gap (%) | 2,783 | 39.08% |
| Wage / Income Gap ($) | 2,783 | 60.92¢ per $1 |
| Gini / Inequality Index | 2,783 | 0.50 |
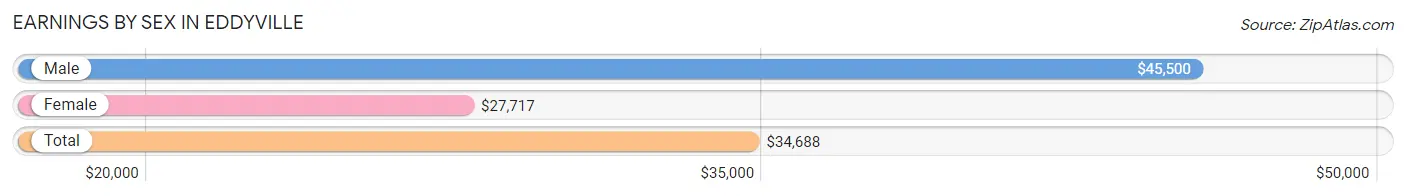
Earnings by Sex in Eddyville
Average Earnings in Eddyville are $34,688, $45,500 for men and $27,717 for women, a difference of 39.1%.
| Sex | Number | Average Earnings |
| Male | 480 (53.9%) | $45,500 |
| Female | 410 (46.1%) | $27,717 |
| Total | 890 (100.0%) | $34,688 |
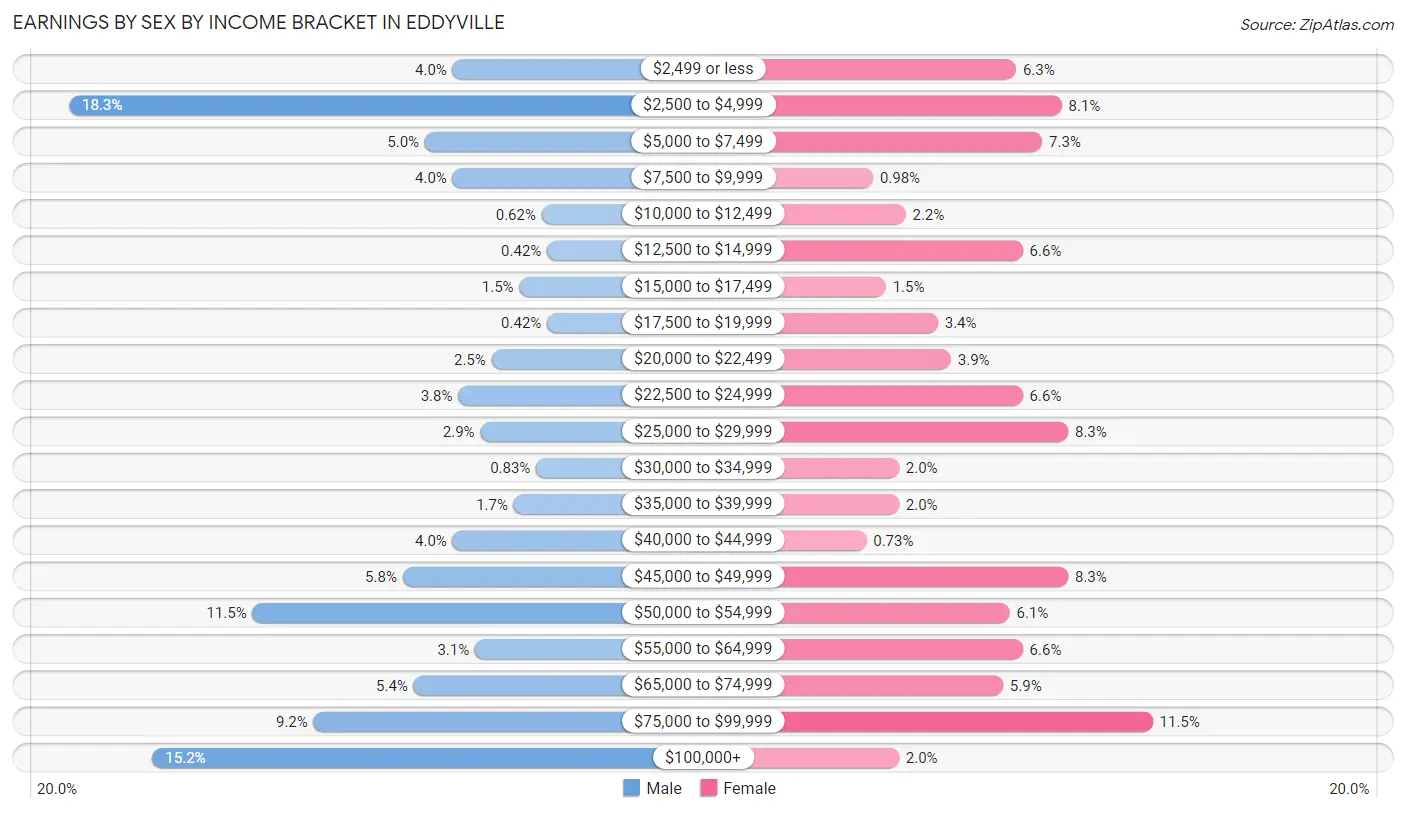
Earnings by Sex by Income Bracket in Eddyville
The most common earnings brackets in Eddyville are $2,500 to $4,999 for men (88 | 18.3%) and $75,000 to $99,999 for women (47 | 11.5%).
| Income | Male | Female |
| $2,499 or less | 19 (4.0%) | 26 (6.3%) |
| $2,500 to $4,999 | 88 (18.3%) | 33 (8.1%) |
| $5,000 to $7,499 | 24 (5.0%) | 30 (7.3%) |
| $7,500 to $9,999 | 19 (4.0%) | 4 (1.0%) |
| $10,000 to $12,499 | 3 (0.6%) | 9 (2.2%) |
| $12,500 to $14,999 | 2 (0.4%) | 27 (6.6%) |
| $15,000 to $17,499 | 7 (1.5%) | 6 (1.5%) |
| $17,500 to $19,999 | 2 (0.4%) | 14 (3.4%) |
| $20,000 to $22,499 | 12 (2.5%) | 16 (3.9%) |
| $22,500 to $24,999 | 18 (3.7%) | 27 (6.6%) |
| $25,000 to $29,999 | 14 (2.9%) | 34 (8.3%) |
| $30,000 to $34,999 | 4 (0.8%) | 8 (1.9%) |
| $35,000 to $39,999 | 8 (1.7%) | 8 (1.9%) |
| $40,000 to $44,999 | 19 (4.0%) | 3 (0.7%) |
| $45,000 to $49,999 | 28 (5.8%) | 34 (8.3%) |
| $50,000 to $54,999 | 55 (11.5%) | 25 (6.1%) |
| $55,000 to $64,999 | 15 (3.1%) | 27 (6.6%) |
| $65,000 to $74,999 | 26 (5.4%) | 24 (5.9%) |
| $75,000 to $99,999 | 44 (9.2%) | 47 (11.5%) |
| $100,000+ | 73 (15.2%) | 8 (1.9%) |
| Total | 480 (100.0%) | 410 (100.0%) |
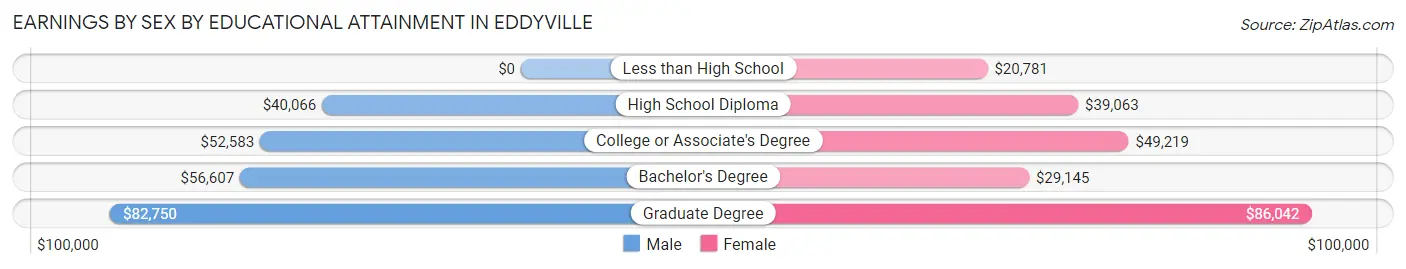
Earnings by Sex by Educational Attainment in Eddyville
Average earnings in Eddyville are $52,500 for men and $47,989 for women, a difference of 8.6%. Men with an educational attainment of graduate degree enjoy the highest average annual earnings of $82,750, while those with high school diploma education earn the least with $40,066. Women with an educational attainment of graduate degree earn the most with the average annual earnings of $86,042, while those with less than high school education have the smallest earnings of $20,781.
| Educational Attainment | Male Income | Female Income |
| Less than High School | - | - |
| High School Diploma | $40,066 | $39,063 |
| College or Associate's Degree | $52,583 | $49,219 |
| Bachelor's Degree | $56,607 | $29,145 |
| Graduate Degree | $82,750 | $86,042 |
| Total | $52,500 | $47,989 |
Family Income in Eddyville
Family Income Brackets in Eddyville
According to the Eddyville family income data, there are 93 families falling into the $100,000 to $149,999 income range, which is the most common income bracket and makes up 22.1% of all families. Conversely, the $15,000 to $24,999 income bracket is the least frequent group with only 7 families (1.7%) belonging to this category.
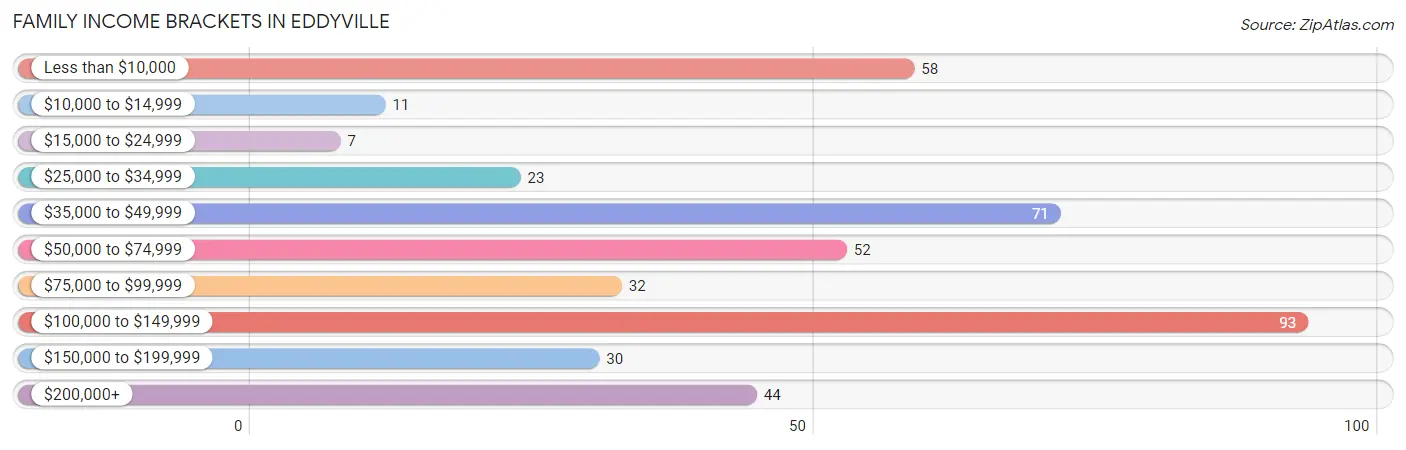
| Income Bracket | # Families | % Families |
| Less than $10,000 | 58 | 13.8% |
| $10,000 to $14,999 | 11 | 2.6% |
| $15,000 to $24,999 | 7 | 1.7% |
| $25,000 to $34,999 | 23 | 5.5% |
| $35,000 to $49,999 | 71 | 16.9% |
| $50,000 to $74,999 | 52 | 12.4% |
| $75,000 to $99,999 | 32 | 7.6% |
| $100,000 to $149,999 | 93 | 22.1% |
| $150,000 to $199,999 | 30 | 7.1% |
| $200,000+ | 44 | 10.5% |
Family Income by Famaliy Size in Eddyville
5-person families (52 | 12.3%) account for the highest median family income in Eddyville with $100,667 per family, while 3-person families (81 | 19.2%) have the highest median income of $31,162 per family member.
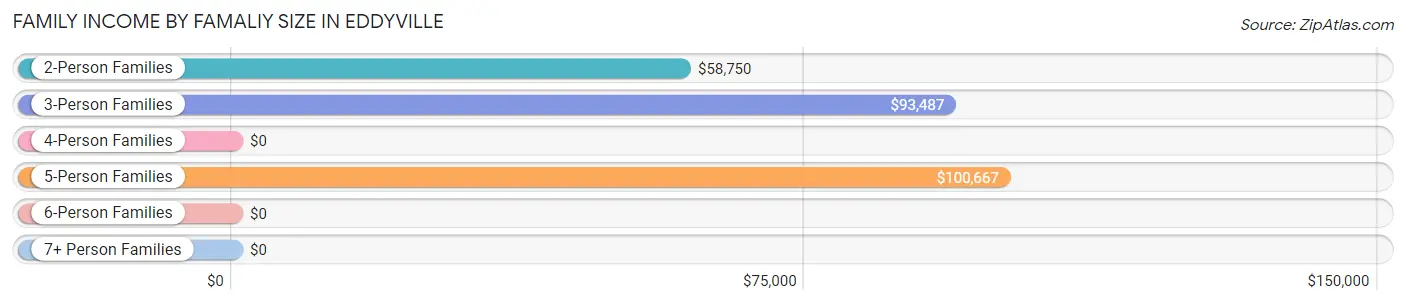
| Income Bracket | # Families | Median Income |
| 2-Person Families | 244 (58.0%) | $58,750 |
| 3-Person Families | 81 (19.2%) | $93,487 |
| 4-Person Families | 39 (9.3%) | $0 |
| 5-Person Families | 52 (12.3%) | $100,667 |
| 6-Person Families | 5 (1.2%) | $0 |
| 7+ Person Families | 0 (0.0%) | $0 |
| Total | 421 (100.0%) | $70,625 |
Family Income by Number of Earners in Eddyville
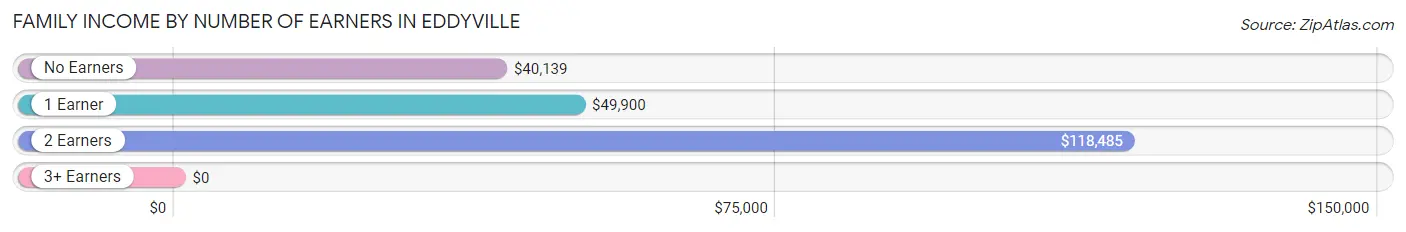
| Number of Earners | # Families | Median Income |
| No Earners | 70 (16.6%) | $40,139 |
| 1 Earner | 146 (34.7%) | $49,900 |
| 2 Earners | 170 (40.4%) | $118,485 |
| 3+ Earners | 35 (8.3%) | $0 |
| Total | 421 (100.0%) | $70,625 |
Household Income in Eddyville
Household Income Brackets in Eddyville
With 133 households falling in the category, the $15,000 to $24,999 income range is the most frequent in Eddyville, accounting for 16.7% of all households. In contrast, only 38 households (4.8%) fall into the $150,000 to $199,999 income bracket, making it the least populous group.
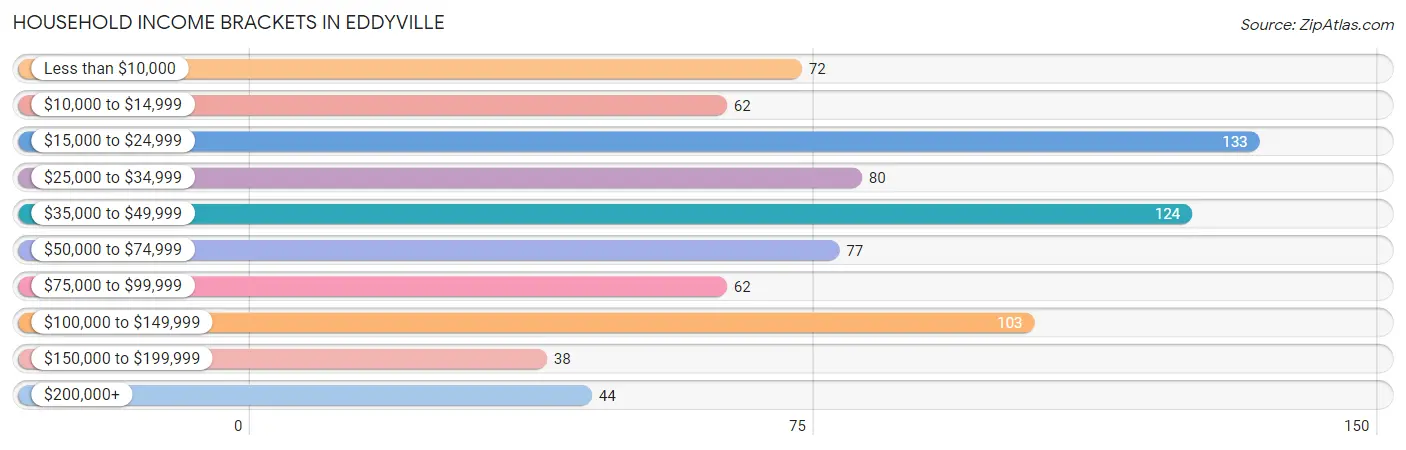
| Income Bracket | # Households | % Households |
| Less than $10,000 | 72 | 9.1% |
| $10,000 to $14,999 | 62 | 7.8% |
| $15,000 to $24,999 | 133 | 16.7% |
| $25,000 to $34,999 | 80 | 10.1% |
| $35,000 to $49,999 | 124 | 15.6% |
| $50,000 to $74,999 | 77 | 9.7% |
| $75,000 to $99,999 | 62 | 7.8% |
| $100,000 to $149,999 | 103 | 13.0% |
| $150,000 to $199,999 | 38 | 4.8% |
| $200,000+ | 44 | 5.5% |
Household Income by Householder Age in Eddyville
The median household income in Eddyville is $37,475, with the highest median household income of $54,479 found in the 45 to 64 years age bracket for the primary householder. A total of 263 households (33.1%) fall into this category. Meanwhile, the 15 to 24 years age bracket for the primary householder has the lowest median household income of $0, with 54 households (6.8%) in this group.
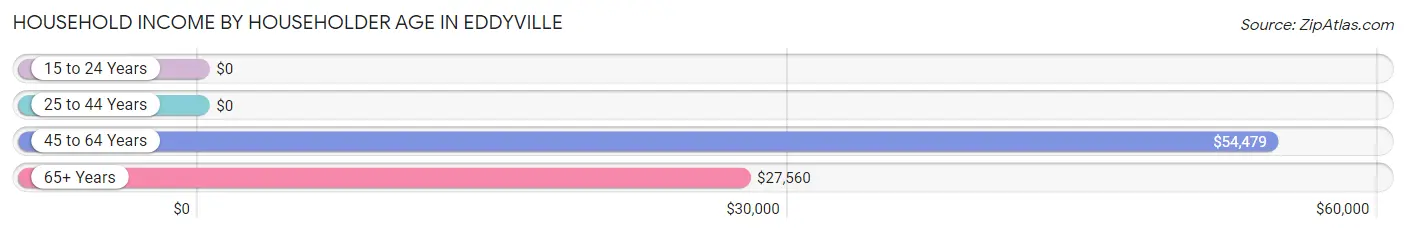
| Income Bracket | # Households | Median Income |
| 15 to 24 Years | 54 (6.8%) | $0 |
| 25 to 44 Years | 233 (29.3%) | $0 |
| 45 to 64 Years | 263 (33.1%) | $54,479 |
| 65+ Years | 245 (30.8%) | $27,560 |
| Total | 795 (100.0%) | $37,475 |
Poverty in Eddyville
Income Below Poverty by Sex and Age in Eddyville
With 15.7% poverty level for males and 22.5% for females among the residents of Eddyville, 18 to 24 year old males and 5 year old females are the most vulnerable to poverty, with 65 males (95.6%) and 5 females (100.0%) in their respective age groups living below the poverty level.
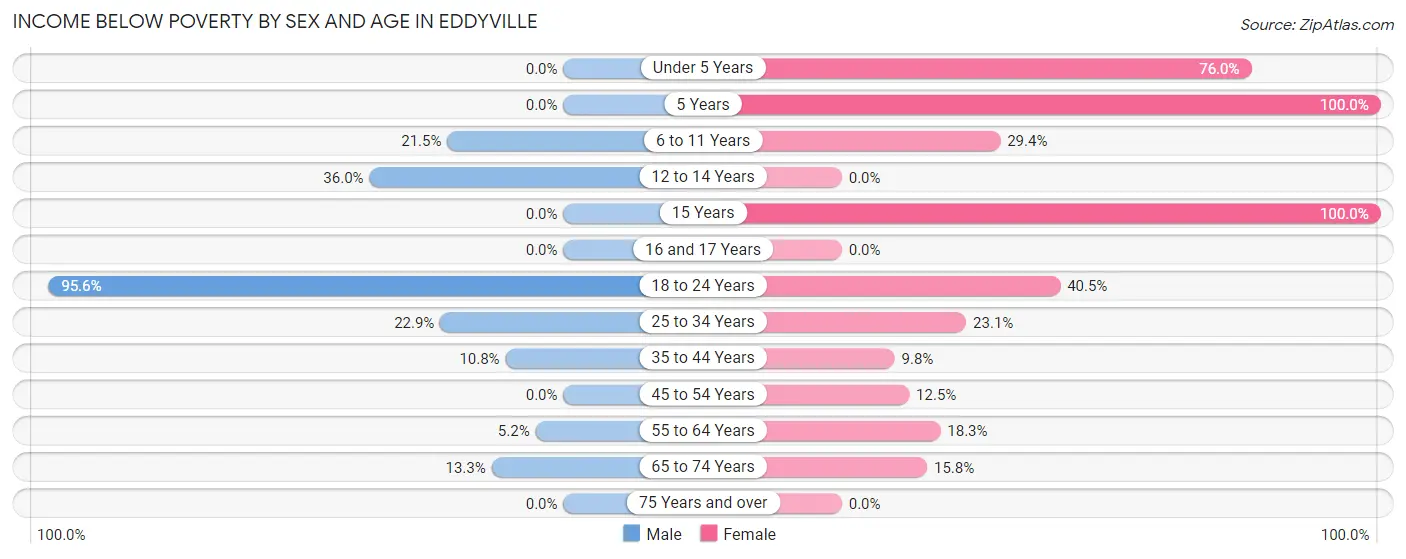
| Age Bracket | Male | Female |
| Under 5 Years | 0 (0.0%) | 38 (76.0%) |
| 5 Years | 0 (0.0%) | 5 (100.0%) |
| 6 to 11 Years | 14 (21.5%) | 10 (29.4%) |
| 12 to 14 Years | 9 (36.0%) | 0 (0.0%) |
| 15 Years | 0 (0.0%) | 7 (100.0%) |
| 16 and 17 Years | 0 (0.0%) | 0 (0.0%) |
| 18 to 24 Years | 65 (95.6%) | 45 (40.5%) |
| 25 to 34 Years | 40 (22.9%) | 27 (23.1%) |
| 35 to 44 Years | 10 (10.7%) | 5 (9.8%) |
| 45 to 54 Years | 0 (0.0%) | 14 (12.5%) |
| 55 to 64 Years | 6 (5.2%) | 15 (18.3%) |
| 65 to 74 Years | 8 (13.3%) | 19 (15.8%) |
| 75 Years and over | 0 (0.0%) | 0 (0.0%) |
| Total | 152 (15.7%) | 185 (22.5%) |
Income Above Poverty by Sex and Age in Eddyville
According to the poverty statistics in Eddyville, males aged under 5 years and females aged 12 to 14 years are the age groups that are most secure financially, with 100.0% of males and 100.0% of females in these age groups living above the poverty line.
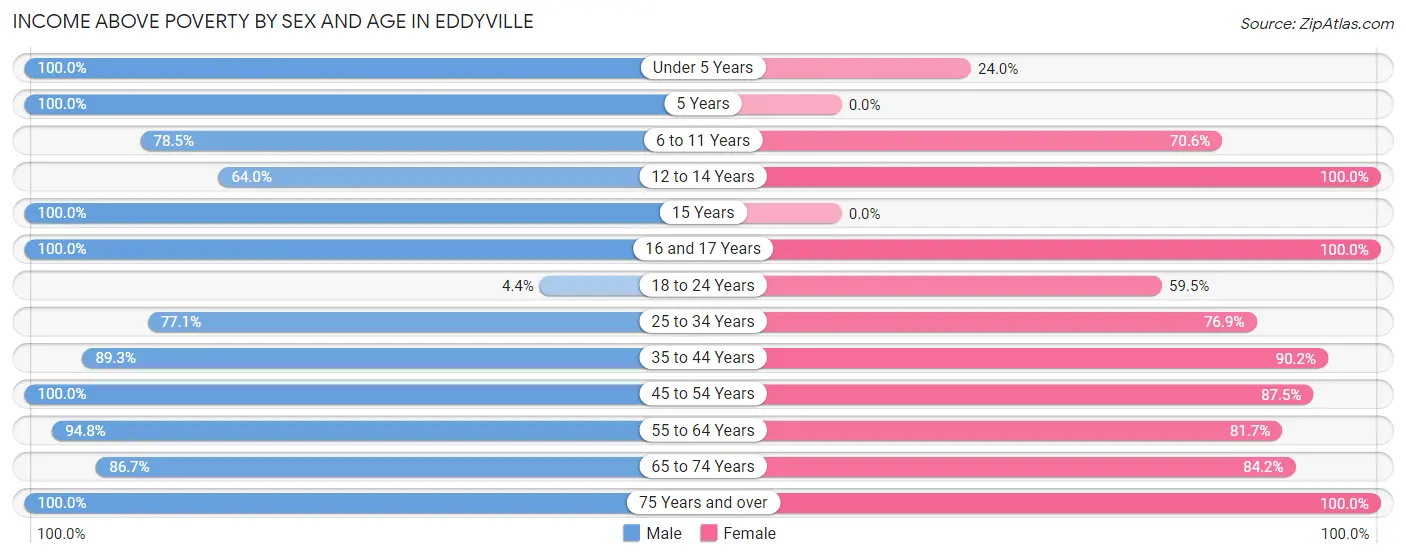
| Age Bracket | Male | Female |
| Under 5 Years | 144 (100.0%) | 12 (24.0%) |
| 5 Years | 26 (100.0%) | 0 (0.0%) |
| 6 to 11 Years | 51 (78.5%) | 24 (70.6%) |
| 12 to 14 Years | 16 (64.0%) | 16 (100.0%) |
| 15 Years | 9 (100.0%) | 0 (0.0%) |
| 16 and 17 Years | 4 (100.0%) | 12 (100.0%) |
| 18 to 24 Years | 3 (4.4%) | 66 (59.5%) |
| 25 to 34 Years | 135 (77.1%) | 90 (76.9%) |
| 35 to 44 Years | 83 (89.2%) | 46 (90.2%) |
| 45 to 54 Years | 74 (100.0%) | 98 (87.5%) |
| 55 to 64 Years | 110 (94.8%) | 67 (81.7%) |
| 65 to 74 Years | 52 (86.7%) | 101 (84.2%) |
| 75 Years and over | 111 (100.0%) | 104 (100.0%) |
| Total | 818 (84.3%) | 636 (77.5%) |
Income Below Poverty Among Married-Couple Families in Eddyville
The poverty statistics for married-couple families in Eddyville show that 4.4% or 11 of the total 250 families live below the poverty line. Families with no children have the highest poverty rate of 6.7%, comprising of 11 families. On the other hand, families with 1 or 2 children have the lowest poverty rate of 0.0%, which includes 0 families.
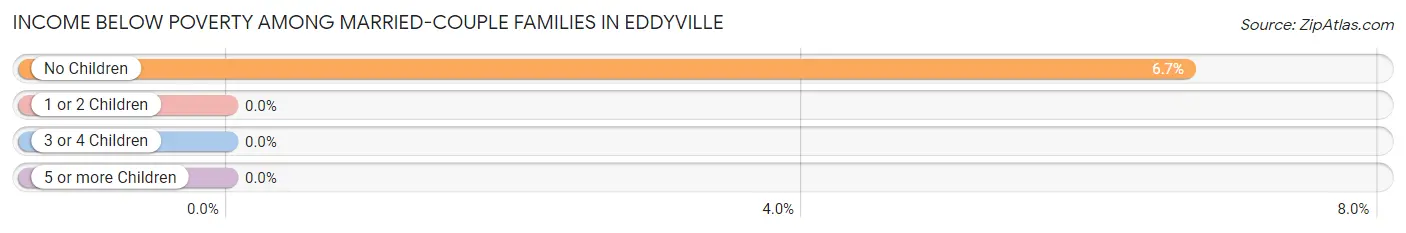
| Children | Above Poverty | Below Poverty |
| No Children | 154 (93.3%) | 11 (6.7%) |
| 1 or 2 Children | 55 (100.0%) | 0 (0.0%) |
| 3 or 4 Children | 30 (100.0%) | 0 (0.0%) |
| 5 or more Children | 0 (0.0%) | 0 (0.0%) |
| Total | 239 (95.6%) | 11 (4.4%) |
Income Below Poverty Among Single-Parent Households in Eddyville
According to the poverty data in Eddyville, 33.8% or 23 single-father households and 40.8% or 42 single-mother households are living below the poverty line. Among single-father households, those with no children have the highest poverty rate, with 23 households (46.9%) experiencing poverty. Likewise, among single-mother households, those with 3 or 4 children have the highest poverty rate, with 15 households (75.0%) falling below the poverty line.
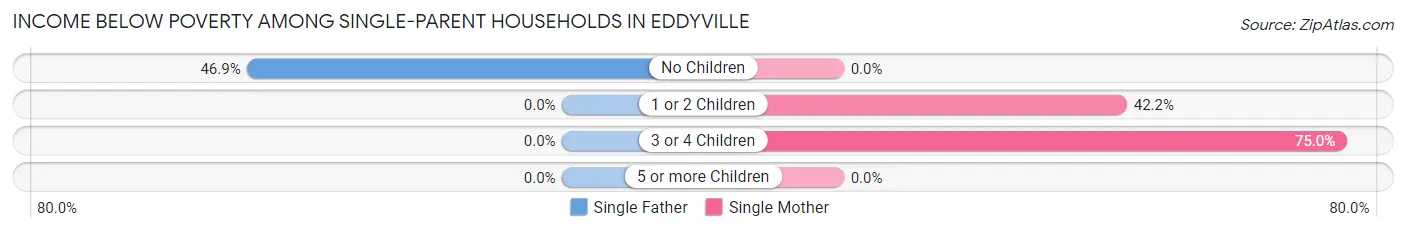
| Children | Single Father | Single Mother |
| No Children | 23 (46.9%) | 0 (0.0%) |
| 1 or 2 Children | 0 (0.0%) | 27 (42.2%) |
| 3 or 4 Children | 0 (0.0%) | 15 (75.0%) |
| 5 or more Children | 0 (0.0%) | 0 (0.0%) |
| Total | 23 (33.8%) | 42 (40.8%) |
Income Below Poverty Among Married-Couple vs Single-Parent Households in Eddyville
The poverty data for Eddyville shows that 11 of the married-couple family households (4.4%) and 65 of the single-parent households (38.0%) are living below the poverty level. Within the married-couple family households, those with no children have the highest poverty rate, with 11 households (6.7%) falling below the poverty line. Among the single-parent households, those with 3 or 4 children have the highest poverty rate, with 15 household (48.4%) living below poverty.
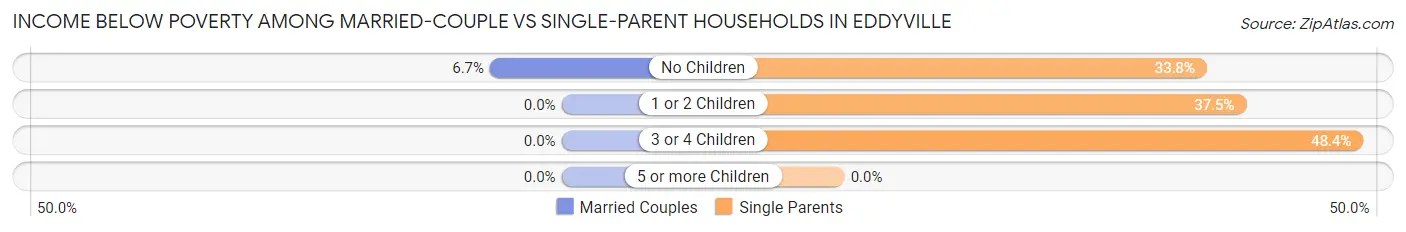
| Children | Married-Couple Families | Single-Parent Households |
| No Children | 11 (6.7%) | 23 (33.8%) |
| 1 or 2 Children | 0 (0.0%) | 27 (37.5%) |
| 3 or 4 Children | 0 (0.0%) | 15 (48.4%) |
| 5 or more Children | 0 (0.0%) | 0 (0.0%) |
| Total | 11 (4.4%) | 65 (38.0%) |
Race in Eddyville
The most populous races in Eddyville are White / Caucasian (2,333 | 83.8%), Black / African American (338 | 12.1%), and Hispanic or Latino (122 | 4.4%).
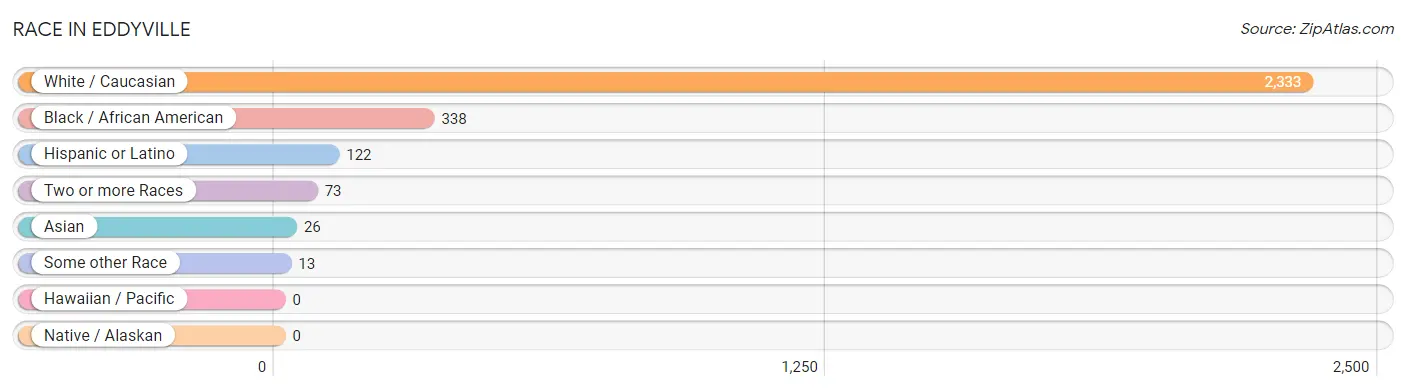
| Race | # Population | % Population |
| Asian | 26 | 0.9% |
| Black / African American | 338 | 12.1% |
| Hawaiian / Pacific | 0 | 0.0% |
| Hispanic or Latino | 122 | 4.4% |
| Native / Alaskan | 0 | 0.0% |
| White / Caucasian | 2,333 | 83.8% |
| Two or more Races | 73 | 2.6% |
| Some other Race | 13 | 0.5% |
| Total | 2,783 | 100.0% |
Ancestry in Eddyville
The most populous ancestries reported in Eddyville are English (687 | 24.7%), American (182 | 6.5%), Irish (177 | 6.4%), German (150 | 5.4%), and European (132 | 4.7%), together accounting for 47.7% of all Eddyville residents.
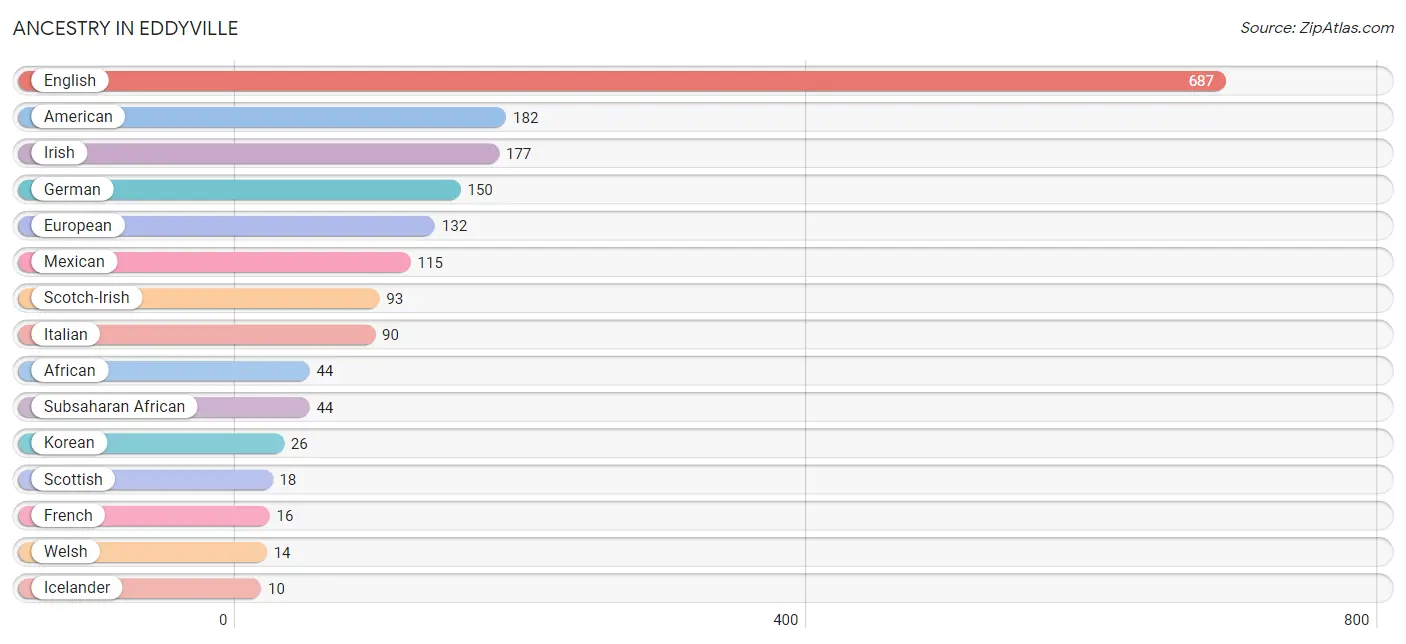
| Ancestry | # Population | % Population |
| African | 44 | 1.6% |
| American | 182 | 6.5% |
| Cherokee | 5 | 0.2% |
| English | 687 | 24.7% |
| European | 132 | 4.7% |
| French | 16 | 0.6% |
| French Canadian | 4 | 0.1% |
| German | 150 | 5.4% |
| Icelander | 10 | 0.4% |
| Irish | 177 | 6.4% |
| Italian | 90 | 3.2% |
| Korean | 26 | 0.9% |
| Mexican | 115 | 4.1% |
| Pennsylvania German | 4 | 0.1% |
| Polish | 5 | 0.2% |
| Portuguese | 7 | 0.3% |
| Puerto Rican | 7 | 0.3% |
| Scotch-Irish | 93 | 3.3% |
| Scottish | 18 | 0.6% |
| Subsaharan African | 44 | 1.6% |
| Welsh | 14 | 0.5% | View All 21 Rows |
Immigrants in Eddyville
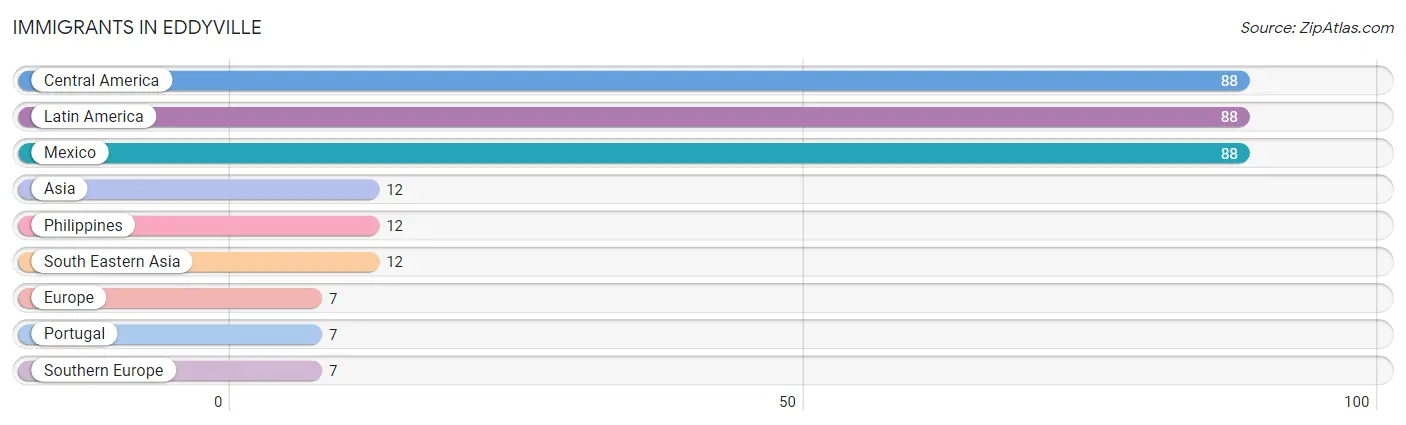
The most numerous immigrant groups reported in Eddyville came from Central America (88 | 3.2%), Latin America (88 | 3.2%), Mexico (88 | 3.2%), Asia (12 | 0.4%), and Philippines (12 | 0.4%), together accounting for 10.3% of all Eddyville residents.
| Immigration Origin | # Population | % Population |
| Asia | 12 | 0.4% |
| Central America | 88 | 3.2% |
| Europe | 7 | 0.3% |
| Latin America | 88 | 3.2% |
| Mexico | 88 | 3.2% |
| Philippines | 12 | 0.4% |
| Portugal | 7 | 0.3% |
| South Eastern Asia | 12 | 0.4% |
| Southern Europe | 7 | 0.3% | View All 9 Rows |
Sex and Age in Eddyville
Sex and Age in Eddyville
The most populous age groups in Eddyville are 25 to 29 Years (325 | 16.6%) for men and 20 to 24 Years (96 | 11.7%) for women.
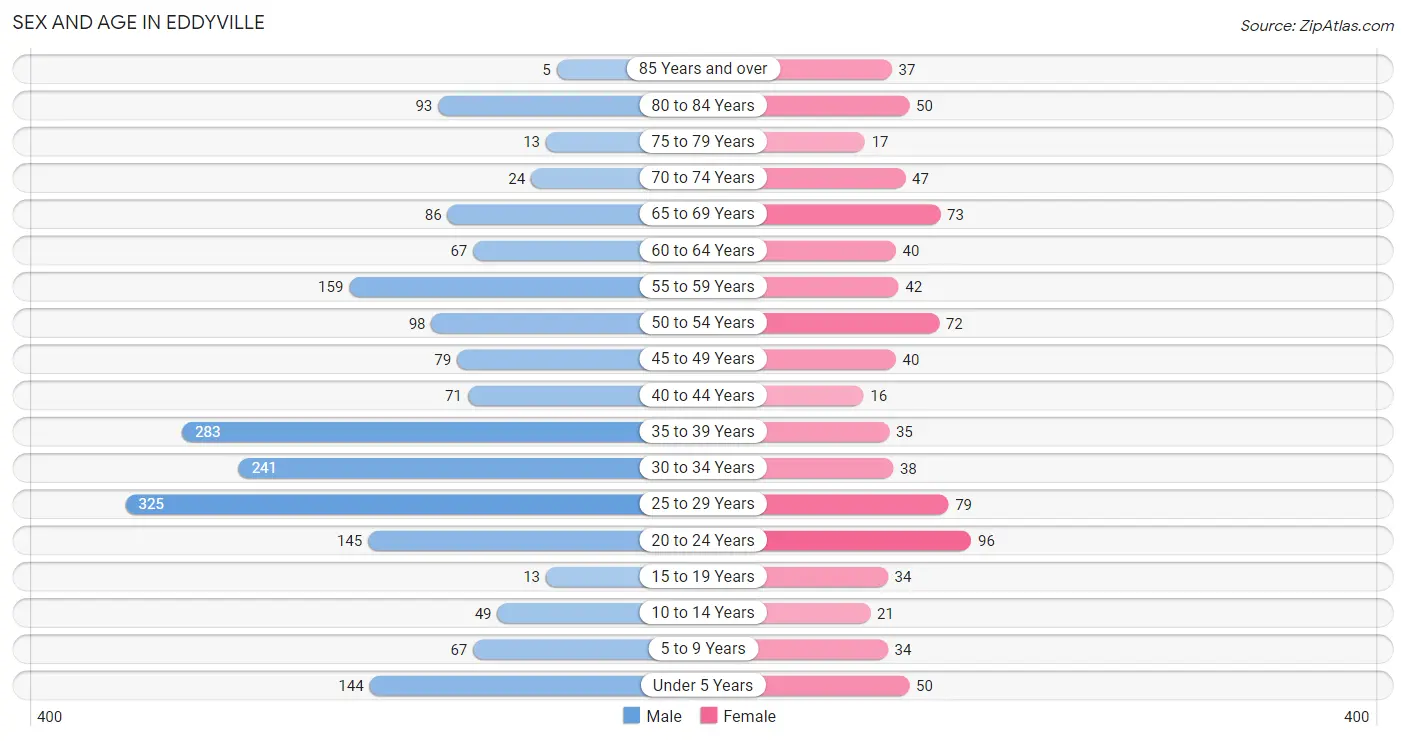
| Age Bracket | Male | Female |
| Under 5 Years | 144 (7.3%) | 50 (6.1%) |
| 5 to 9 Years | 67 (3.4%) | 34 (4.1%) |
| 10 to 14 Years | 49 (2.5%) | 21 (2.6%) |
| 15 to 19 Years | 13 (0.7%) | 34 (4.1%) |
| 20 to 24 Years | 145 (7.4%) | 96 (11.7%) |
| 25 to 29 Years | 325 (16.6%) | 79 (9.6%) |
| 30 to 34 Years | 241 (12.3%) | 38 (4.6%) |
| 35 to 39 Years | 283 (14.4%) | 35 (4.3%) |
| 40 to 44 Years | 71 (3.6%) | 16 (1.9%) |
| 45 to 49 Years | 79 (4.0%) | 40 (4.9%) |
| 50 to 54 Years | 98 (5.0%) | 72 (8.8%) |
| 55 to 59 Years | 159 (8.1%) | 42 (5.1%) |
| 60 to 64 Years | 67 (3.4%) | 40 (4.9%) |
| 65 to 69 Years | 86 (4.4%) | 73 (8.9%) |
| 70 to 74 Years | 24 (1.2%) | 47 (5.7%) |
| 75 to 79 Years | 13 (0.7%) | 17 (2.1%) |
| 80 to 84 Years | 93 (4.7%) | 50 (6.1%) |
| 85 Years and over | 5 (0.3%) | 37 (4.5%) |
| Total | 1,962 (100.0%) | 821 (100.0%) |
Families and Households in Eddyville
Median Family Size in Eddyville
The median family size in Eddyville is 3.20 persons per family, with single male/father families (68 | 16.2%) accounting for the largest median family size of 4.62 persons per family. On the other hand, married-couple families (250 | 59.4%) represent the smallest median family size with 2.86 persons per family.
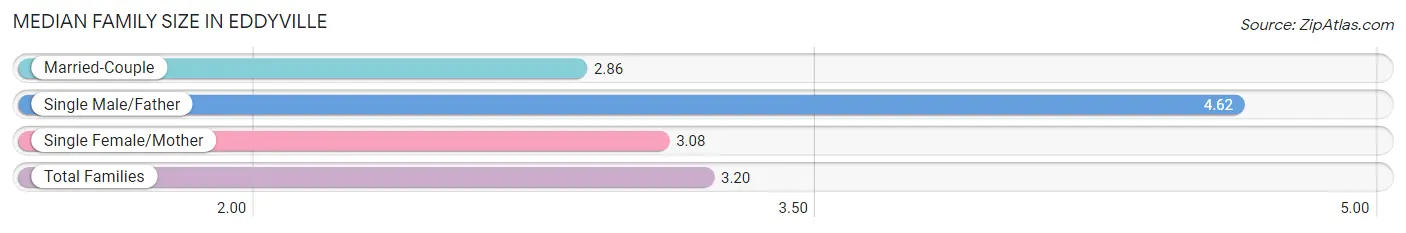
| Family Type | # Families | Family Size |
| Married-Couple | 250 (59.4%) | 2.86 |
| Single Male/Father | 68 (16.2%) | 4.62 |
| Single Female/Mother | 103 (24.5%) | 3.08 |
| Total Families | 421 (100.0%) | 3.20 |
Median Household Size in Eddyville
The median household size in Eddyville is 2.25 persons per household, with single male/father households (68 | 8.6%) accounting for the largest median household size of 4.88 persons per household. non-family households (374 | 47.0%) represent the smallest median household size with 1.09 persons per household.
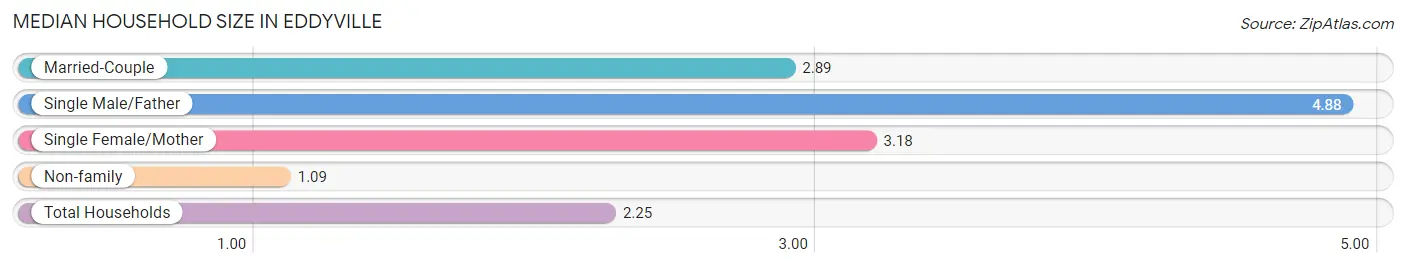
| Household Type | # Households | Household Size |
| Married-Couple | 250 (31.5%) | 2.89 |
| Single Male/Father | 68 (8.6%) | 4.88 |
| Single Female/Mother | 103 (13.0%) | 3.18 |
| Non-family | 374 (47.0%) | 1.09 |
| Total Households | 795 (100.0%) | 2.25 |
Household Size by Marriage Status in Eddyville
Out of a total of 795 households in Eddyville, 421 (53.0%) are family households, while 374 (47.0%) are nonfamily households. The most numerous type of family households are 2-person households, comprising 244, and the most common type of nonfamily households are 1-person households, comprising 339.
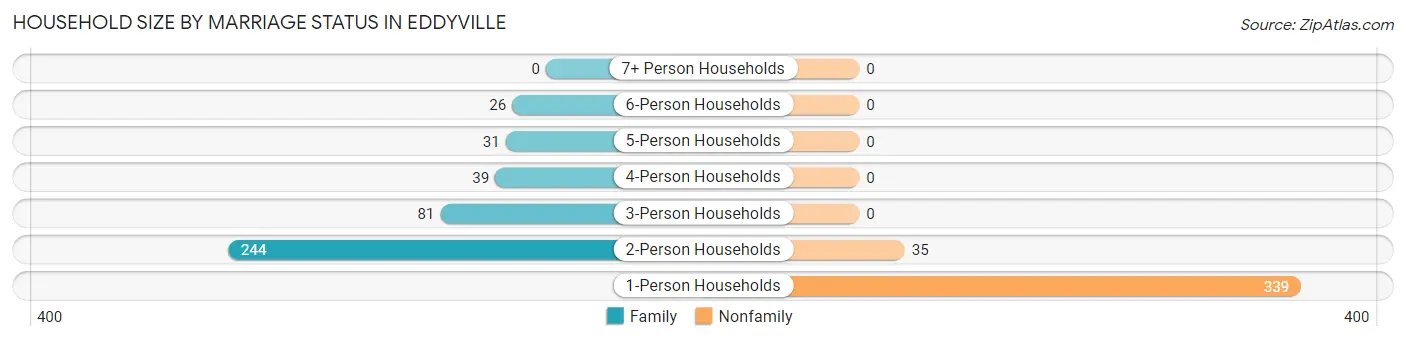
| Household Size | Family Households | Nonfamily Households |
| 1-Person Households | - | 339 (42.6%) |
| 2-Person Households | 244 (30.7%) | 35 (4.4%) |
| 3-Person Households | 81 (10.2%) | 0 (0.0%) |
| 4-Person Households | 39 (4.9%) | 0 (0.0%) |
| 5-Person Households | 31 (3.9%) | 0 (0.0%) |
| 6-Person Households | 26 (3.3%) | 0 (0.0%) |
| 7+ Person Households | 0 (0.0%) | 0 (0.0%) |
| Total | 421 (53.0%) | 374 (47.0%) |
Female Fertility in Eddyville
Fertility by Age in Eddyville
Average fertility rate in Eddyville is 132.0 births per 1,000 women. Women in the age bracket of 20 to 34 years have the highest fertility rate with 183.0 births per 1,000 women. Women in the age bracket of 20 to 34 years acount for 86.7% of all women with births.
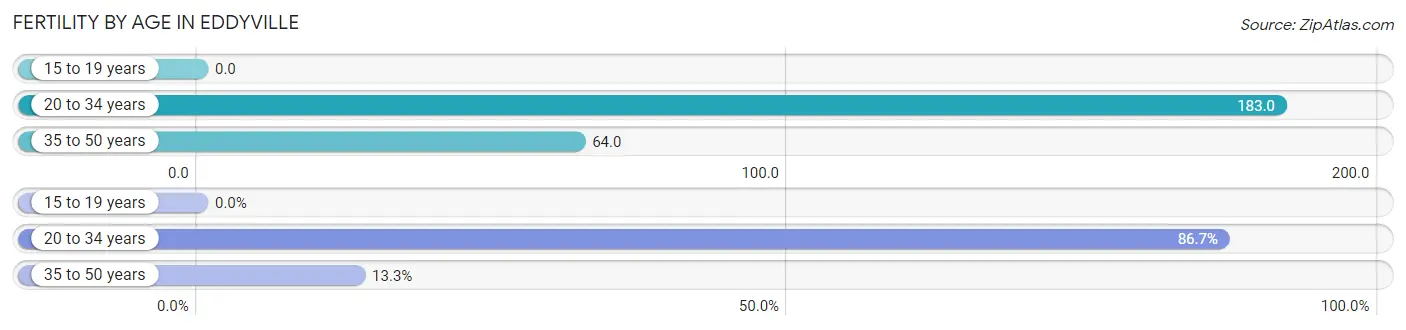
| Age Bracket | Women with Births | Births / 1,000 Women |
| 15 to 19 years | 0 (0.0%) | 0.0 |
| 20 to 34 years | 39 (86.7%) | 183.0 |
| 35 to 50 years | 6 (13.3%) | 64.0 |
| Total | 45 (100.0%) | 132.0 |
Fertility by Age by Marriage Status in Eddyville
13.3% of women with births (45) in Eddyville are married. The highest percentage of unmarried women with births falls into 20 to 34 years age bracket with 100.0% of them unmarried at the time of birth, while the lowest percentage of unmarried women with births belong to 35 to 50 years age bracket with 0.0% of them unmarried.
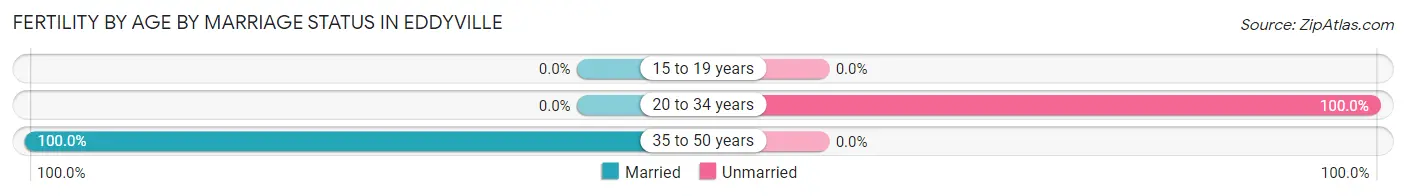
| Age Bracket | Married | Unmarried |
| 15 to 19 years | 0 (0.0%) | 0 (0.0%) |
| 20 to 34 years | 0 (0.0%) | 39 (100.0%) |
| 35 to 50 years | 6 (100.0%) | 0 (0.0%) |
| Total | 6 (13.3%) | 39 (86.7%) |
Fertility by Education in Eddyville
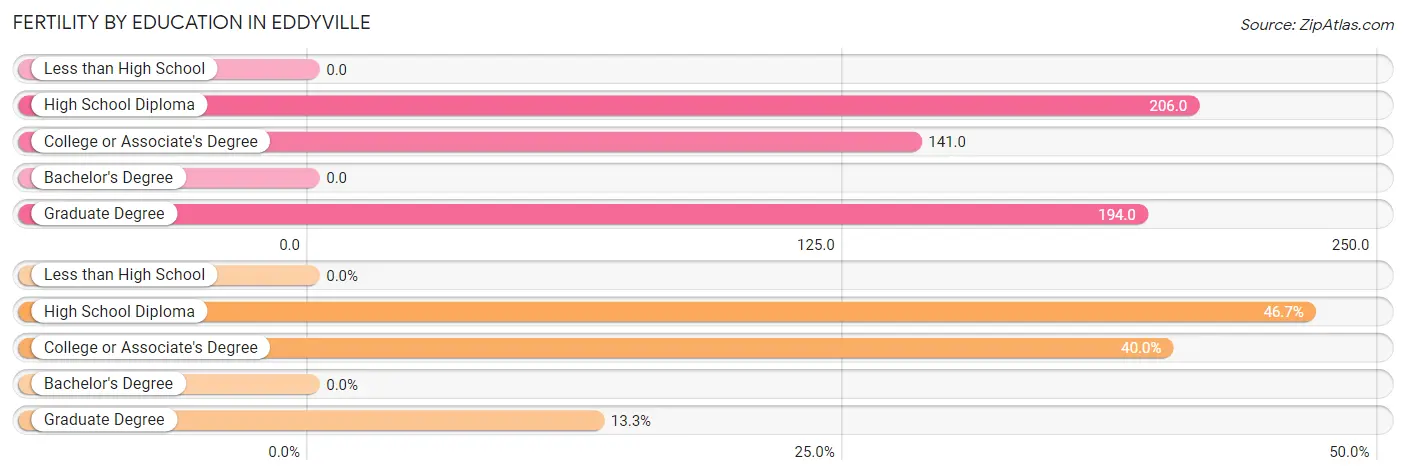
| Educational Attainment | Women with Births | Births / 1,000 Women |
| Less than High School | 0 (0.0%) | 0.0 |
| High School Diploma | 21 (46.7%) | 206.0 |
| College or Associate's Degree | 18 (40.0%) | 141.0 |
| Bachelor's Degree | 0 (0.0%) | 0.0 |
| Graduate Degree | 6 (13.3%) | 194.0 |
| Total | 45 (100.0%) | 132.0 |
Fertility by Education by Marriage Status in Eddyville
86.7% of women with births in Eddyville are unmarried. Women with the educational attainment of graduate degree are most likely to be married with 100.0% of them married at childbirth, while women with the educational attainment of high school diploma are least likely to be married with 100.0% of them unmarried at childbirth.
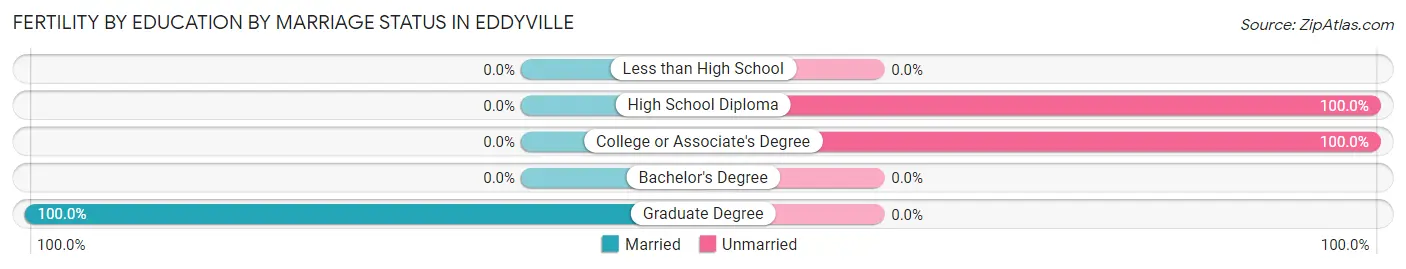
| Educational Attainment | Married | Unmarried |
| Less than High School | 0 (0.0%) | 0 (0.0%) |
| High School Diploma | 0 (0.0%) | 21 (100.0%) |
| College or Associate's Degree | 0 (0.0%) | 18 (100.0%) |
| Bachelor's Degree | 0 (0.0%) | 0 (0.0%) |
| Graduate Degree | 6 (100.0%) | 0 (0.0%) |
| Total | 6 (13.3%) | 39 (86.7%) |
Employment Characteristics in Eddyville
Employment by Class of Employer in Eddyville
Among the 800 employed individuals in Eddyville, private company employees (485 | 60.6%), state government employees (149 | 18.6%), and self-employed (not incorporated) (52 | 6.5%) make up the most common classes of employment.
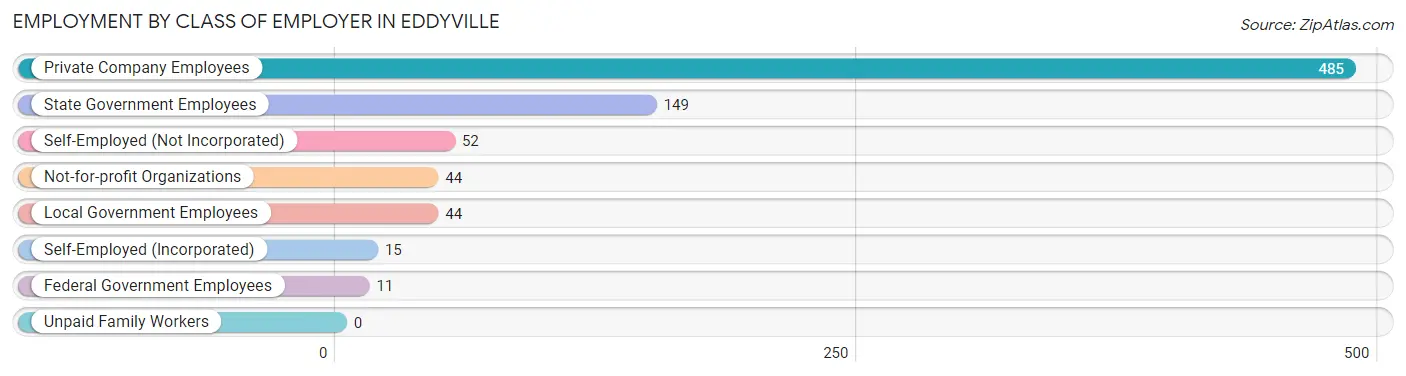
| Employer Class | # Employees | % Employees |
| Private Company Employees | 485 | 60.6% |
| Self-Employed (Incorporated) | 15 | 1.9% |
| Self-Employed (Not Incorporated) | 52 | 6.5% |
| Not-for-profit Organizations | 44 | 5.5% |
| Local Government Employees | 44 | 5.5% |
| State Government Employees | 149 | 18.6% |
| Federal Government Employees | 11 | 1.4% |
| Unpaid Family Workers | 0 | 0.0% |
| Total | 800 | 100.0% |
Employment Status by Age in Eddyville
According to the labor force statistics for Eddyville, out of the total population over 16 years of age (2,402), 35.5% or 853 individuals are in the labor force, with 2.5% or 21 of them unemployed. The age group with the highest labor force participation rate is 16 to 19 years, with 67.7% or 21 individuals in the labor force. Within the labor force, the 16 to 19 years age range has the highest percentage of unemployed individuals, with 28.6% or 6 of them being unemployed.
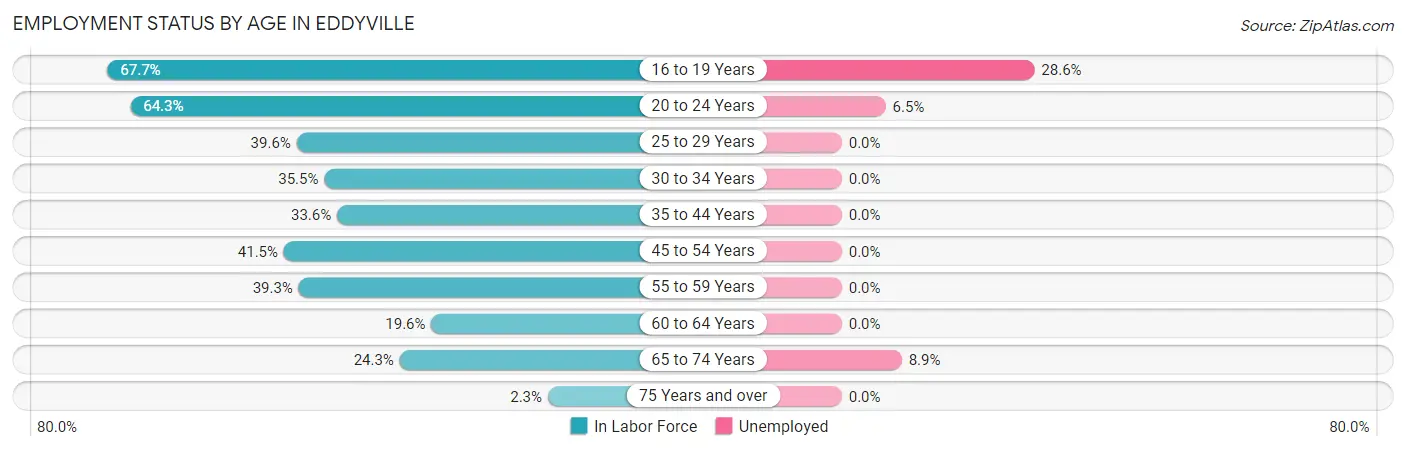
| Age Bracket | In Labor Force | Unemployed |
| 16 to 19 Years | 21 (67.7%) | 6 (28.6%) |
| 20 to 24 Years | 155 (64.3%) | 10 (6.5%) |
| 25 to 29 Years | 160 (39.6%) | 0 (0.0%) |
| 30 to 34 Years | 99 (35.5%) | 0 (0.0%) |
| 35 to 44 Years | 136 (33.6%) | 0 (0.0%) |
| 45 to 54 Years | 120 (41.5%) | 0 (0.0%) |
| 55 to 59 Years | 79 (39.3%) | 0 (0.0%) |
| 60 to 64 Years | 21 (19.6%) | 0 (0.0%) |
| 65 to 74 Years | 56 (24.3%) | 5 (8.9%) |
| 75 Years and over | 5 (2.3%) | 0 (0.0%) |
| Total | 853 (35.5%) | 21 (2.5%) |
Employment Status by Educational Attainment in Eddyville
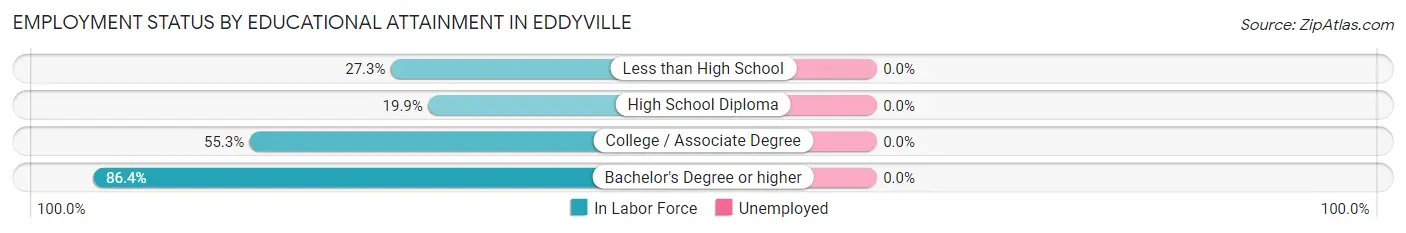
| Educational Attainment | In Labor Force | Unemployed |
| Less than High School | 47 (27.3%) | 0 (0.0%) |
| High School Diploma | 189 (19.9%) | 0 (0.0%) |
| College / Associate Degree | 189 (55.3%) | 0 (0.0%) |
| Bachelor's Degree or higher | 190 (86.4%) | 0 (0.0%) |
| Total | 615 (36.5%) | 0 (0.0%) |
Employment Occupations by Sex in Eddyville
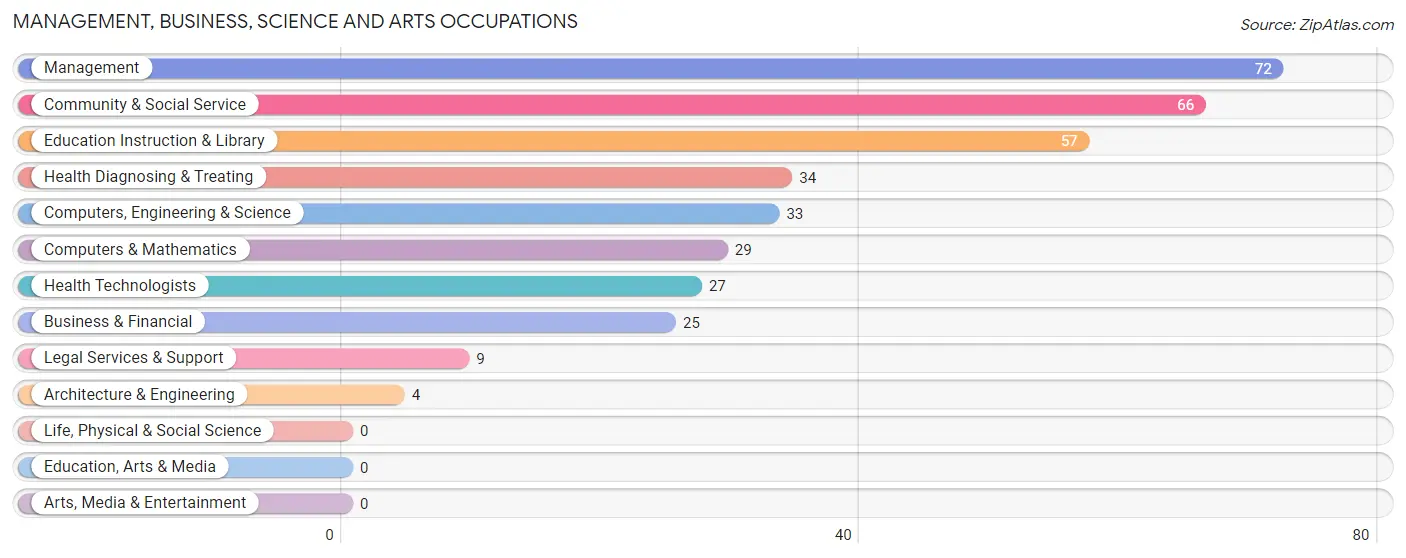
Management, Business, Science and Arts Occupations
The most common Management, Business, Science and Arts occupations in Eddyville are Management (72 | 8.7%), Community & Social Service (66 | 7.9%), Education Instruction & Library (57 | 6.9%), Health Diagnosing & Treating (34 | 4.1%), and Computers, Engineering & Science (33 | 4.0%).
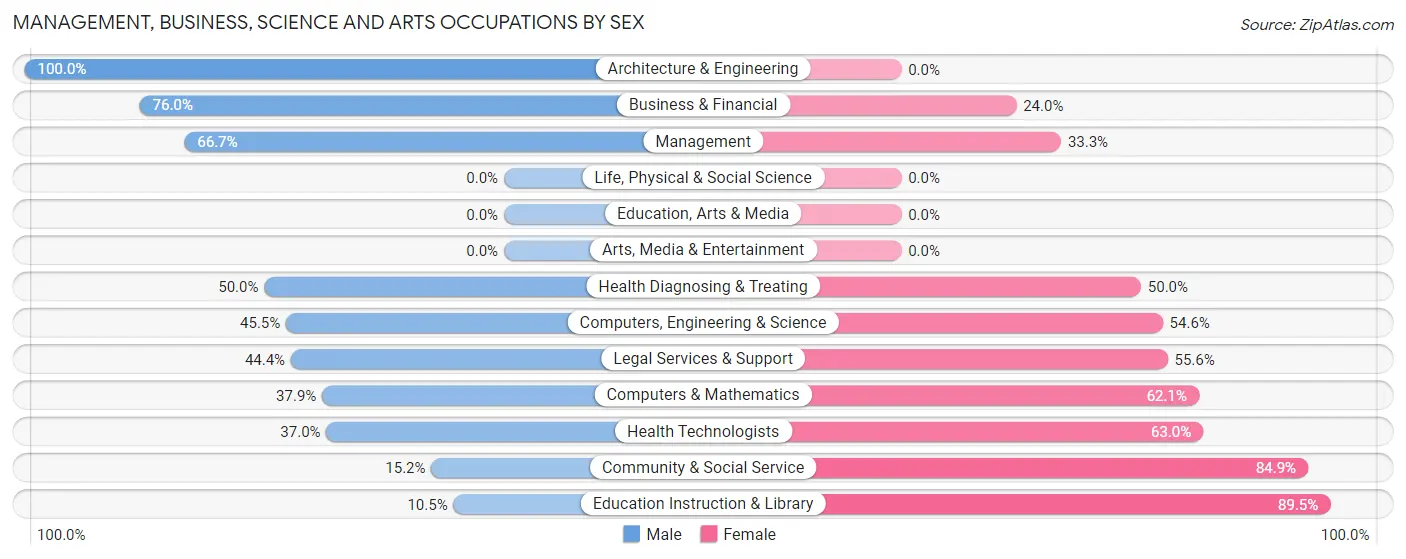
Management, Business, Science and Arts Occupations by Sex
Within the Management, Business, Science and Arts occupations in Eddyville, the most male-oriented occupations are Architecture & Engineering (100.0%), Business & Financial (76.0%), and Management (66.7%), while the most female-oriented occupations are Education Instruction & Library (89.5%), Community & Social Service (84.9%), and Health Technologists (63.0%).
| Occupation | Male | Female |
| Management | 48 (66.7%) | 24 (33.3%) |
| Business & Financial | 19 (76.0%) | 6 (24.0%) |
| Computers, Engineering & Science | 15 (45.5%) | 18 (54.5%) |
| Computers & Mathematics | 11 (37.9%) | 18 (62.1%) |
| Architecture & Engineering | 4 (100.0%) | 0 (0.0%) |
| Life, Physical & Social Science | 0 (0.0%) | 0 (0.0%) |
| Community & Social Service | 10 (15.1%) | 56 (84.9%) |
| Education, Arts & Media | 0 (0.0%) | 0 (0.0%) |
| Legal Services & Support | 4 (44.4%) | 5 (55.6%) |
| Education Instruction & Library | 6 (10.5%) | 51 (89.5%) |
| Arts, Media & Entertainment | 0 (0.0%) | 0 (0.0%) |
| Health Diagnosing & Treating | 17 (50.0%) | 17 (50.0%) |
| Health Technologists | 10 (37.0%) | 17 (63.0%) |
| Total (Category) | 109 (47.4%) | 121 (52.6%) |
| Total (Overall) | 454 (54.6%) | 377 (45.4%) |
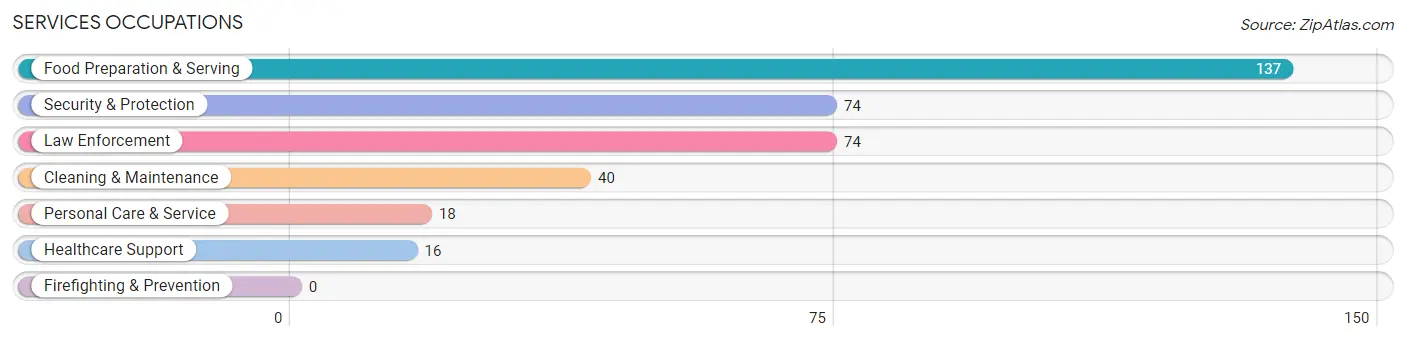
Services Occupations
The most common Services occupations in Eddyville are Food Preparation & Serving (137 | 16.5%), Security & Protection (74 | 8.9%), Law Enforcement (74 | 8.9%), Cleaning & Maintenance (40 | 4.8%), and Personal Care & Service (18 | 2.2%).
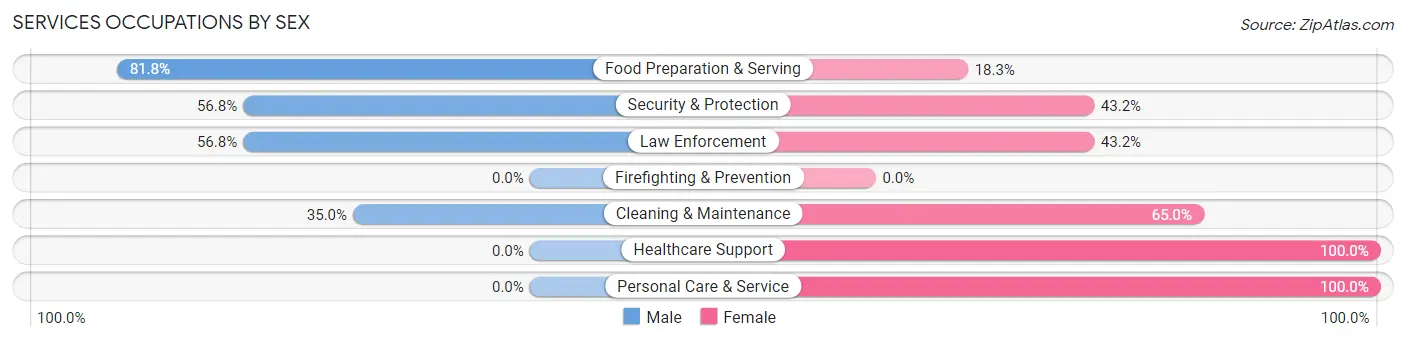
Services Occupations by Sex
Within the Services occupations in Eddyville, the most male-oriented occupations are Food Preparation & Serving (81.8%), Security & Protection (56.8%), and Law Enforcement (56.8%), while the most female-oriented occupations are Healthcare Support (100.0%), Personal Care & Service (100.0%), and Cleaning & Maintenance (65.0%).
| Occupation | Male | Female |
| Healthcare Support | 0 (0.0%) | 16 (100.0%) |
| Security & Protection | 42 (56.8%) | 32 (43.2%) |
| Firefighting & Prevention | 0 (0.0%) | 0 (0.0%) |
| Law Enforcement | 42 (56.8%) | 32 (43.2%) |
| Food Preparation & Serving | 112 (81.8%) | 25 (18.2%) |
| Cleaning & Maintenance | 14 (35.0%) | 26 (65.0%) |
| Personal Care & Service | 0 (0.0%) | 18 (100.0%) |
| Total (Category) | 168 (59.0%) | 117 (41.0%) |
| Total (Overall) | 454 (54.6%) | 377 (45.4%) |
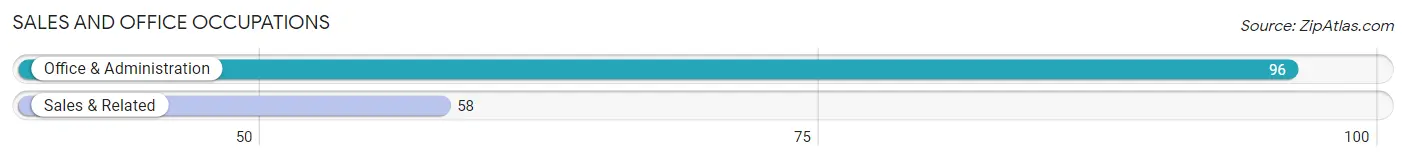
Sales and Office Occupations
The most common Sales and Office occupations in Eddyville are Office & Administration (96 | 11.6%), and Sales & Related (58 | 7.0%).
Sales and Office Occupations by Sex
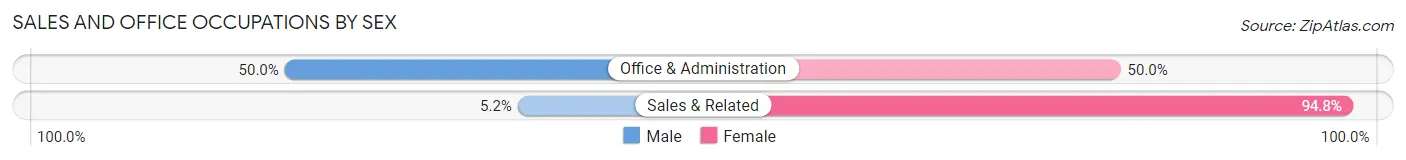
| Occupation | Male | Female |
| Sales & Related | 3 (5.2%) | 55 (94.8%) |
| Office & Administration | 48 (50.0%) | 48 (50.0%) |
| Total (Category) | 51 (33.1%) | 103 (66.9%) |
| Total (Overall) | 454 (54.6%) | 377 (45.4%) |
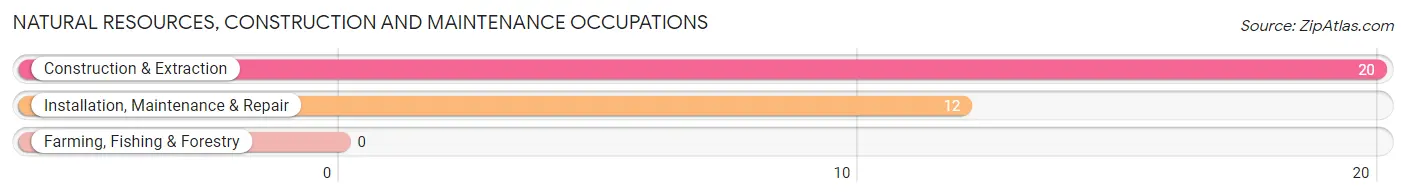
Natural Resources, Construction and Maintenance Occupations
The most common Natural Resources, Construction and Maintenance occupations in Eddyville are Construction & Extraction (20 | 2.4%), and Installation, Maintenance & Repair (12 | 1.4%).
Natural Resources, Construction and Maintenance Occupations by Sex
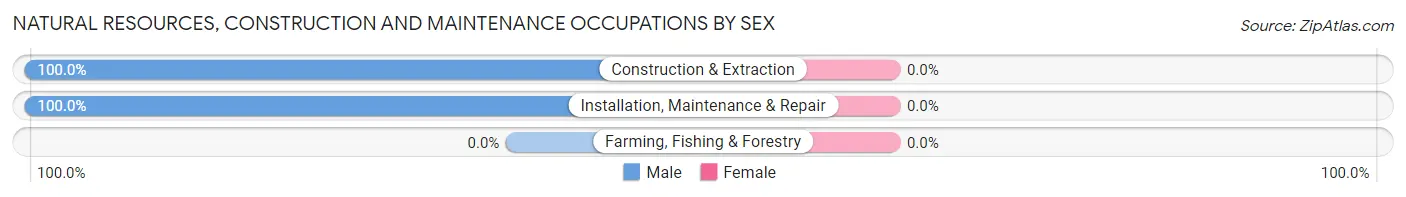
| Occupation | Male | Female |
| Farming, Fishing & Forestry | 0 (0.0%) | 0 (0.0%) |
| Construction & Extraction | 20 (100.0%) | 0 (0.0%) |
| Installation, Maintenance & Repair | 12 (100.0%) | 0 (0.0%) |
| Total (Category) | 32 (100.0%) | 0 (0.0%) |
| Total (Overall) | 454 (54.6%) | 377 (45.4%) |
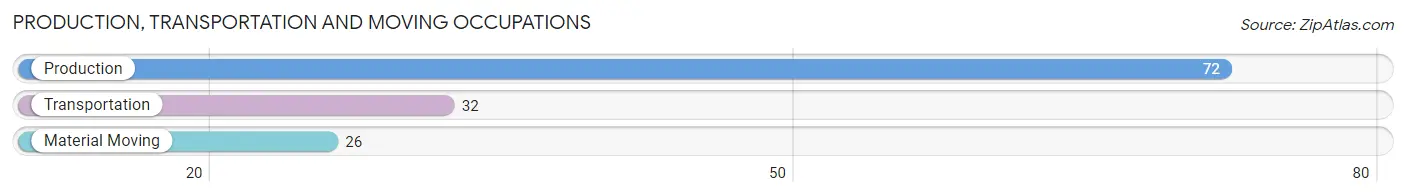
Production, Transportation and Moving Occupations
The most common Production, Transportation and Moving occupations in Eddyville are Production (72 | 8.7%), Transportation (32 | 3.8%), and Material Moving (26 | 3.1%).
Production, Transportation and Moving Occupations by Sex
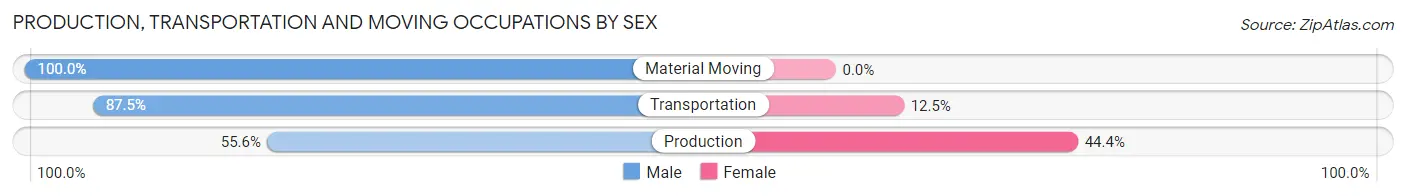
| Occupation | Male | Female |
| Production | 40 (55.6%) | 32 (44.4%) |
| Transportation | 28 (87.5%) | 4 (12.5%) |
| Material Moving | 26 (100.0%) | 0 (0.0%) |
| Total (Category) | 94 (72.3%) | 36 (27.7%) |
| Total (Overall) | 454 (54.6%) | 377 (45.4%) |
Employment Industries by Sex in Eddyville
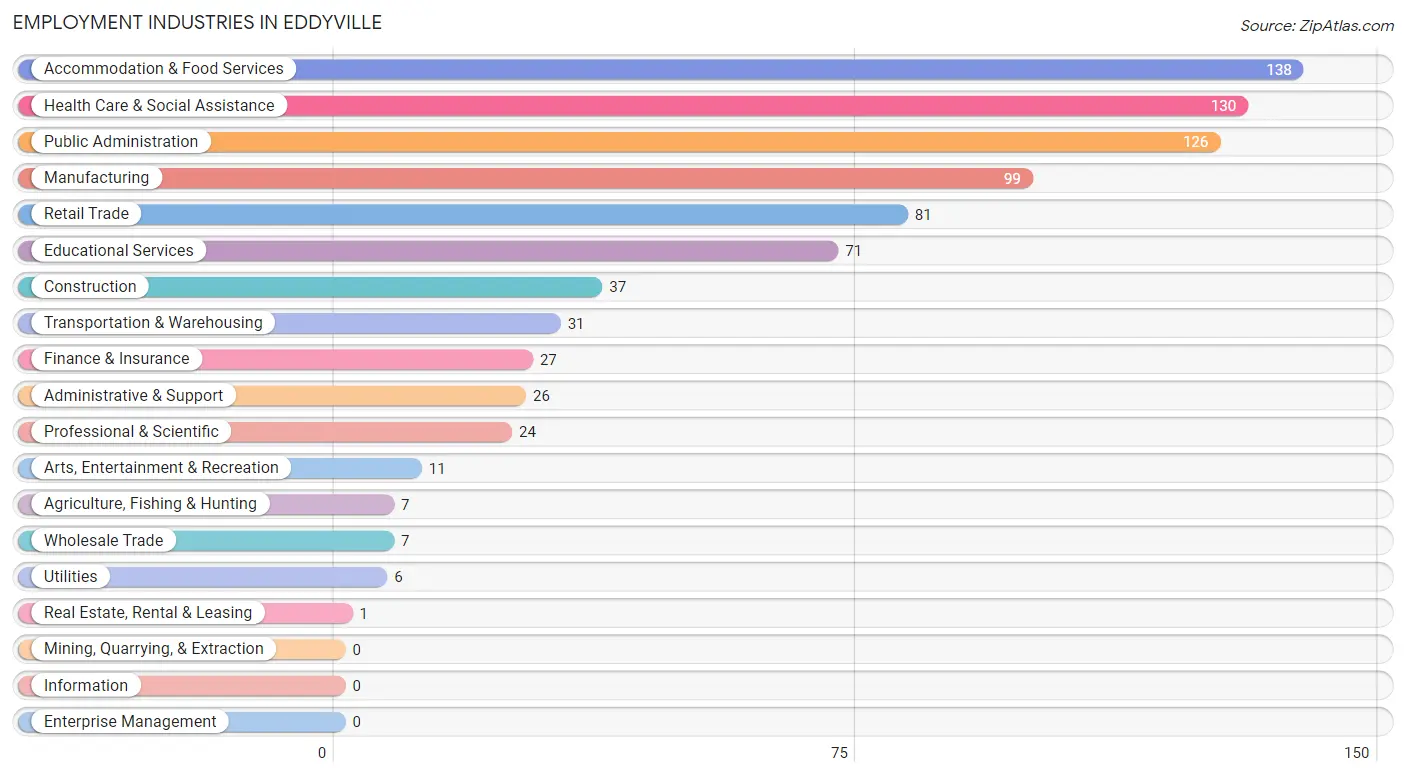
Employment Industries in Eddyville
The major employment industries in Eddyville include Accommodation & Food Services (138 | 16.6%), Health Care & Social Assistance (130 | 15.6%), Public Administration (126 | 15.2%), Manufacturing (99 | 11.9%), and Retail Trade (81 | 9.8%).
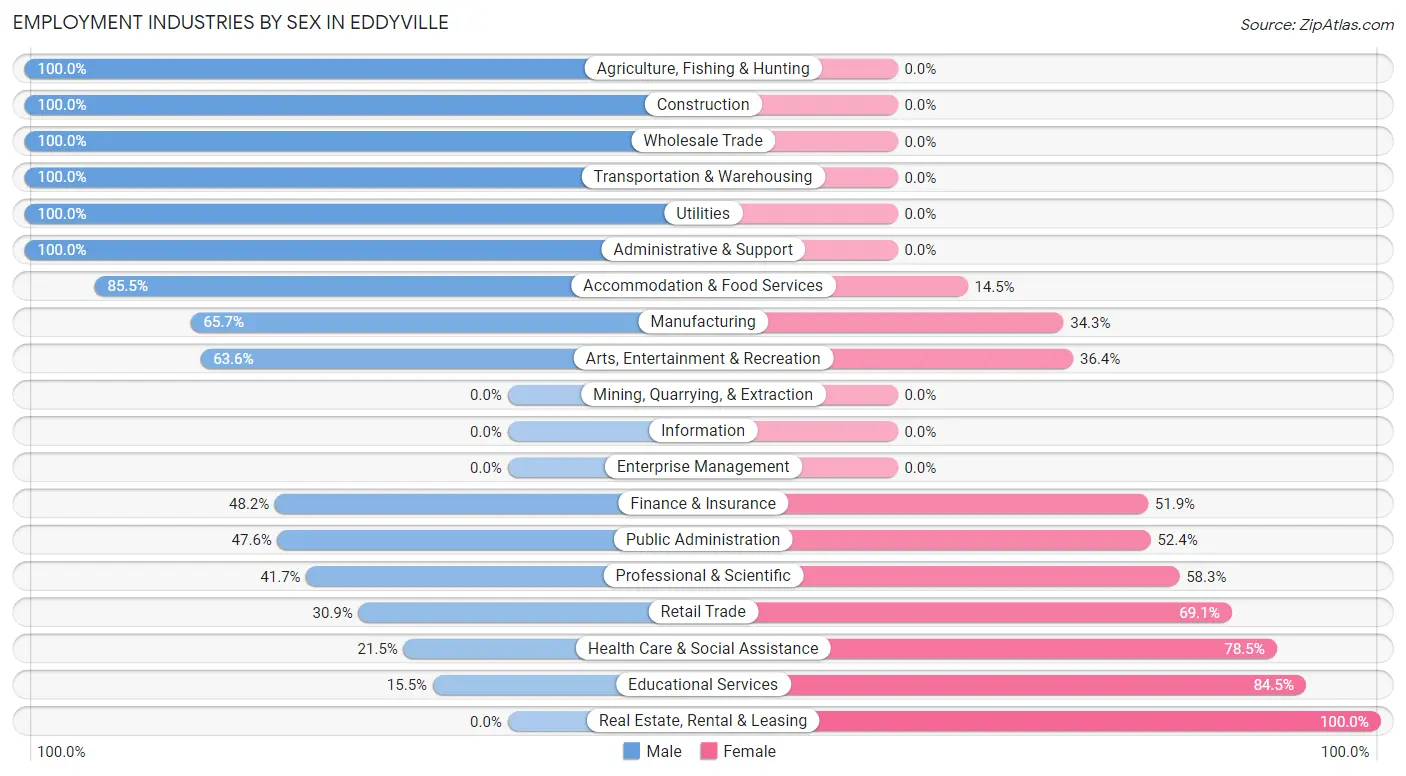
Employment Industries by Sex in Eddyville
The Eddyville industries that see more men than women are Agriculture, Fishing & Hunting (100.0%), Construction (100.0%), and Wholesale Trade (100.0%), whereas the industries that tend to have a higher number of women are Real Estate, Rental & Leasing (100.0%), Educational Services (84.5%), and Health Care & Social Assistance (78.5%).
| Industry | Male | Female |
| Agriculture, Fishing & Hunting | 7 (100.0%) | 0 (0.0%) |
| Mining, Quarrying, & Extraction | 0 (0.0%) | 0 (0.0%) |
| Construction | 37 (100.0%) | 0 (0.0%) |
| Manufacturing | 65 (65.7%) | 34 (34.3%) |
| Wholesale Trade | 7 (100.0%) | 0 (0.0%) |
| Retail Trade | 25 (30.9%) | 56 (69.1%) |
| Transportation & Warehousing | 31 (100.0%) | 0 (0.0%) |
| Utilities | 6 (100.0%) | 0 (0.0%) |
| Information | 0 (0.0%) | 0 (0.0%) |
| Finance & Insurance | 13 (48.1%) | 14 (51.8%) |
| Real Estate, Rental & Leasing | 0 (0.0%) | 1 (100.0%) |
| Professional & Scientific | 10 (41.7%) | 14 (58.3%) |
| Enterprise Management | 0 (0.0%) | 0 (0.0%) |
| Administrative & Support | 26 (100.0%) | 0 (0.0%) |
| Educational Services | 11 (15.5%) | 60 (84.5%) |
| Health Care & Social Assistance | 28 (21.5%) | 102 (78.5%) |
| Arts, Entertainment & Recreation | 7 (63.6%) | 4 (36.4%) |
| Accommodation & Food Services | 118 (85.5%) | 20 (14.5%) |
| Public Administration | 60 (47.6%) | 66 (52.4%) |
| Total | 454 (54.6%) | 377 (45.4%) |
Education in Eddyville
School Enrollment in Eddyville
The most common levels of schooling among the 303 students in Eddyville are college / undergraduate (90 | 29.7%), elementary school (64 | 21.1%), and nursery / preschool (51 | 16.8%).
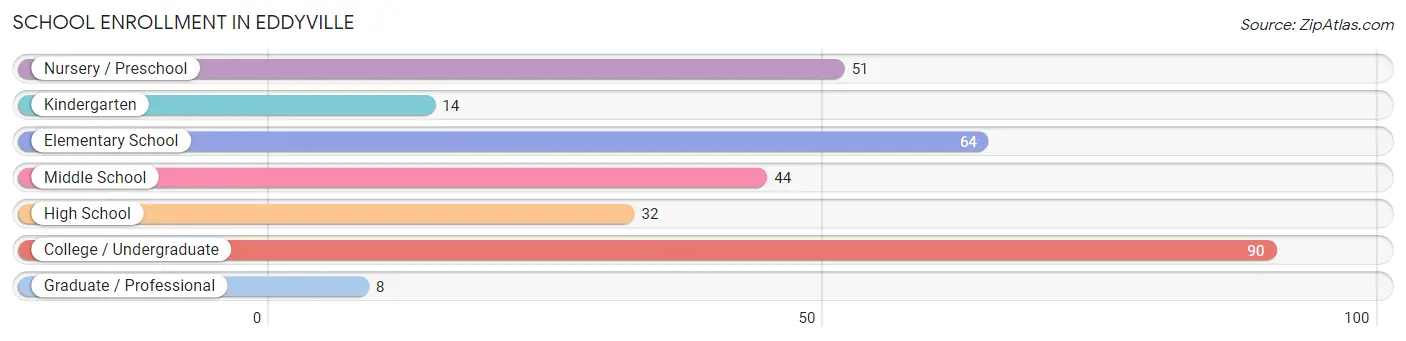
| School Level | # Students | % Students |
| Nursery / Preschool | 51 | 16.8% |
| Kindergarten | 14 | 4.6% |
| Elementary School | 64 | 21.1% |
| Middle School | 44 | 14.5% |
| High School | 32 | 10.6% |
| College / Undergraduate | 90 | 29.7% |
| Graduate / Professional | 8 | 2.6% |
| Total | 303 | 100.0% |
School Enrollment by Age by Funding Source in Eddyville
Out of a total of 303 students who are enrolled in schools in Eddyville, 20 (6.6%) attend a private institution, while the remaining 283 (93.4%) are enrolled in public schools. The age group of 18 to 19 year olds has the highest likelihood of being enrolled in private schools, with 6 (100.0% in the age bracket) enrolled. Conversely, the age group of 3 to 4 year olds has the lowest likelihood of being enrolled in a private school, with 20 (100.0% in the age bracket) attending a public institution.
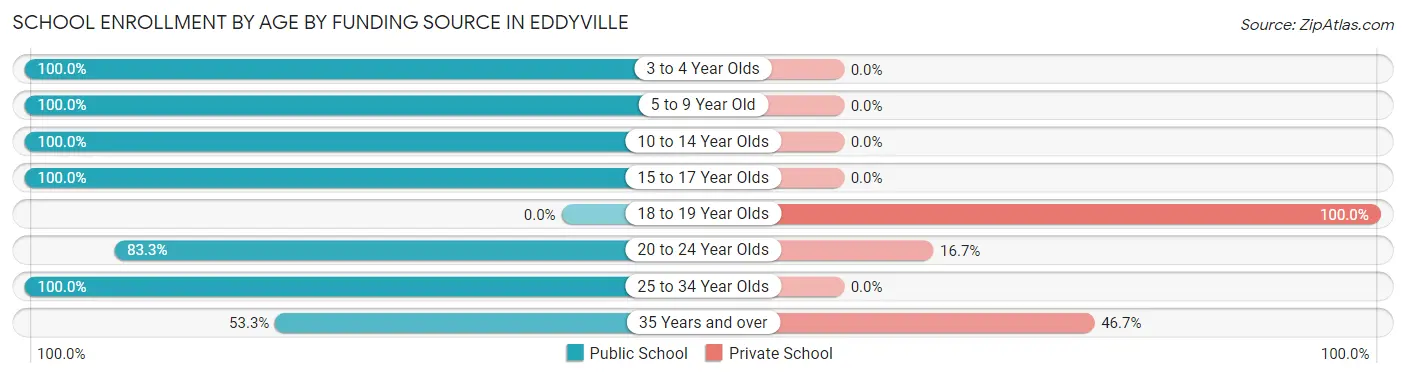
| Age Bracket | Public School | Private School |
| 3 to 4 Year Olds | 20 (100.0%) | 0 (0.0%) |
| 5 to 9 Year Old | 96 (100.0%) | 0 (0.0%) |
| 10 to 14 Year Olds | 53 (100.0%) | 0 (0.0%) |
| 15 to 17 Year Olds | 32 (100.0%) | 0 (0.0%) |
| 18 to 19 Year Olds | 0 (0.0%) | 6 (100.0%) |
| 20 to 24 Year Olds | 35 (83.3%) | 7 (16.7%) |
| 25 to 34 Year Olds | 39 (100.0%) | 0 (0.0%) |
| 35 Years and over | 8 (53.3%) | 7 (46.7%) |
| Total | 283 (93.4%) | 20 (6.6%) |
Educational Attainment by Field of Study in Eddyville
Science & technology (50 | 18.2%), education (48 | 17.5%), arts & humanities (39 | 14.2%), business (34 | 12.4%), and communications (22 | 8.0%) are the most common fields of study among 274 individuals in Eddyville who have obtained a bachelor's degree or higher.
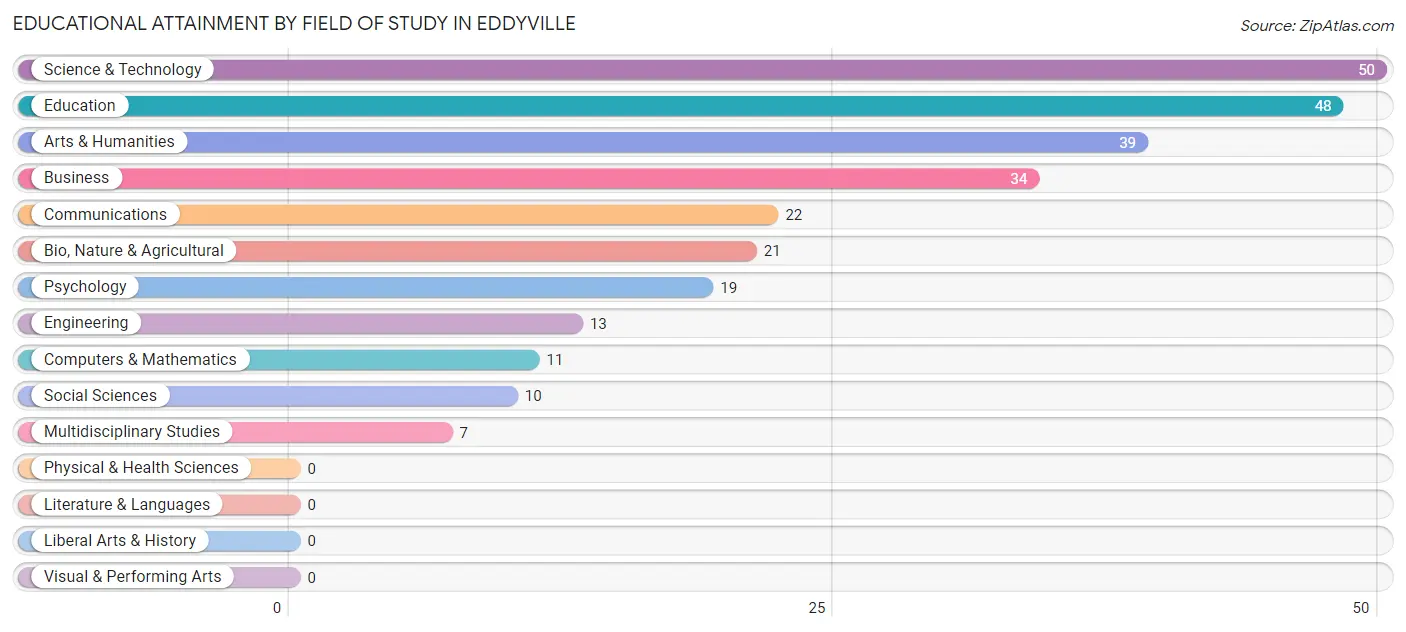
| Field of Study | # Graduates | % Graduates |
| Computers & Mathematics | 11 | 4.0% |
| Bio, Nature & Agricultural | 21 | 7.7% |
| Physical & Health Sciences | 0 | 0.0% |
| Psychology | 19 | 6.9% |
| Social Sciences | 10 | 3.6% |
| Engineering | 13 | 4.7% |
| Multidisciplinary Studies | 7 | 2.5% |
| Science & Technology | 50 | 18.2% |
| Business | 34 | 12.4% |
| Education | 48 | 17.5% |
| Literature & Languages | 0 | 0.0% |
| Liberal Arts & History | 0 | 0.0% |
| Visual & Performing Arts | 0 | 0.0% |
| Communications | 22 | 8.0% |
| Arts & Humanities | 39 | 14.2% |
| Total | 274 | 100.0% |
Transportation & Commute in Eddyville
Vehicle Availability by Sex in Eddyville
The most prevalent vehicle ownership categories in Eddyville are males with 2 vehicles (175, accounting for 40.1%) and females with 2 vehicles (159, making up 48.1%).
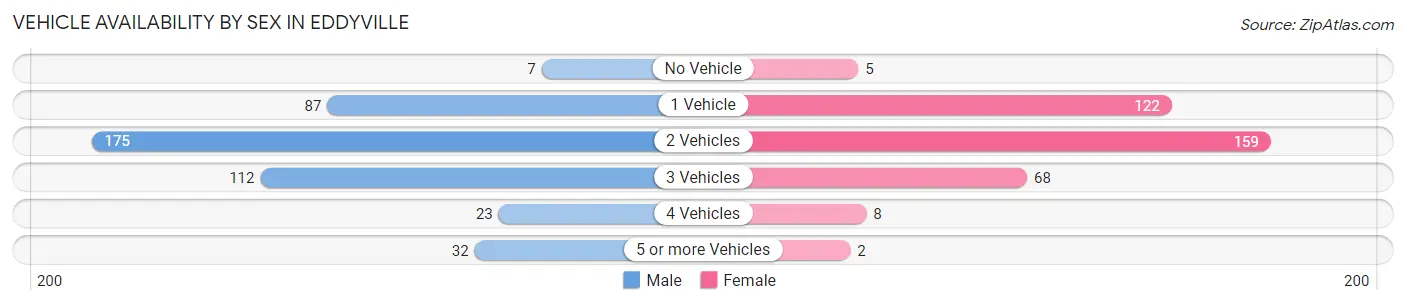
| Vehicles Available | Male | Female |
| No Vehicle | 7 (1.6%) | 5 (1.4%) |
| 1 Vehicle | 87 (20.0%) | 122 (33.5%) |
| 2 Vehicles | 175 (40.1%) | 159 (43.7%) |
| 3 Vehicles | 112 (25.7%) | 68 (18.7%) |
| 4 Vehicles | 23 (5.3%) | 8 (2.2%) |
| 5 or more Vehicles | 32 (7.3%) | 2 (0.5%) |
| Total | 436 (100.0%) | 364 (100.0%) |
Commute Time in Eddyville
The most frequently occuring commute durations in Eddyville are 5 to 9 minutes (230 commuters, 31.5%), 10 to 14 minutes (128 commuters, 17.5%), and 15 to 19 minutes (89 commuters, 12.2%).
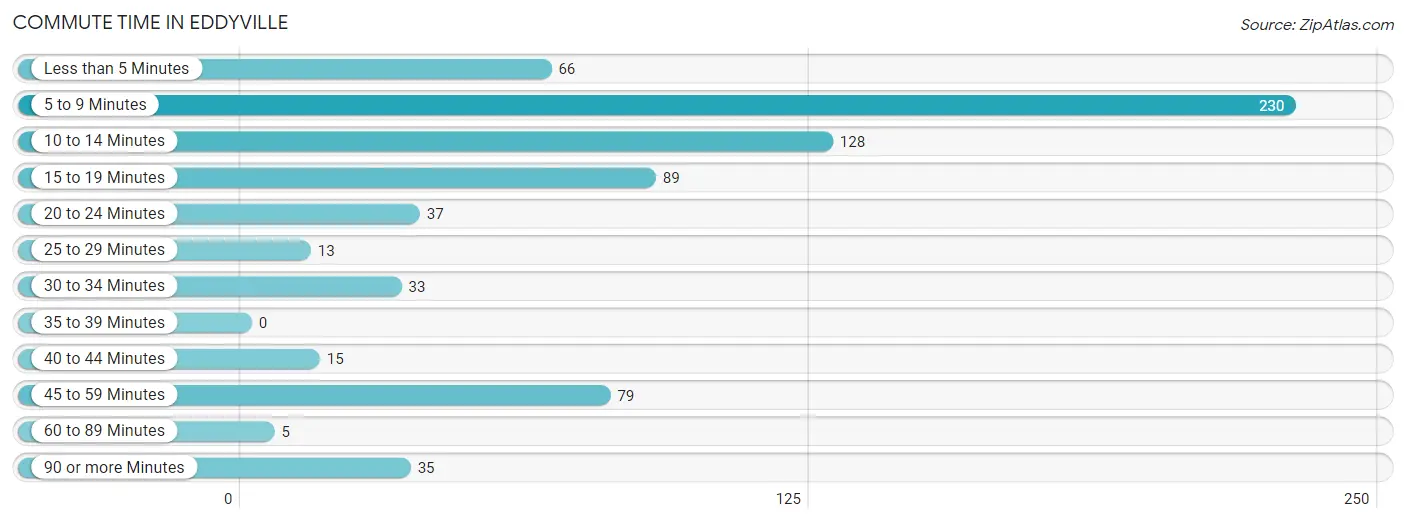
| Commute Time | # Commuters | % Commuters |
| Less than 5 Minutes | 66 | 9.0% |
| 5 to 9 Minutes | 230 | 31.5% |
| 10 to 14 Minutes | 128 | 17.5% |
| 15 to 19 Minutes | 89 | 12.2% |
| 20 to 24 Minutes | 37 | 5.1% |
| 25 to 29 Minutes | 13 | 1.8% |
| 30 to 34 Minutes | 33 | 4.5% |
| 35 to 39 Minutes | 0 | 0.0% |
| 40 to 44 Minutes | 15 | 2.1% |
| 45 to 59 Minutes | 79 | 10.8% |
| 60 to 89 Minutes | 5 | 0.7% |
| 90 or more Minutes | 35 | 4.8% |
Commute Time by Sex in Eddyville
The most common commute times in Eddyville are 5 to 9 minutes (125 commuters, 31.6%) for males and 5 to 9 minutes (105 commuters, 31.4%) for females.
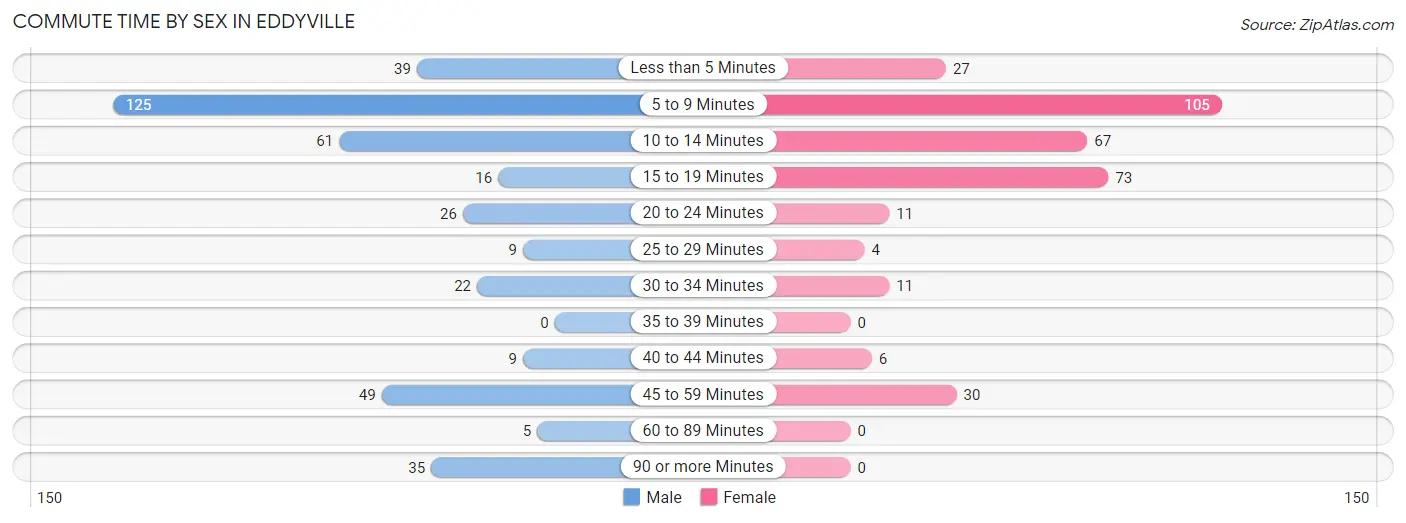
| Commute Time | Male | Female |
| Less than 5 Minutes | 39 (9.9%) | 27 (8.1%) |
| 5 to 9 Minutes | 125 (31.6%) | 105 (31.4%) |
| 10 to 14 Minutes | 61 (15.4%) | 67 (20.1%) |
| 15 to 19 Minutes | 16 (4.0%) | 73 (21.9%) |
| 20 to 24 Minutes | 26 (6.6%) | 11 (3.3%) |
| 25 to 29 Minutes | 9 (2.3%) | 4 (1.2%) |
| 30 to 34 Minutes | 22 (5.6%) | 11 (3.3%) |
| 35 to 39 Minutes | 0 (0.0%) | 0 (0.0%) |
| 40 to 44 Minutes | 9 (2.3%) | 6 (1.8%) |
| 45 to 59 Minutes | 49 (12.4%) | 30 (9.0%) |
| 60 to 89 Minutes | 5 (1.3%) | 0 (0.0%) |
| 90 or more Minutes | 35 (8.8%) | 0 (0.0%) |
Time of Departure to Work by Sex in Eddyville
The most frequent times of departure to work in Eddyville are 12:00 PM to 3:59 PM (51, 12.9%) for males and 7:00 AM to 7:29 AM (73, 21.9%) for females.
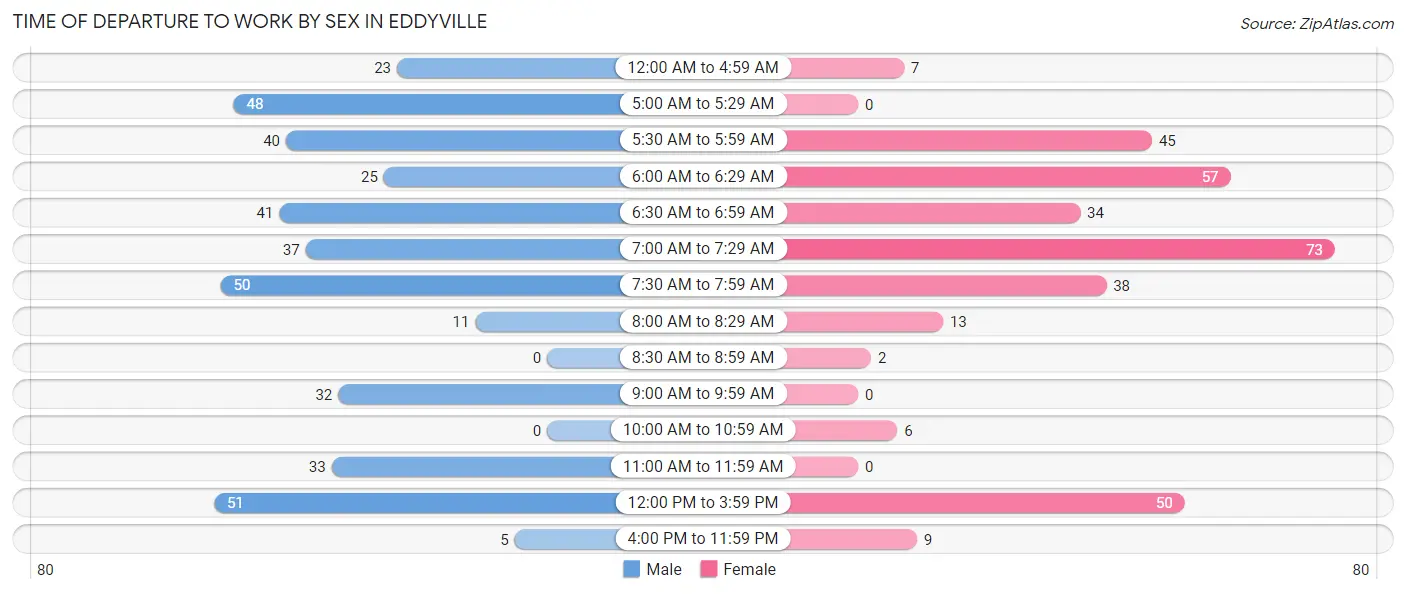
| Time of Departure | Male | Female |
| 12:00 AM to 4:59 AM | 23 (5.8%) | 7 (2.1%) |
| 5:00 AM to 5:29 AM | 48 (12.1%) | 0 (0.0%) |
| 5:30 AM to 5:59 AM | 40 (10.1%) | 45 (13.5%) |
| 6:00 AM to 6:29 AM | 25 (6.3%) | 57 (17.1%) |
| 6:30 AM to 6:59 AM | 41 (10.3%) | 34 (10.2%) |
| 7:00 AM to 7:29 AM | 37 (9.3%) | 73 (21.9%) |
| 7:30 AM to 7:59 AM | 50 (12.6%) | 38 (11.4%) |
| 8:00 AM to 8:29 AM | 11 (2.8%) | 13 (3.9%) |
| 8:30 AM to 8:59 AM | 0 (0.0%) | 2 (0.6%) |
| 9:00 AM to 9:59 AM | 32 (8.1%) | 0 (0.0%) |
| 10:00 AM to 10:59 AM | 0 (0.0%) | 6 (1.8%) |
| 11:00 AM to 11:59 AM | 33 (8.3%) | 0 (0.0%) |
| 12:00 PM to 3:59 PM | 51 (12.9%) | 50 (15.0%) |
| 4:00 PM to 11:59 PM | 5 (1.3%) | 9 (2.7%) |
| Total | 396 (100.0%) | 334 (100.0%) |
Housing Occupancy in Eddyville
Occupancy by Ownership in Eddyville
Of the total 795 dwellings in Eddyville, owner-occupied units account for 397 (49.9%), while renter-occupied units make up 398 (50.1%).
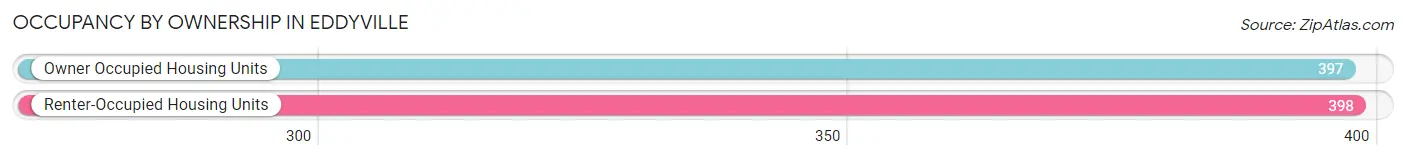
| Occupancy | # Housing Units | % Housing Units |
| Owner Occupied Housing Units | 397 | 49.9% |
| Renter-Occupied Housing Units | 398 | 50.1% |
| Total Occupied Housing Units | 795 | 100.0% |
Occupancy by Household Size in Eddyville
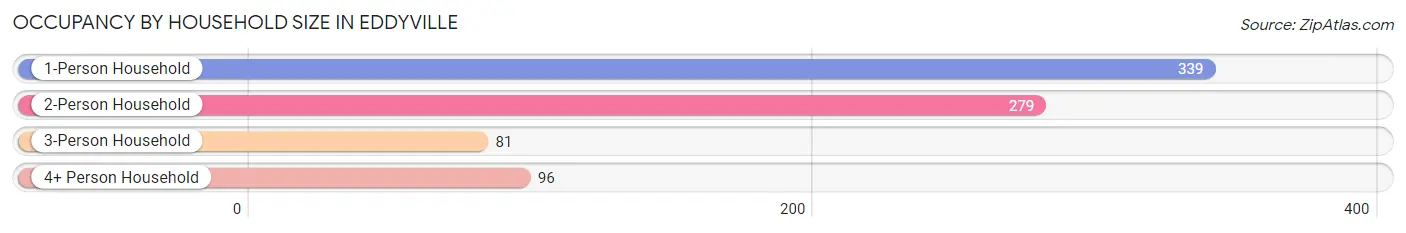
| Household Size | # Housing Units | % Housing Units |
| 1-Person Household | 339 | 42.6% |
| 2-Person Household | 279 | 35.1% |
| 3-Person Household | 81 | 10.2% |
| 4+ Person Household | 96 | 12.1% |
| Total Housing Units | 795 | 100.0% |
Occupancy by Ownership by Household Size in Eddyville
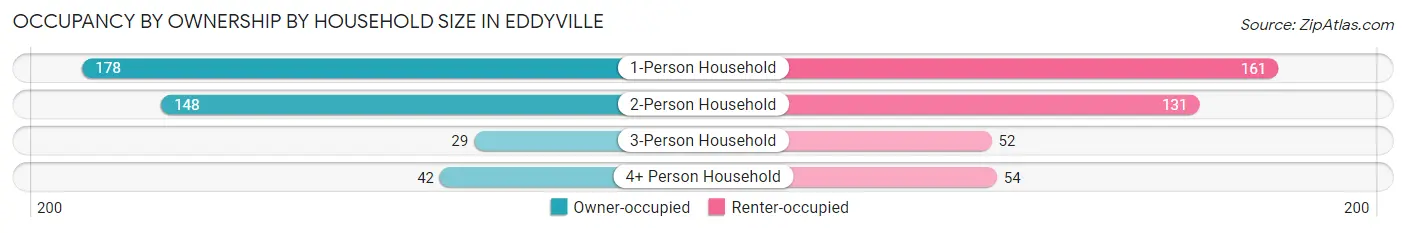
| Household Size | Owner-occupied | Renter-occupied |
| 1-Person Household | 178 (52.5%) | 161 (47.5%) |
| 2-Person Household | 148 (53.0%) | 131 (46.9%) |
| 3-Person Household | 29 (35.8%) | 52 (64.2%) |
| 4+ Person Household | 42 (43.8%) | 54 (56.2%) |
| Total Housing Units | 397 (49.9%) | 398 (50.1%) |
Occupancy by Educational Attainment in Eddyville
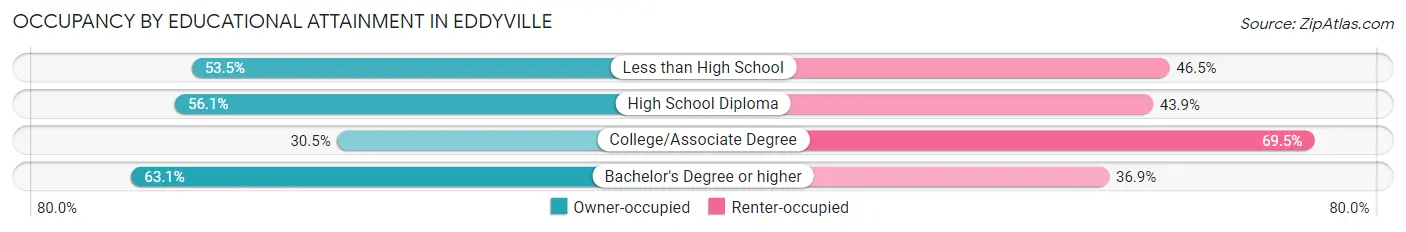
| Household Size | Owner-occupied | Renter-occupied |
| Less than High School | 46 (53.5%) | 40 (46.5%) |
| High School Diploma | 183 (56.1%) | 143 (43.9%) |
| College/Associate Degree | 69 (30.5%) | 157 (69.5%) |
| Bachelor's Degree or higher | 99 (63.1%) | 58 (36.9%) |
Occupancy by Age of Householder in Eddyville
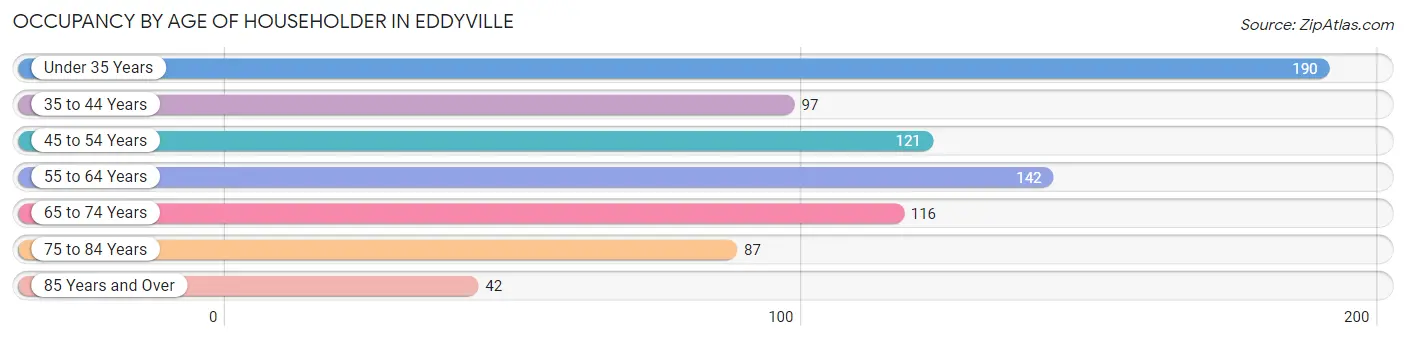
| Age Bracket | # Households | % Households |
| Under 35 Years | 190 | 23.9% |
| 35 to 44 Years | 97 | 12.2% |
| 45 to 54 Years | 121 | 15.2% |
| 55 to 64 Years | 142 | 17.9% |
| 65 to 74 Years | 116 | 14.6% |
| 75 to 84 Years | 87 | 10.9% |
| 85 Years and Over | 42 | 5.3% |
| Total | 795 | 100.0% |
Housing Finances in Eddyville
Median Income by Occupancy in Eddyville
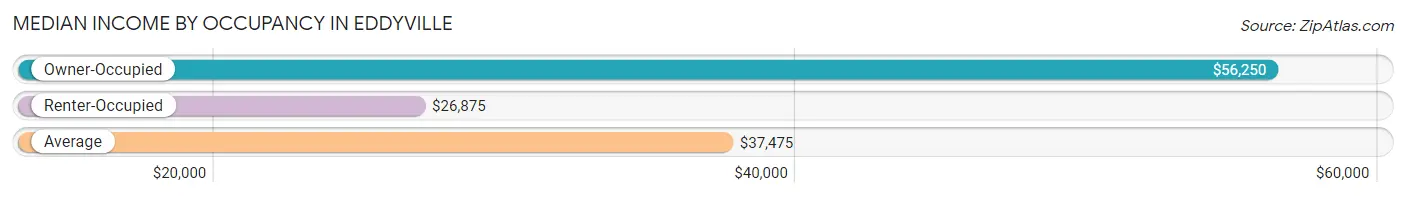
| Occupancy Type | # Households | Median Income |
| Owner-Occupied | 397 (49.9%) | $56,250 |
| Renter-Occupied | 398 (50.1%) | $26,875 |
| Average | 795 (100.0%) | $37,475 |
Occupancy by Householder Income Bracket in Eddyville
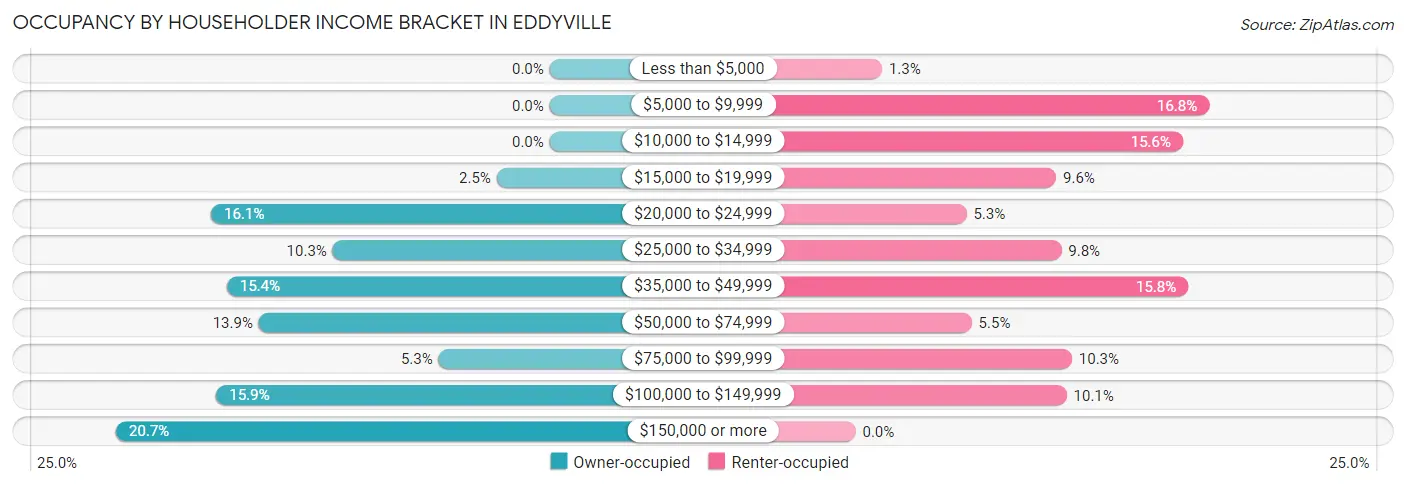
| Income Bracket | Owner-occupied | Renter-occupied |
| Less than $5,000 | 0 (0.0%) | 5 (1.3%) |
| $5,000 to $9,999 | 0 (0.0%) | 67 (16.8%) |
| $10,000 to $14,999 | 0 (0.0%) | 62 (15.6%) |
| $15,000 to $19,999 | 10 (2.5%) | 38 (9.6%) |
| $20,000 to $24,999 | 64 (16.1%) | 21 (5.3%) |
| $25,000 to $34,999 | 41 (10.3%) | 39 (9.8%) |
| $35,000 to $49,999 | 61 (15.4%) | 63 (15.8%) |
| $50,000 to $74,999 | 55 (13.9%) | 22 (5.5%) |
| $75,000 to $99,999 | 21 (5.3%) | 41 (10.3%) |
| $100,000 to $149,999 | 63 (15.9%) | 40 (10.1%) |
| $150,000 or more | 82 (20.6%) | 0 (0.0%) |
| Total | 397 (100.0%) | 398 (100.0%) |
Monthly Housing Cost Tiers in Eddyville
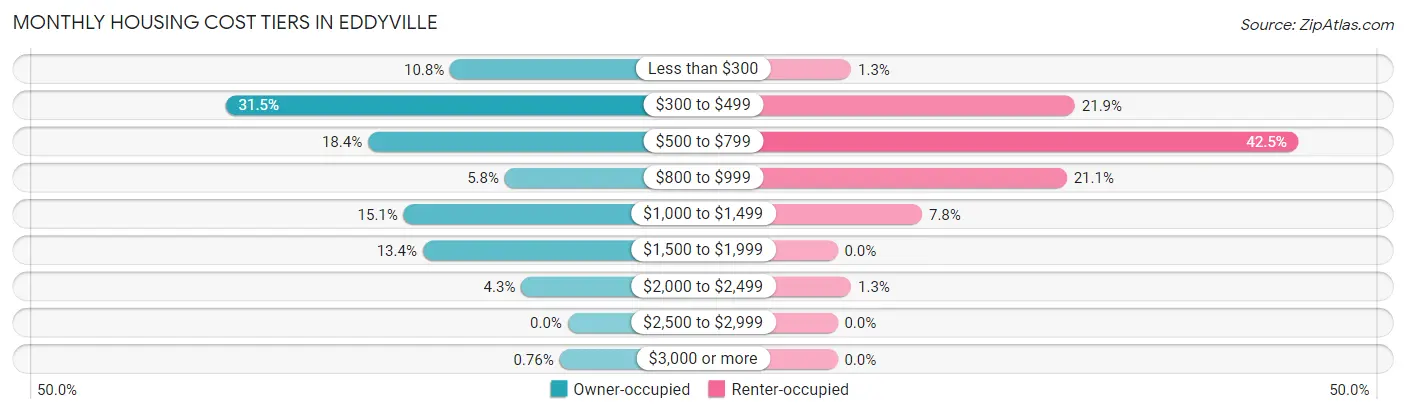
| Monthly Cost | Owner-occupied | Renter-occupied |
| Less than $300 | 43 (10.8%) | 5 (1.3%) |
| $300 to $499 | 125 (31.5%) | 87 (21.9%) |
| $500 to $799 | 73 (18.4%) | 169 (42.5%) |
| $800 to $999 | 23 (5.8%) | 84 (21.1%) |
| $1,000 to $1,499 | 60 (15.1%) | 31 (7.8%) |
| $1,500 to $1,999 | 53 (13.4%) | 0 (0.0%) |
| $2,000 to $2,499 | 17 (4.3%) | 5 (1.3%) |
| $2,500 to $2,999 | 0 (0.0%) | 0 (0.0%) |
| $3,000 or more | 3 (0.8%) | 0 (0.0%) |
| Total | 397 (100.0%) | 398 (100.0%) |
Physical Housing Characteristics in Eddyville
Housing Structures in Eddyville
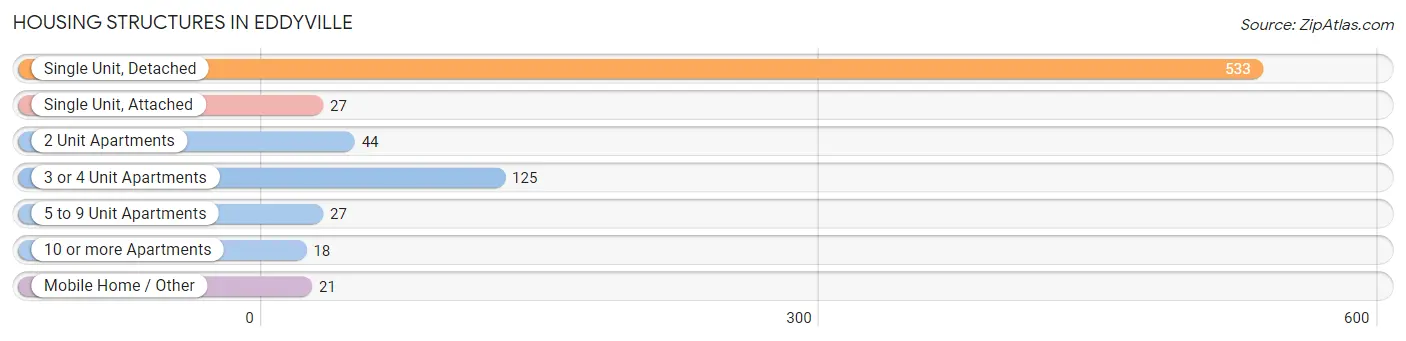
| Structure Type | # Housing Units | % Housing Units |
| Single Unit, Detached | 533 | 67.0% |
| Single Unit, Attached | 27 | 3.4% |
| 2 Unit Apartments | 44 | 5.5% |
| 3 or 4 Unit Apartments | 125 | 15.7% |
| 5 to 9 Unit Apartments | 27 | 3.4% |
| 10 or more Apartments | 18 | 2.3% |
| Mobile Home / Other | 21 | 2.6% |
| Total | 795 | 100.0% |
Housing Structures by Occupancy in Eddyville
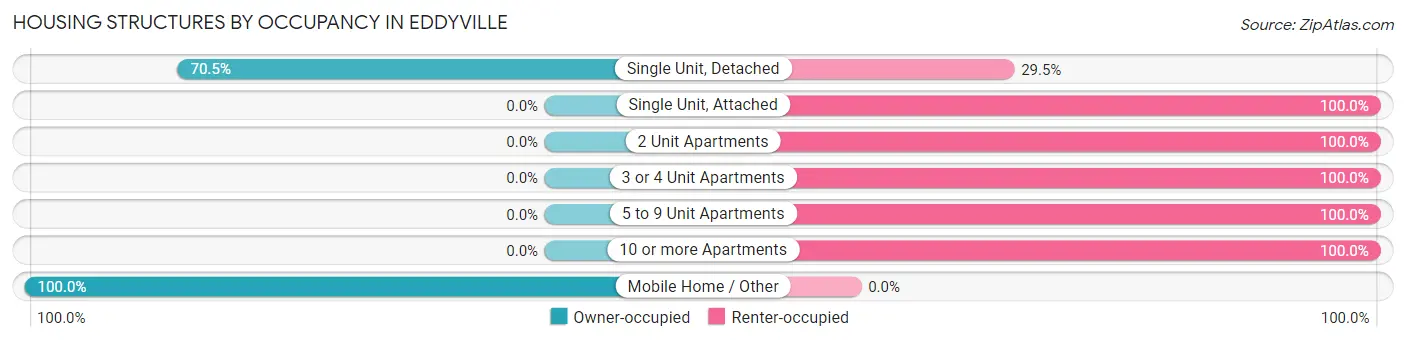
| Structure Type | Owner-occupied | Renter-occupied |
| Single Unit, Detached | 376 (70.5%) | 157 (29.5%) |
| Single Unit, Attached | 0 (0.0%) | 27 (100.0%) |
| 2 Unit Apartments | 0 (0.0%) | 44 (100.0%) |
| 3 or 4 Unit Apartments | 0 (0.0%) | 125 (100.0%) |
| 5 to 9 Unit Apartments | 0 (0.0%) | 27 (100.0%) |
| 10 or more Apartments | 0 (0.0%) | 18 (100.0%) |
| Mobile Home / Other | 21 (100.0%) | 0 (0.0%) |
| Total | 397 (49.9%) | 398 (50.1%) |
Housing Structures by Number of Rooms in Eddyville
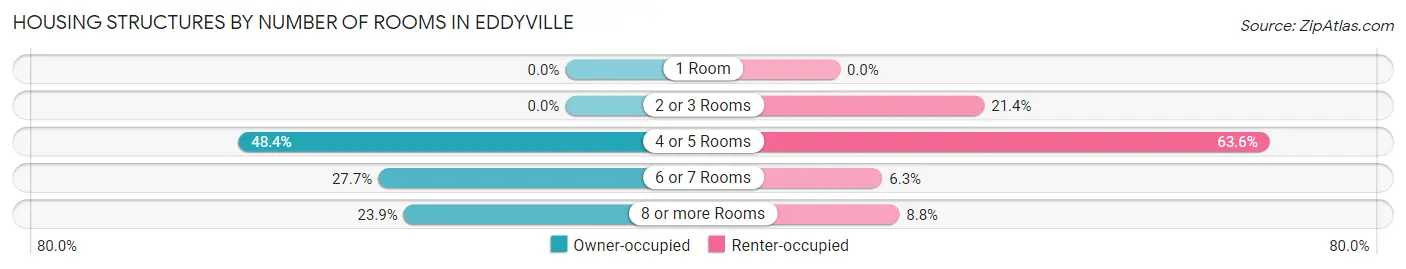
| Number of Rooms | Owner-occupied | Renter-occupied |
| 1 Room | 0 (0.0%) | 0 (0.0%) |
| 2 or 3 Rooms | 0 (0.0%) | 85 (21.4%) |
| 4 or 5 Rooms | 192 (48.4%) | 253 (63.6%) |
| 6 or 7 Rooms | 110 (27.7%) | 25 (6.3%) |
| 8 or more Rooms | 95 (23.9%) | 35 (8.8%) |
| Total | 397 (100.0%) | 398 (100.0%) |
Housing Structure by Heating Type in Eddyville
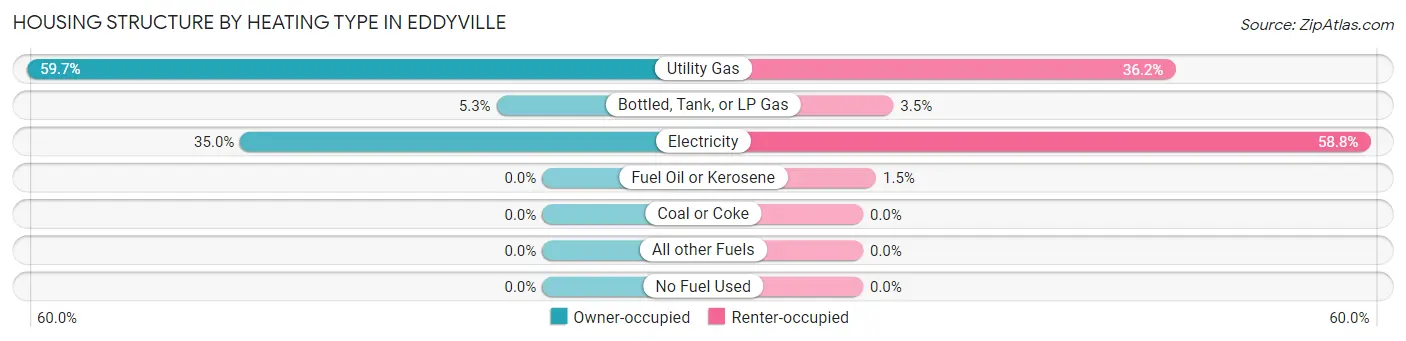
| Heating Type | Owner-occupied | Renter-occupied |
| Utility Gas | 237 (59.7%) | 144 (36.2%) |
| Bottled, Tank, or LP Gas | 21 (5.3%) | 14 (3.5%) |
| Electricity | 139 (35.0%) | 234 (58.8%) |
| Fuel Oil or Kerosene | 0 (0.0%) | 6 (1.5%) |
| Coal or Coke | 0 (0.0%) | 0 (0.0%) |
| All other Fuels | 0 (0.0%) | 0 (0.0%) |
| No Fuel Used | 0 (0.0%) | 0 (0.0%) |
| Total | 397 (100.0%) | 398 (100.0%) |
Household Vehicle Usage in Eddyville
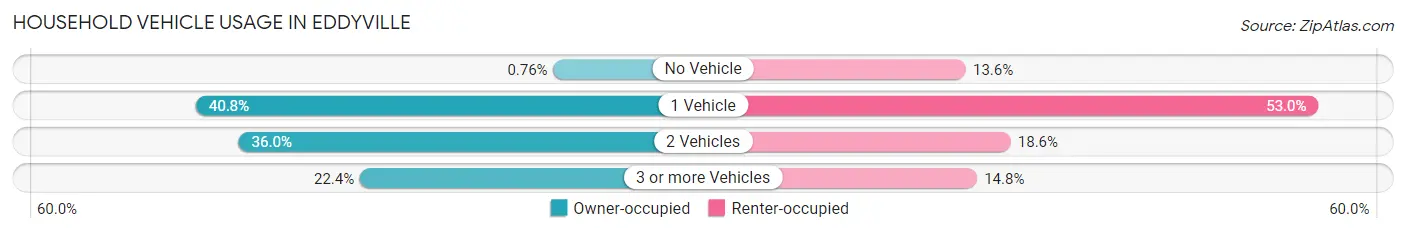
| Vehicles per Household | Owner-occupied | Renter-occupied |
| No Vehicle | 3 (0.8%) | 54 (13.6%) |
| 1 Vehicle | 162 (40.8%) | 211 (53.0%) |
| 2 Vehicles | 143 (36.0%) | 74 (18.6%) |
| 3 or more Vehicles | 89 (22.4%) | 59 (14.8%) |
| Total | 397 (100.0%) | 398 (100.0%) |
Real Estate & Mortgages in Eddyville
Real Estate and Mortgage Overview in Eddyville
| Characteristic | Without Mortgage | With Mortgage |
| Housing Units | 203 | 194 |
| Median Property Value | $158,700 | $174,000 |
| Median Household Income | $36,217 | $59 |
| Monthly Housing Costs | $404 | $3 |
| Real Estate Taxes | $1,189 | $0 |
Property Value by Mortgage Status in Eddyville
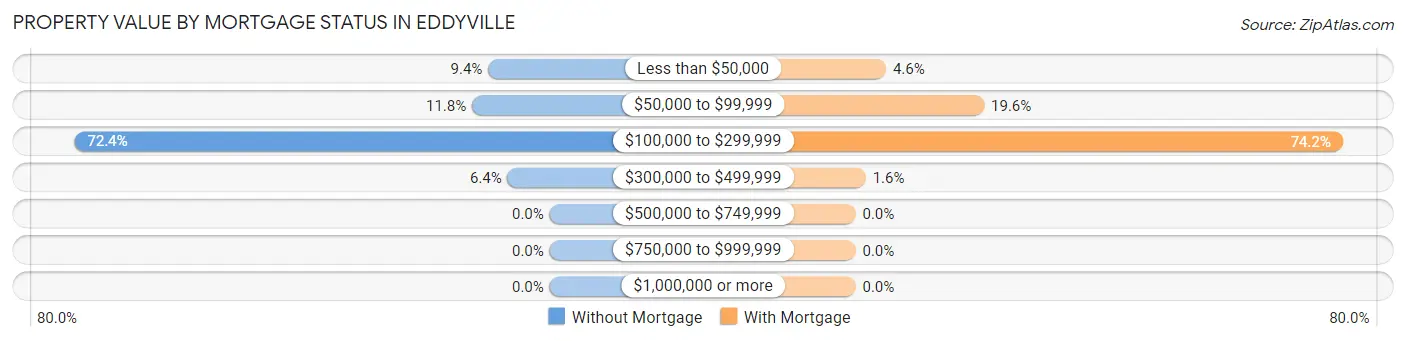
| Property Value | Without Mortgage | With Mortgage |
| Less than $50,000 | 19 (9.4%) | 9 (4.6%) |
| $50,000 to $99,999 | 24 (11.8%) | 38 (19.6%) |
| $100,000 to $299,999 | 147 (72.4%) | 144 (74.2%) |
| $300,000 to $499,999 | 13 (6.4%) | 3 (1.5%) |
| $500,000 to $749,999 | 0 (0.0%) | 0 (0.0%) |
| $750,000 to $999,999 | 0 (0.0%) | 0 (0.0%) |
| $1,000,000 or more | 0 (0.0%) | 0 (0.0%) |
| Total | 203 (100.0%) | 194 (100.0%) |
Household Income by Mortgage Status in Eddyville
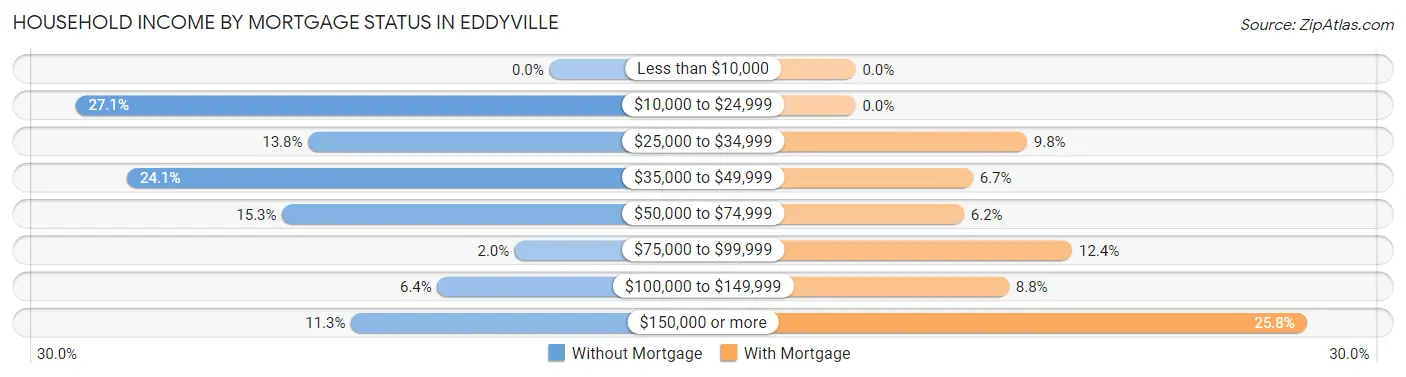
| Household Income | Without Mortgage | With Mortgage |
| Less than $10,000 | 0 (0.0%) | 0 (0.0%) |
| $10,000 to $24,999 | 55 (27.1%) | 0 (0.0%) |
| $25,000 to $34,999 | 28 (13.8%) | 19 (9.8%) |
| $35,000 to $49,999 | 49 (24.1%) | 13 (6.7%) |
| $50,000 to $74,999 | 31 (15.3%) | 12 (6.2%) |
| $75,000 to $99,999 | 4 (2.0%) | 24 (12.4%) |
| $100,000 to $149,999 | 13 (6.4%) | 17 (8.8%) |
| $150,000 or more | 23 (11.3%) | 50 (25.8%) |
| Total | 203 (100.0%) | 194 (100.0%) |
Property Value to Household Income Ratio in Eddyville
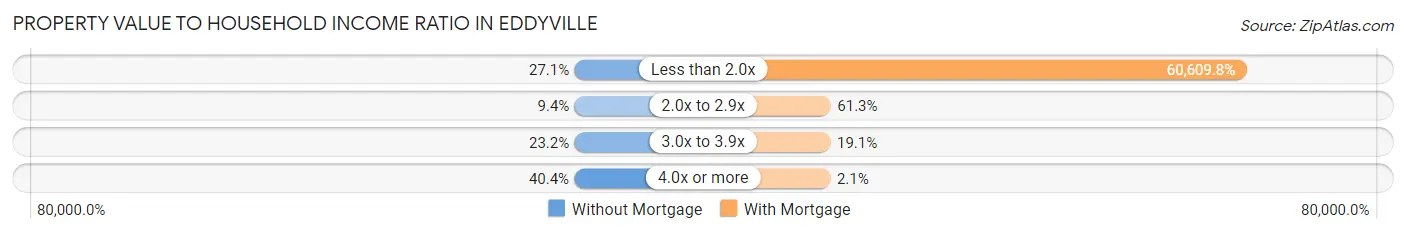
| Value-to-Income Ratio | Without Mortgage | With Mortgage |
| Less than 2.0x | 55 (27.1%) | 117,583 (60,609.8%) |
| 2.0x to 2.9x | 19 (9.4%) | 119 (61.3%) |
| 3.0x to 3.9x | 47 (23.2%) | 37 (19.1%) |
| 4.0x or more | 82 (40.4%) | 4 (2.1%) |
| Total | 203 (100.0%) | 194 (100.0%) |
Real Estate Taxes by Mortgage Status in Eddyville
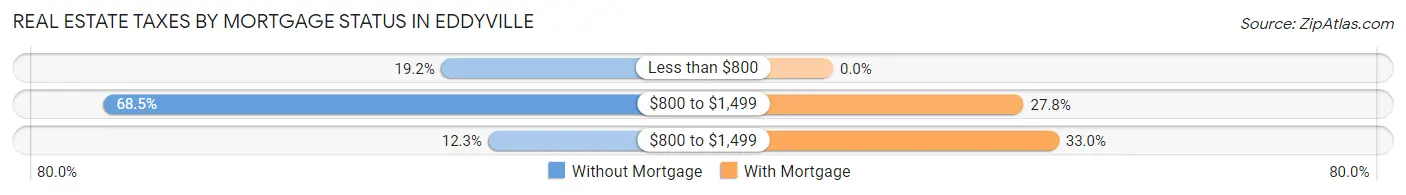
| Property Taxes | Without Mortgage | With Mortgage |
| Less than $800 | 39 (19.2%) | 0 (0.0%) |
| $800 to $1,499 | 139 (68.5%) | 54 (27.8%) |
| $800 to $1,499 | 25 (12.3%) | 64 (33.0%) |
| Total | 203 (100.0%) | 194 (100.0%) |
Health & Disability in Eddyville
Health Insurance Coverage by Age in Eddyville
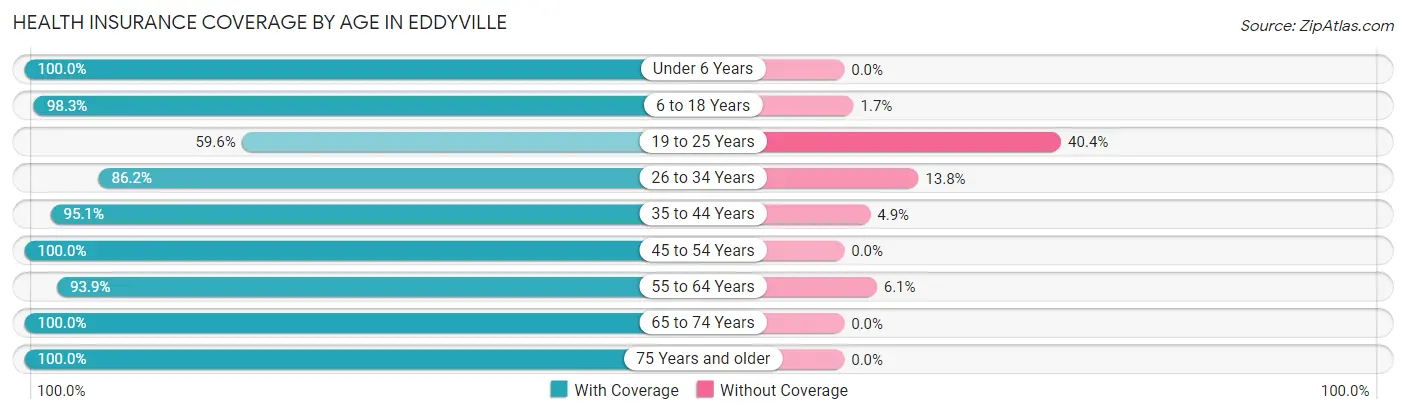
| Age Bracket | With Coverage | Without Coverage |
| Under 6 Years | 225 (100.0%) | 0 (0.0%) |
| 6 to 18 Years | 169 (98.3%) | 3 (1.7%) |
| 19 to 25 Years | 134 (59.6%) | 91 (40.4%) |
| 26 to 34 Years | 212 (86.2%) | 34 (13.8%) |
| 35 to 44 Years | 137 (95.1%) | 7 (4.9%) |
| 45 to 54 Years | 186 (100.0%) | 0 (0.0%) |
| 55 to 64 Years | 186 (93.9%) | 12 (6.1%) |
| 65 to 74 Years | 180 (100.0%) | 0 (0.0%) |
| 75 Years and older | 215 (100.0%) | 0 (0.0%) |
| Total | 1,644 (91.8%) | 147 (8.2%) |
Health Insurance Coverage by Citizenship Status in Eddyville
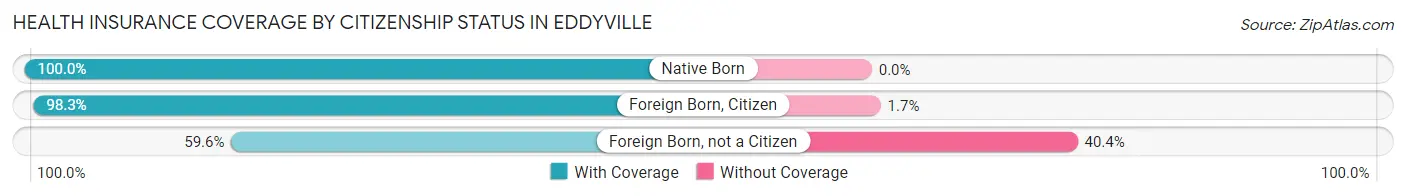
| Citizenship Status | With Coverage | Without Coverage |
| Native Born | 225 (100.0%) | 0 (0.0%) |
| Foreign Born, Citizen | 169 (98.3%) | 3 (1.7%) |
| Foreign Born, not a Citizen | 134 (59.6%) | 91 (40.4%) |
Health Insurance Coverage by Household Income in Eddyville
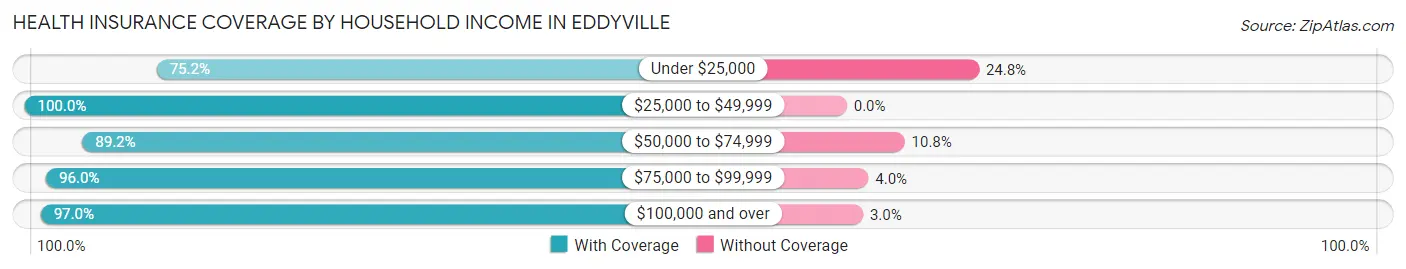
| Household Income | With Coverage | Without Coverage |
| Under $25,000 | 319 (75.2%) | 105 (24.8%) |
| $25,000 to $49,999 | 417 (100.0%) | 0 (0.0%) |
| $50,000 to $74,999 | 140 (89.2%) | 17 (10.8%) |
| $75,000 to $99,999 | 95 (96.0%) | 4 (4.0%) |
| $100,000 and over | 673 (97.0%) | 21 (3.0%) |
Public vs Private Health Insurance Coverage by Age in Eddyville
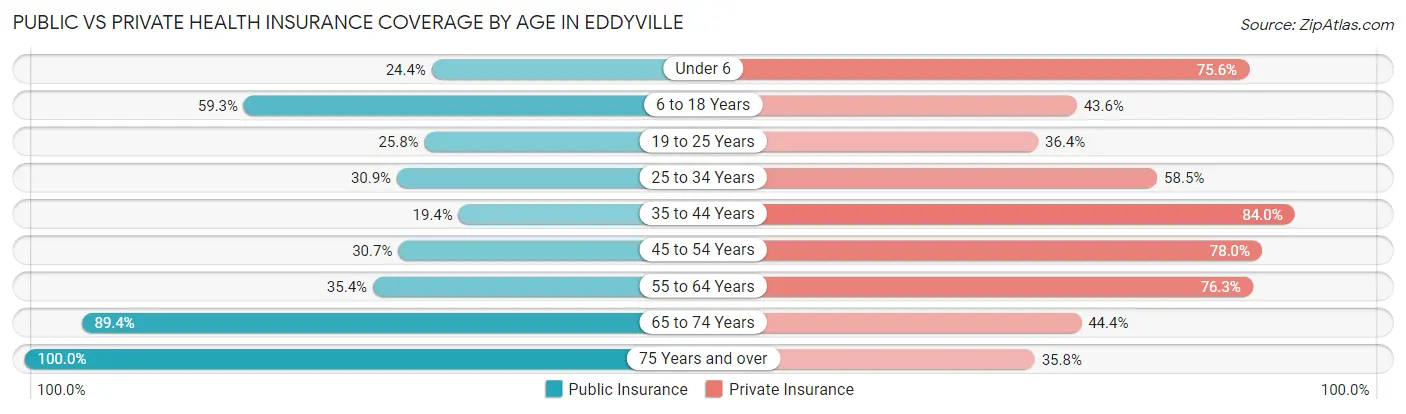
| Age Bracket | Public Insurance | Private Insurance |
| Under 6 | 55 (24.4%) | 170 (75.6%) |
| 6 to 18 Years | 102 (59.3%) | 75 (43.6%) |
| 19 to 25 Years | 58 (25.8%) | 82 (36.4%) |
| 25 to 34 Years | 76 (30.9%) | 144 (58.5%) |
| 35 to 44 Years | 28 (19.4%) | 121 (84.0%) |
| 45 to 54 Years | 57 (30.6%) | 145 (78.0%) |
| 55 to 64 Years | 70 (35.3%) | 151 (76.3%) |
| 65 to 74 Years | 161 (89.4%) | 80 (44.4%) |
| 75 Years and over | 215 (100.0%) | 77 (35.8%) |
| Total | 822 (45.9%) | 1,045 (58.4%) |
Disability Status by Sex by Age in Eddyville
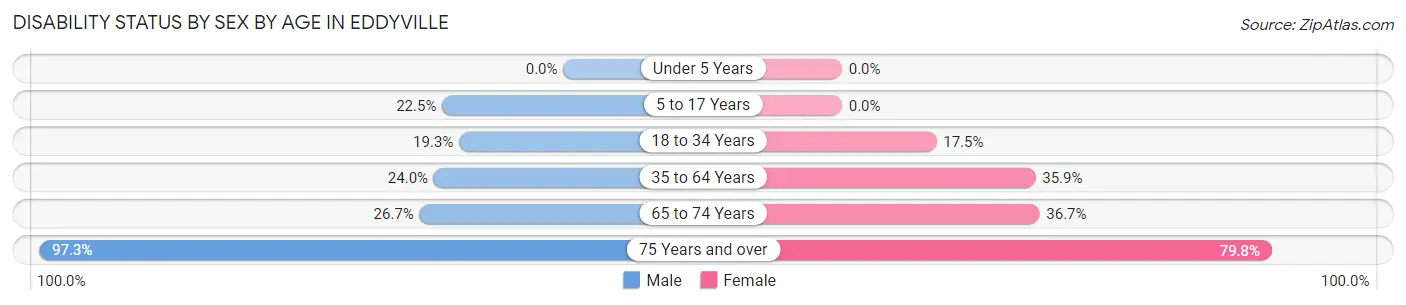
| Age Bracket | Male | Female |
| Under 5 Years | 0 (0.0%) | 0 (0.0%) |
| 5 to 17 Years | 29 (22.5%) | 0 (0.0%) |
| 18 to 34 Years | 47 (19.3%) | 40 (17.5%) |
| 35 to 64 Years | 68 (24.0%) | 88 (35.9%) |
| 65 to 74 Years | 16 (26.7%) | 44 (36.7%) |
| 75 Years and over | 108 (97.3%) | 83 (79.8%) |
Disability Class by Sex by Age in Eddyville
Disability Class: Hearing Difficulty
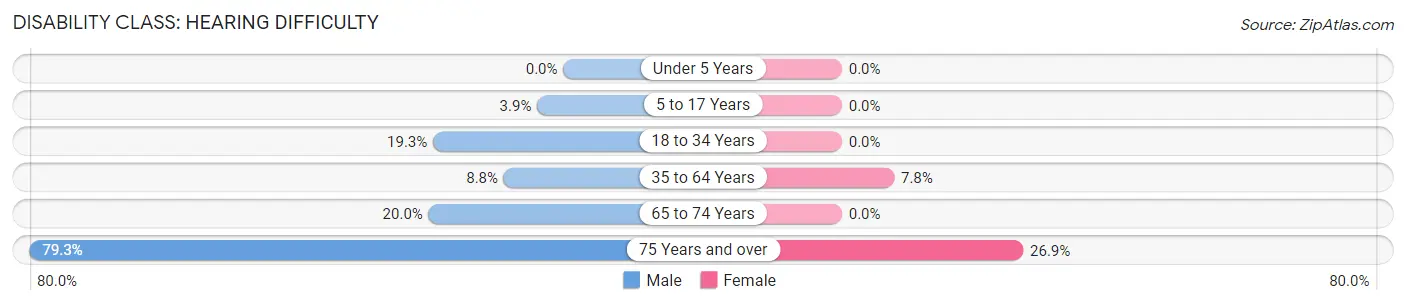
| Age Bracket | Male | Female |
| Under 5 Years | 0 (0.0%) | 0 (0.0%) |
| 5 to 17 Years | 5 (3.9%) | 0 (0.0%) |
| 18 to 34 Years | 47 (19.3%) | 0 (0.0%) |
| 35 to 64 Years | 25 (8.8%) | 19 (7.8%) |
| 65 to 74 Years | 12 (20.0%) | 0 (0.0%) |
| 75 Years and over | 88 (79.3%) | 28 (26.9%) |
Disability Class: Vision Difficulty
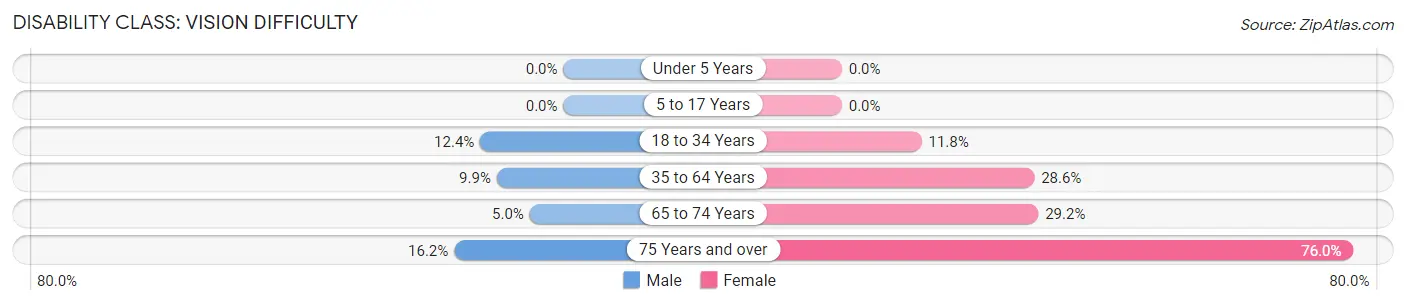
| Age Bracket | Male | Female |
| Under 5 Years | 0 (0.0%) | 0 (0.0%) |
| 5 to 17 Years | 0 (0.0%) | 0 (0.0%) |
| 18 to 34 Years | 30 (12.3%) | 27 (11.8%) |
| 35 to 64 Years | 28 (9.9%) | 70 (28.6%) |
| 65 to 74 Years | 3 (5.0%) | 35 (29.2%) |
| 75 Years and over | 18 (16.2%) | 79 (76.0%) |
Disability Class: Cognitive Difficulty
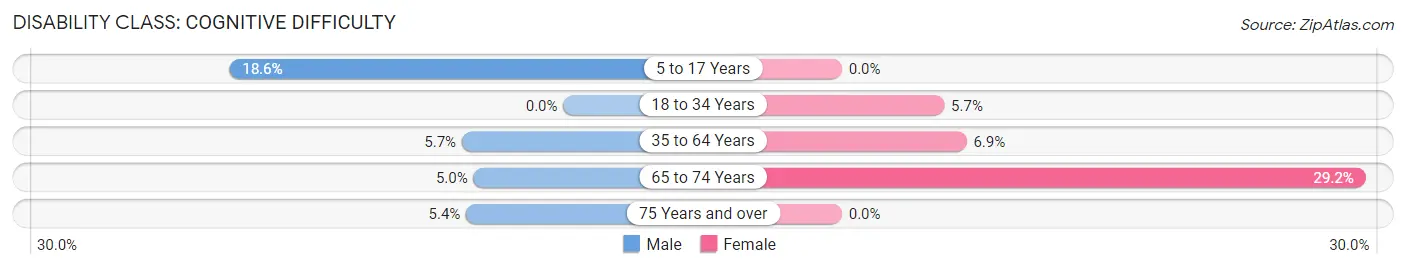
| Age Bracket | Male | Female |
| 5 to 17 Years | 24 (18.6%) | 0 (0.0%) |
| 18 to 34 Years | 0 (0.0%) | 13 (5.7%) |
| 35 to 64 Years | 16 (5.7%) | 17 (6.9%) |
| 65 to 74 Years | 3 (5.0%) | 35 (29.2%) |
| 75 Years and over | 6 (5.4%) | 0 (0.0%) |
Disability Class: Ambulatory Difficulty
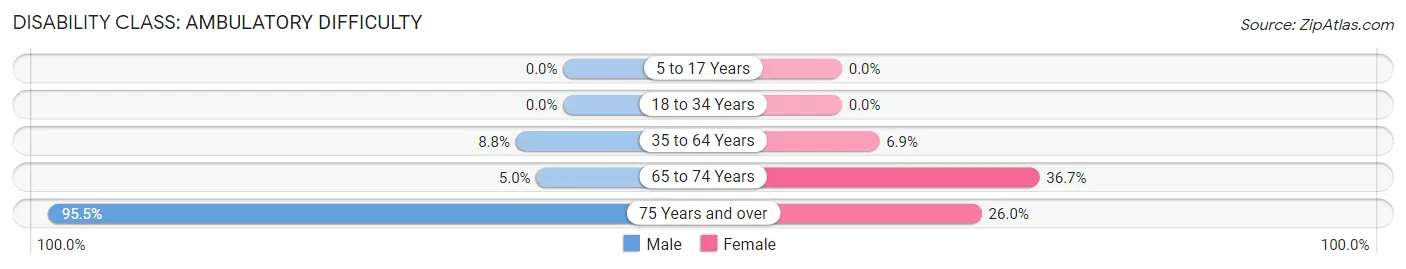
| Age Bracket | Male | Female |
| 5 to 17 Years | 0 (0.0%) | 0 (0.0%) |
| 18 to 34 Years | 0 (0.0%) | 0 (0.0%) |
| 35 to 64 Years | 25 (8.8%) | 17 (6.9%) |
| 65 to 74 Years | 3 (5.0%) | 44 (36.7%) |
| 75 Years and over | 106 (95.5%) | 27 (26.0%) |
Disability Class: Self-Care Difficulty
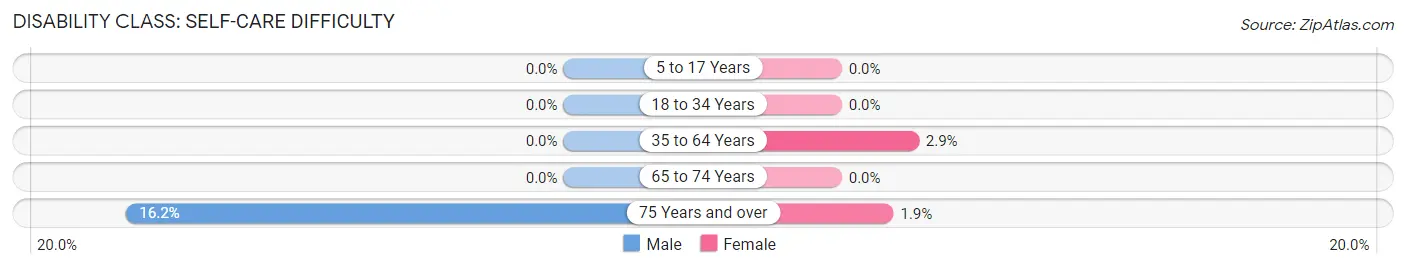
| Age Bracket | Male | Female |
| 5 to 17 Years | 0 (0.0%) | 0 (0.0%) |
| 18 to 34 Years | 0 (0.0%) | 0 (0.0%) |
| 35 to 64 Years | 0 (0.0%) | 7 (2.9%) |
| 65 to 74 Years | 0 (0.0%) | 0 (0.0%) |
| 75 Years and over | 18 (16.2%) | 2 (1.9%) |
Technology Access in Eddyville
Computing Device Access in Eddyville
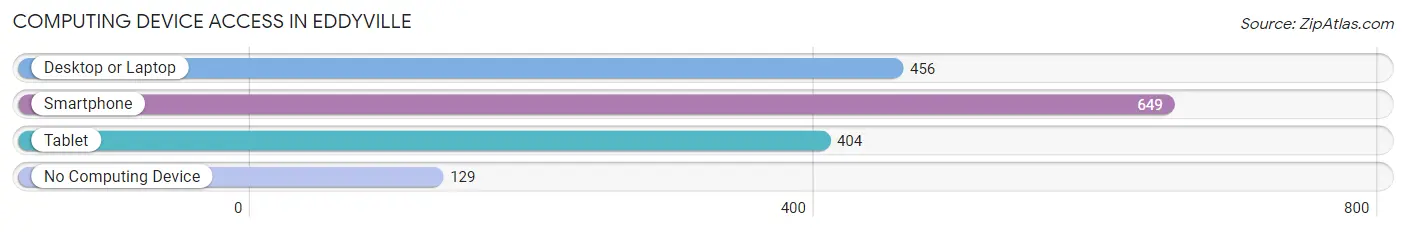
| Device Type | # Households | % Households |
| Desktop or Laptop | 456 | 57.4% |
| Smartphone | 649 | 81.6% |
| Tablet | 404 | 50.8% |
| No Computing Device | 129 | 16.2% |
| Total | 795 | 100.0% |
Internet Access in Eddyville
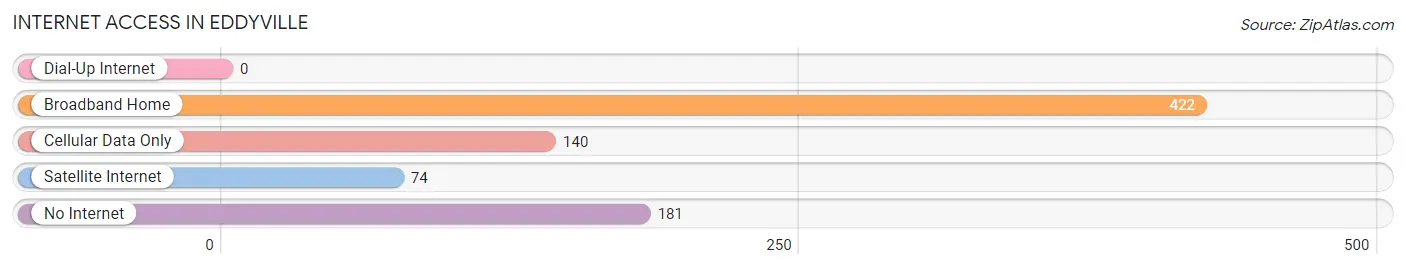
| Internet Type | # Households | % Households |
| Dial-Up Internet | 0 | 0.0% |
| Broadband Home | 422 | 53.1% |
| Cellular Data Only | 140 | 17.6% |
| Satellite Internet | 74 | 9.3% |
| No Internet | 181 | 22.8% |
| Total | 795 | 100.0% |
Eddyville Summary
Eddyville, Kentucky is a small town located in the western part of the state, in the Pennyrile region of Kentucky. It is situated on the banks of the Cumberland River, and is the county seat of Lyon County. The town was founded in 1820 and named after the Eddy family, who were early settlers in the area. The population of Eddyville was 2,093 at the 2010 census.
Geography
Eddyville is located at 37°3'25" North, 87°7'25" West (37.056944, -87.123611). It is situated on the banks of the Cumberland River, and is the county seat of Lyon County. The town is located in the Pennyrile region of Kentucky, and is part of the Western Coal Fields. The area is characterized by rolling hills and valleys, with the highest point in the county being the summit of Eddyville Hill at 845 feet above sea level.
The climate in Eddyville is humid subtropical, with hot, humid summers and mild winters. The average annual temperature is 61.3°F, with an average high of 79.2°F in July and an average low of 43.2°F in January. The average annual precipitation is 45.3 inches, with the wettest month being May, when an average of 5.3 inches of rain falls.
Economy
Eddyville’s economy is largely based on agriculture and manufacturing. The town is home to several large agricultural operations, including a large poultry farm and a large dairy farm. The town is also home to several manufacturing companies, including a furniture factory, a plastics factory, and a metal fabrication plant.
The town is also home to several retail stores, including a grocery store, a hardware store, and a variety of other shops. The town is also home to several restaurants, including a popular local diner.
Demographics
As of the 2010 census, the population of Eddyville was 2,093. The racial makeup of the town was 95.3% White, 1.2% African American, 0.4% Native American, 0.2% Asian, 0.1% Pacific Islander, 0.7% from other races, and 2.1% from two or more races. Hispanic or Latino of any race were 1.7% of the population.
The median income for a household in Eddyville was $30,938, and the median income for a family was $37,917. The per capita income for the town was $17,845. About 17.2% of families and 20.2% of the population were below the poverty line, including 28.3% of those under age 18 and 15.2% of those age 65 or over.
Education
Eddyville is served by the Lyon County School District, which operates four elementary schools, one middle school, and one high school. The town is also home to a branch of the Kentucky Community and Technical College System.
Conclusion
Eddyville, Kentucky is a small town located in the western part of the state, in the Pennyrile region of Kentucky. It is situated on the banks of the Cumberland River, and is the county seat of Lyon County. The town was founded in 1820 and named after the Eddy family, who were early settlers in the area. The population of Eddyville was 2,093 at the 2010 census. The town’s economy is largely based on agriculture and manufacturing, and the town is home to several retail stores and restaurants. The town is served by the Lyon County School District, and is home to a branch of the Kentucky Community and Technical College System.
Common Questions
What is Per Capita Income in Eddyville?
Per Capita income in Eddyville is $20,022.
What is the Median Family Income in Eddyville?
Median Family Income in Eddyville is $70,625.
What is the Median Household income in Eddyville?
Median Household Income in Eddyville is $37,475.
What is Income or Wage Gap in Eddyville?
Income or Wage Gap in Eddyville is 39.1%.
Women in Eddyville earn 60.9 cents for every dollar earned by a man.
What is Inequality or Gini Index in Eddyville?
Inequality or Gini Index in Eddyville is 0.50.
What is the Total Population of Eddyville?
Total Population of Eddyville is 2,783.
What is the Total Male Population of Eddyville?
Total Male Population of Eddyville is 1,962.
What is the Total Female Population of Eddyville?
Total Female Population of Eddyville is 821.
What is the Ratio of Males per 100 Females in Eddyville?
There are 238.98 Males per 100 Females in Eddyville.
What is the Ratio of Females per 100 Males in Eddyville?
There are 41.85 Females per 100 Males in Eddyville.
What is the Median Population Age in Eddyville?
Median Population Age in Eddyville is 35.7 Years.
What is the Average Family Size in Eddyville
Average Family Size in Eddyville is 3.2 People.
What is the Average Household Size in Eddyville
Average Household Size in Eddyville is 2.2 People.
How Large is the Labor Force in Eddyville?
There are 853 People in the Labor Forcein in Eddyville.
What is the Percentage of People in the Labor Force in Eddyville?
35.5% of People are in the Labor Force in Eddyville.
What is the Unemployment Rate in Eddyville?
Unemployment Rate in Eddyville is 2.5%.