Brownsville, KY Map & Demographics
Brownsville Map
Brownsville Overview
$15,605
PER CAPITA INCOME
$51,750
AVG FAMILY INCOME
$34,150
AVG HOUSEHOLD INCOME
52.7%
WAGE / INCOME GAP [ % ]
47.3¢/ $1
WAGE / INCOME GAP [ $ ]
$10,742
FAMILY INCOME DEFICIT
0.42
INEQUALITY / GINI INDEX
1,050
TOTAL POPULATION
416
MALE POPULATION
634
FEMALE POPULATION
65.62
MALES / 100 FEMALES
152.40
FEMALES / 100 MALES
30.1
MEDIAN AGE
3.3
AVG FAMILY SIZE
2.8
AVG HOUSEHOLD SIZE
303
LABOR FORCE [ PEOPLE ]
42.0%
PERCENT IN LABOR FORCE
7.6%
UNEMPLOYMENT RATE
Brownsville Zip Codes
Brownsville Area Codes
Income in Brownsville
Income Overview in Brownsville
Per Capita Income in Brownsville is $15,605, while median incomes of families and households are $51,750 and $34,150 respectively.
| Characteristic | Number | Measure |
| Per Capita Income | 1,050 | $15,605 |
| Median Family Income | 241 | $51,750 |
| Mean Family Income | 241 | $55,578 |
| Median Household Income | 341 | $34,150 |
| Mean Household Income | 341 | $46,606 |
| Income Deficit | 241 | $10,742 |
| Wage / Income Gap (%) | 1,050 | 52.69% |
| Wage / Income Gap ($) | 1,050 | 47.31¢ per $1 |
| Gini / Inequality Index | 1,050 | 0.42 |
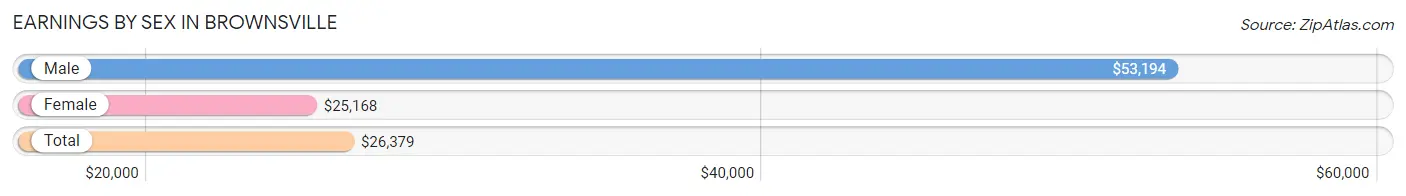
Earnings by Sex in Brownsville
Average Earnings in Brownsville are $26,379, $53,194 for men and $25,168 for women, a difference of 52.7%.
| Sex | Number | Average Earnings |
| Male | 139 (45.7%) | $53,194 |
| Female | 165 (54.3%) | $25,168 |
| Total | 304 (100.0%) | $26,379 |
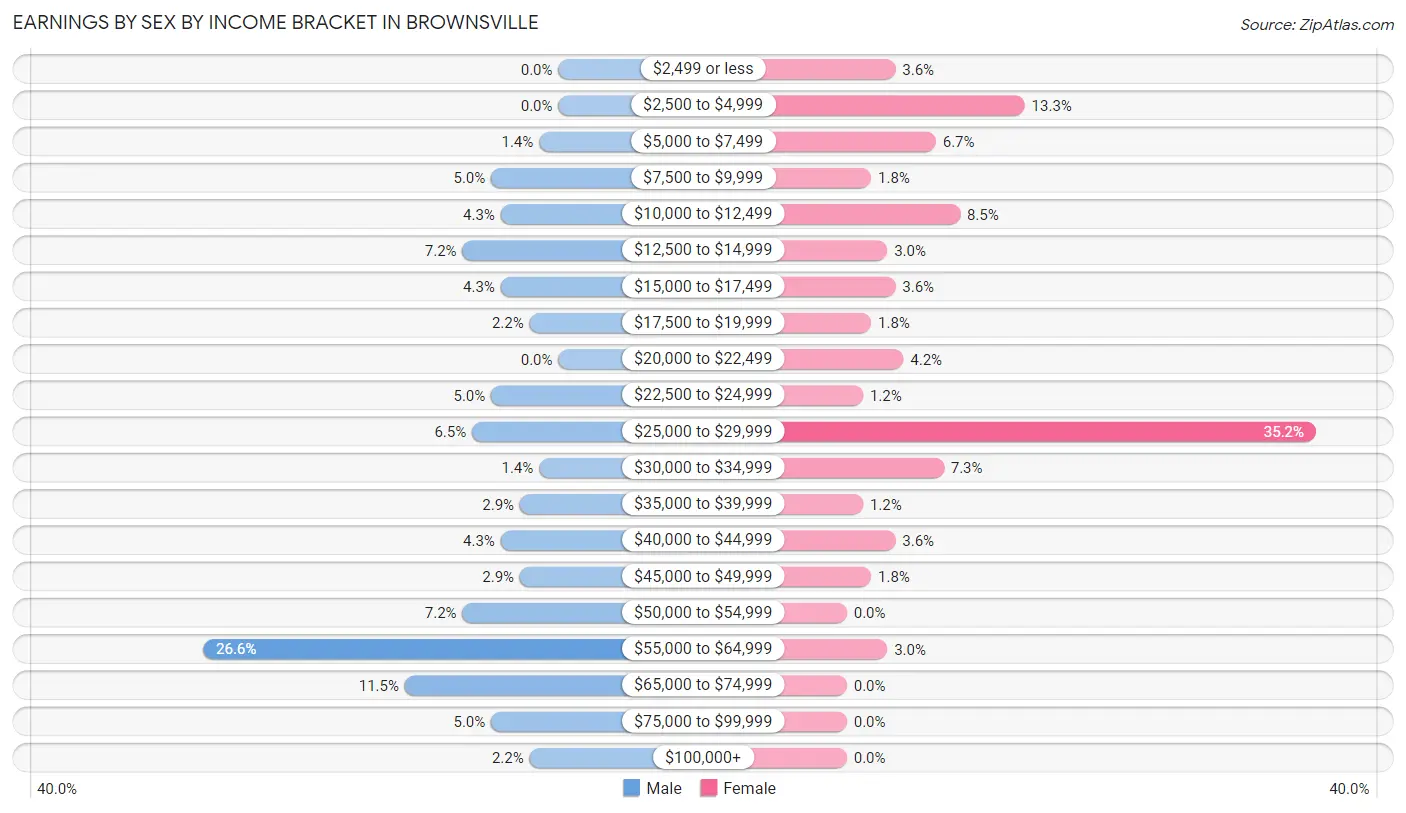
Earnings by Sex by Income Bracket in Brownsville
The most common earnings brackets in Brownsville are $55,000 to $64,999 for men (37 | 26.6%) and $25,000 to $29,999 for women (58 | 35.1%).
| Income | Male | Female |
| $2,499 or less | 0 (0.0%) | 6 (3.6%) |
| $2,500 to $4,999 | 0 (0.0%) | 22 (13.3%) |
| $5,000 to $7,499 | 2 (1.4%) | 11 (6.7%) |
| $7,500 to $9,999 | 7 (5.0%) | 3 (1.8%) |
| $10,000 to $12,499 | 6 (4.3%) | 14 (8.5%) |
| $12,500 to $14,999 | 10 (7.2%) | 5 (3.0%) |
| $15,000 to $17,499 | 6 (4.3%) | 6 (3.6%) |
| $17,500 to $19,999 | 3 (2.2%) | 3 (1.8%) |
| $20,000 to $22,499 | 0 (0.0%) | 7 (4.2%) |
| $22,500 to $24,999 | 7 (5.0%) | 2 (1.2%) |
| $25,000 to $29,999 | 9 (6.5%) | 58 (35.1%) |
| $30,000 to $34,999 | 2 (1.4%) | 12 (7.3%) |
| $35,000 to $39,999 | 4 (2.9%) | 2 (1.2%) |
| $40,000 to $44,999 | 6 (4.3%) | 6 (3.6%) |
| $45,000 to $49,999 | 4 (2.9%) | 3 (1.8%) |
| $50,000 to $54,999 | 10 (7.2%) | 0 (0.0%) |
| $55,000 to $64,999 | 37 (26.6%) | 5 (3.0%) |
| $65,000 to $74,999 | 16 (11.5%) | 0 (0.0%) |
| $75,000 to $99,999 | 7 (5.0%) | 0 (0.0%) |
| $100,000+ | 3 (2.2%) | 0 (0.0%) |
| Total | 139 (100.0%) | 165 (100.0%) |
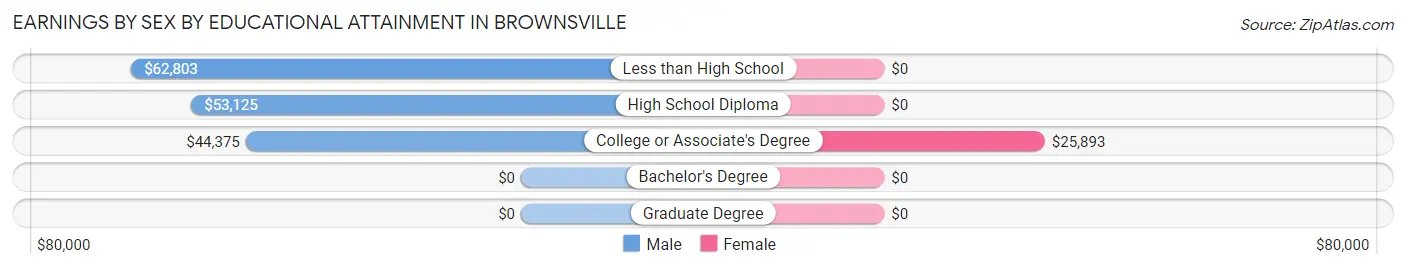
Earnings by Sex by Educational Attainment in Brownsville
Average earnings in Brownsville are $62,652 for men and $25,505 for women, a difference of 59.3%. Men with an educational attainment of less than high school enjoy the highest average annual earnings of $62,803, while those with college or associate's degree education earn the least with $44,375. Women with an educational attainment of college or associate's degree earn the most with the average annual earnings of $25,893, while those with college or associate's degree education have the smallest earnings of $25,893.
| Educational Attainment | Male Income | Female Income |
| Less than High School | $62,803 | $0 |
| High School Diploma | $53,125 | $0 |
| College or Associate's Degree | $44,375 | $25,893 |
| Bachelor's Degree | - | - |
| Graduate Degree | - | - |
| Total | $62,652 | $25,505 |
Family Income in Brownsville
Family Income Brackets in Brownsville
According to the Brownsville family income data, there are 48 families falling into the $50,000 to $74,999 income range, which is the most common income bracket and makes up 19.9% of all families.
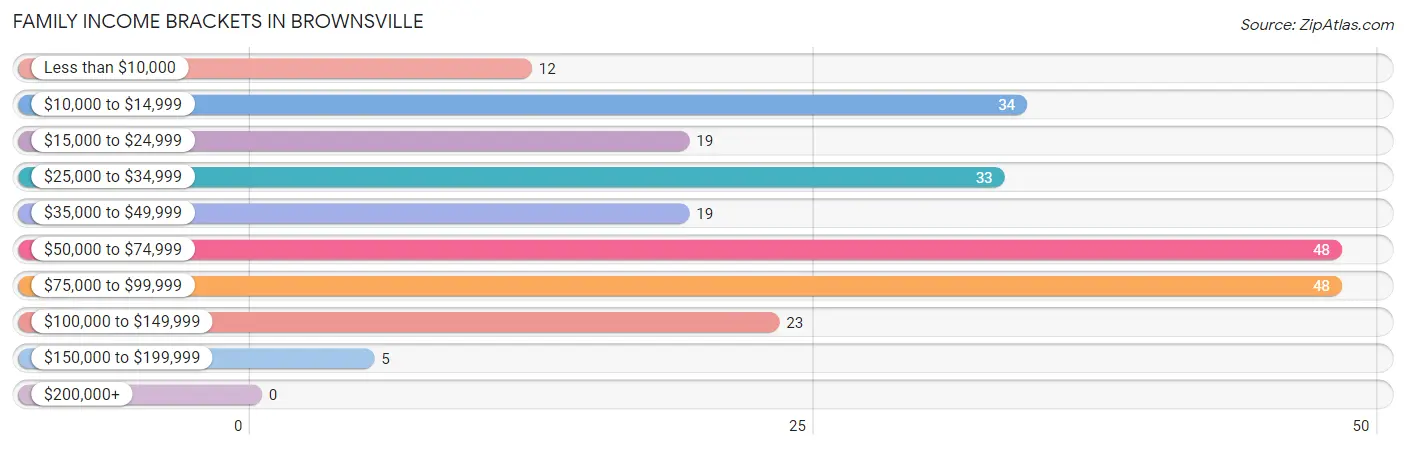
| Income Bracket | # Families | % Families |
| Less than $10,000 | 12 | 5.0% |
| $10,000 to $14,999 | 34 | 14.1% |
| $15,000 to $24,999 | 19 | 7.9% |
| $25,000 to $34,999 | 33 | 13.7% |
| $35,000 to $49,999 | 19 | 7.9% |
| $50,000 to $74,999 | 48 | 19.9% |
| $75,000 to $99,999 | 48 | 19.9% |
| $100,000 to $149,999 | 23 | 9.5% |
| $150,000 to $199,999 | 5 | 2.1% |
| $200,000+ | 0 | 0.0% |
Family Income by Famaliy Size in Brownsville
5-person families (12 | 5.0%) account for the highest median family income in Brownsville with $77,500 per family, while 2-person families (104 | 43.1%) have the highest median income of $24,584 per family member.
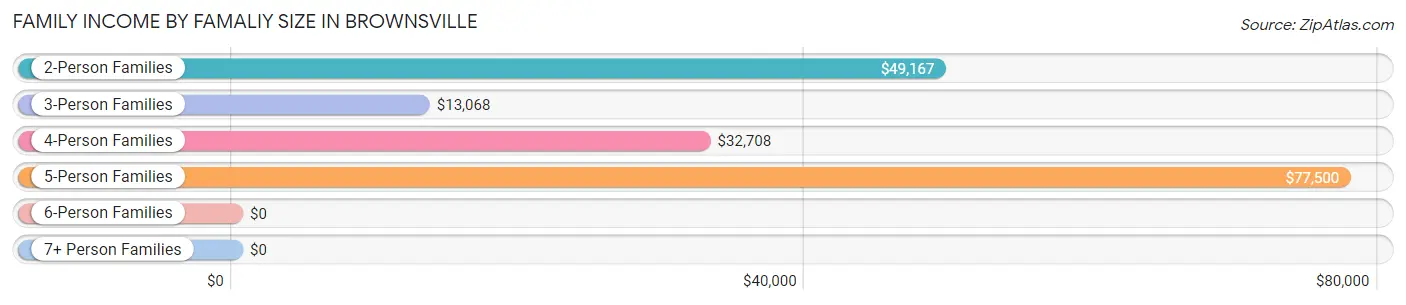
| Income Bracket | # Families | Median Income |
| 2-Person Families | 104 (43.1%) | $49,167 |
| 3-Person Families | 59 (24.5%) | $13,068 |
| 4-Person Families | 23 (9.5%) | $32,708 |
| 5-Person Families | 12 (5.0%) | $77,500 |
| 6-Person Families | 0 (0.0%) | $0 |
| 7+ Person Families | 43 (17.8%) | $0 |
| Total | 241 (100.0%) | $51,750 |
Family Income by Number of Earners in Brownsville
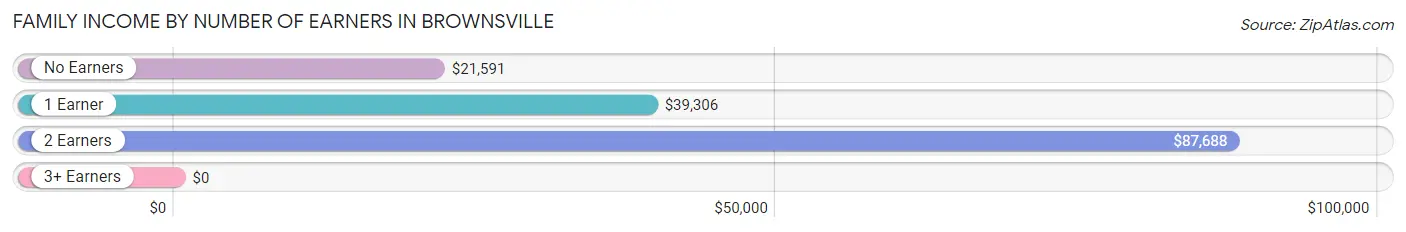
| Number of Earners | # Families | Median Income |
| No Earners | 58 (24.1%) | $21,591 |
| 1 Earner | 87 (36.1%) | $39,306 |
| 2 Earners | 92 (38.2%) | $87,688 |
| 3+ Earners | 4 (1.7%) | $0 |
| Total | 241 (100.0%) | $51,750 |
Household Income in Brownsville
Household Income Brackets in Brownsville
With 59 households falling in the category, the $10,000 to $14,999 income range is the most frequent in Brownsville, accounting for 17.3% of all households.
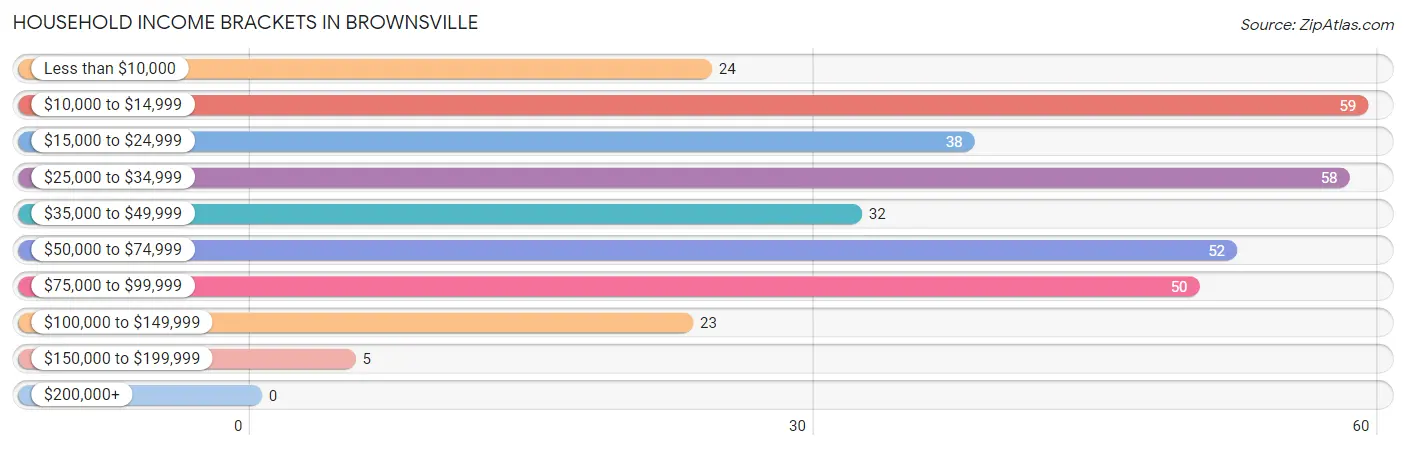
| Income Bracket | # Households | % Households |
| Less than $10,000 | 24 | 7.0% |
| $10,000 to $14,999 | 59 | 17.3% |
| $15,000 to $24,999 | 38 | 11.1% |
| $25,000 to $34,999 | 58 | 17.0% |
| $35,000 to $49,999 | 32 | 9.4% |
| $50,000 to $74,999 | 52 | 15.2% |
| $75,000 to $99,999 | 50 | 14.7% |
| $100,000 to $149,999 | 23 | 6.7% |
| $150,000 to $199,999 | 5 | 1.5% |
| $200,000+ | 0 | 0.0% |
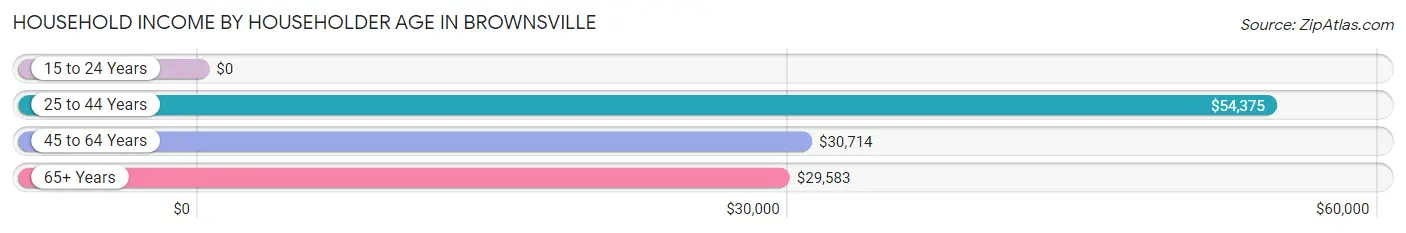
Household Income by Householder Age in Brownsville
The median household income in Brownsville is $34,150, with the highest median household income of $54,375 found in the 25 to 44 years age bracket for the primary householder. A total of 130 households (38.1%) fall into this category. Meanwhile, the 15 to 24 years age bracket for the primary householder has the lowest median household income of $0, with 18 households (5.3%) in this group.
| Income Bracket | # Households | Median Income |
| 15 to 24 Years | 18 (5.3%) | $0 |
| 25 to 44 Years | 130 (38.1%) | $54,375 |
| 45 to 64 Years | 90 (26.4%) | $30,714 |
| 65+ Years | 103 (30.2%) | $29,583 |
| Total | 341 (100.0%) | $34,150 |
Poverty in Brownsville
Income Below Poverty by Sex and Age in Brownsville
With 24.3% poverty level for males and 28.3% for females among the residents of Brownsville, 16 and 17 year old males and 18 to 24 year old females are the most vulnerable to poverty, with 4 males (66.7%) and 30 females (66.7%) in their respective age groups living below the poverty level.
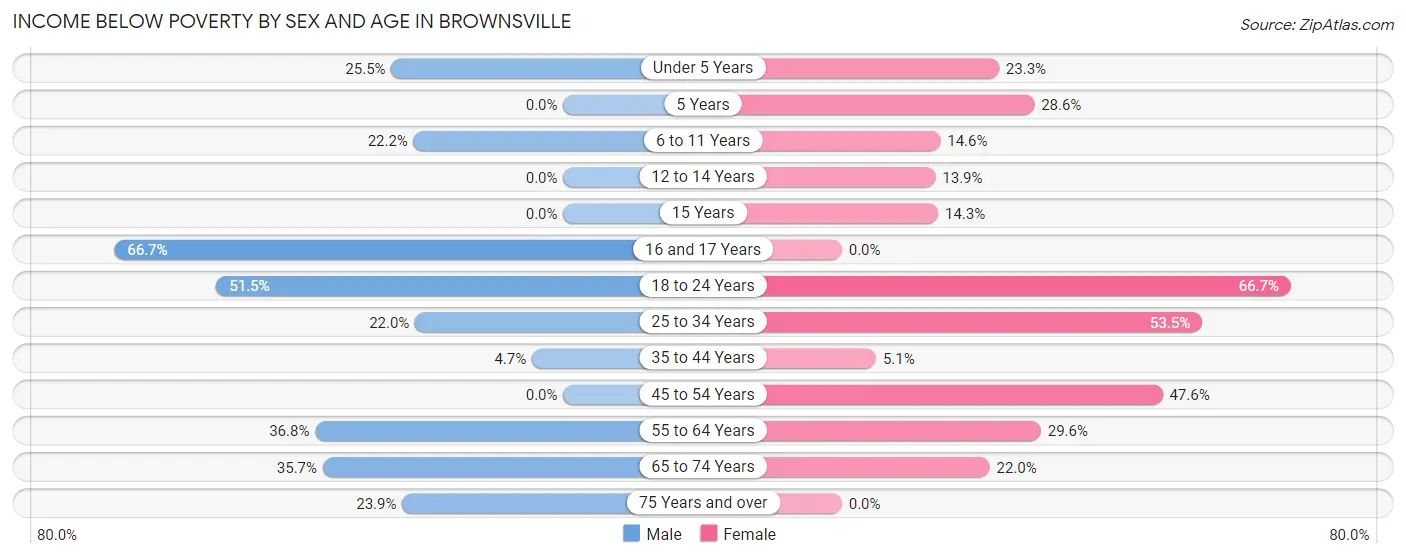
| Age Bracket | Male | Female |
| Under 5 Years | 12 (25.5%) | 21 (23.3%) |
| 5 Years | 0 (0.0%) | 2 (28.6%) |
| 6 to 11 Years | 14 (22.2%) | 6 (14.6%) |
| 12 to 14 Years | 0 (0.0%) | 5 (13.9%) |
| 15 Years | 0 (0.0%) | 2 (14.3%) |
| 16 and 17 Years | 4 (66.7%) | 0 (0.0%) |
| 18 to 24 Years | 17 (51.5%) | 30 (66.7%) |
| 25 to 34 Years | 11 (22.0%) | 46 (53.5%) |
| 35 to 44 Years | 2 (4.6%) | 3 (5.1%) |
| 45 to 54 Years | 0 (0.0%) | 20 (47.6%) |
| 55 to 64 Years | 7 (36.8%) | 13 (29.5%) |
| 65 to 74 Years | 15 (35.7%) | 9 (22.0%) |
| 75 Years and over | 11 (23.9%) | 0 (0.0%) |
| Total | 93 (24.3%) | 157 (28.3%) |
Income Above Poverty by Sex and Age in Brownsville
According to the poverty statistics in Brownsville, males aged 5 years and females aged 16 and 17 years are the age groups that are most secure financially, with 100.0% of males and 100.0% of females in these age groups living above the poverty line.
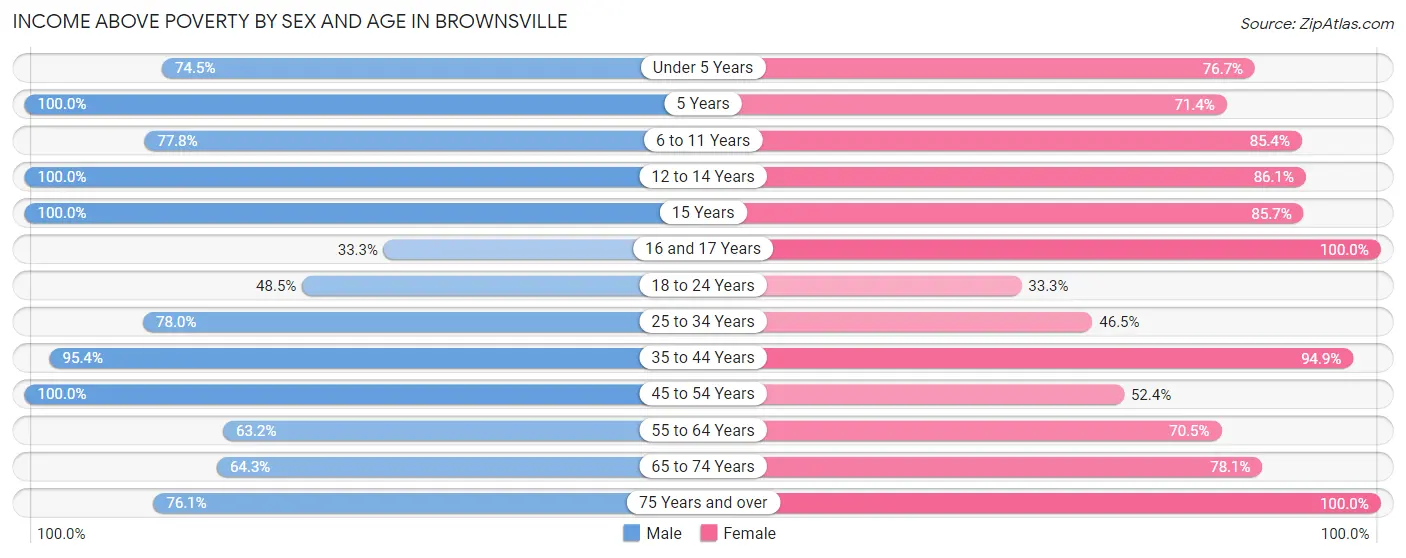
| Age Bracket | Male | Female |
| Under 5 Years | 35 (74.5%) | 69 (76.7%) |
| 5 Years | 1 (100.0%) | 5 (71.4%) |
| 6 to 11 Years | 49 (77.8%) | 35 (85.4%) |
| 12 to 14 Years | 1 (100.0%) | 31 (86.1%) |
| 15 Years | 1 (100.0%) | 12 (85.7%) |
| 16 and 17 Years | 2 (33.3%) | 2 (100.0%) |
| 18 to 24 Years | 16 (48.5%) | 15 (33.3%) |
| 25 to 34 Years | 39 (78.0%) | 40 (46.5%) |
| 35 to 44 Years | 41 (95.4%) | 56 (94.9%) |
| 45 to 54 Years | 31 (100.0%) | 22 (52.4%) |
| 55 to 64 Years | 12 (63.2%) | 31 (70.5%) |
| 65 to 74 Years | 27 (64.3%) | 32 (78.0%) |
| 75 Years and over | 35 (76.1%) | 47 (100.0%) |
| Total | 290 (75.7%) | 397 (71.7%) |
Income Below Poverty Among Married-Couple Families in Brownsville
The poverty statistics for married-couple families in Brownsville show that 11.3% or 20 of the total 177 families live below the poverty line. Families with 1 or 2 children have the highest poverty rate of 48.6%, comprising of 17 families. On the other hand, families with 5 or more children have the lowest poverty rate of 0.0%, which includes 0 families.
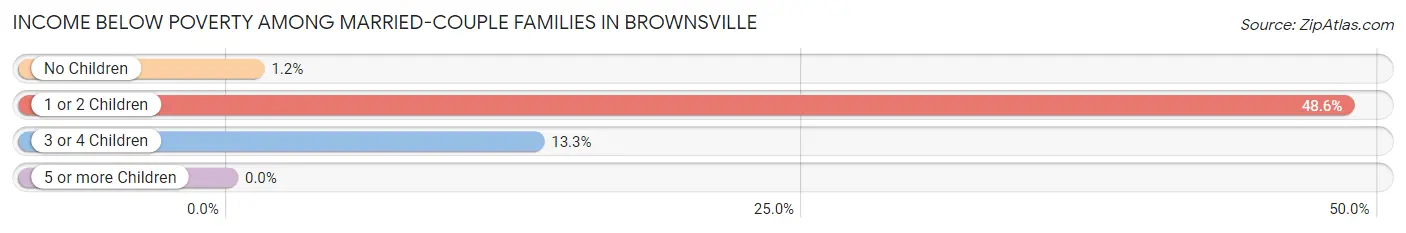
| Children | Above Poverty | Below Poverty |
| No Children | 86 (98.9%) | 1 (1.1%) |
| 1 or 2 Children | 18 (51.4%) | 17 (48.6%) |
| 3 or 4 Children | 13 (86.7%) | 2 (13.3%) |
| 5 or more Children | 40 (100.0%) | 0 (0.0%) |
| Total | 157 (88.7%) | 20 (11.3%) |
Income Below Poverty Among Single-Parent Households in Brownsville
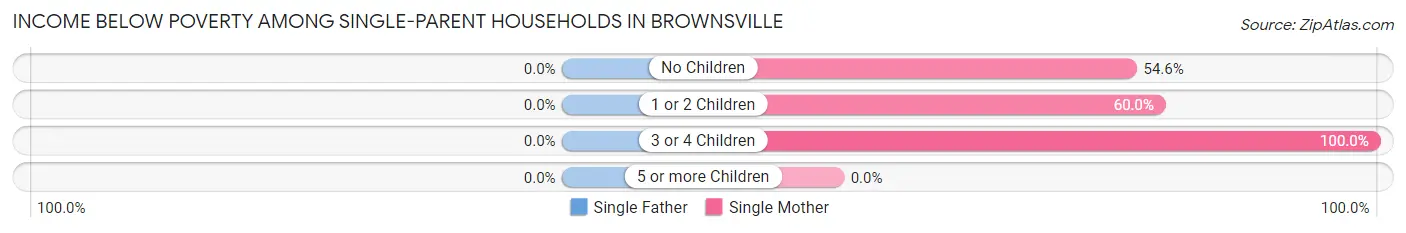
| Children | Single Father | Single Mother |
| No Children | 0 (0.0%) | 6 (54.5%) |
| 1 or 2 Children | 0 (0.0%) | 30 (60.0%) |
| 3 or 4 Children | 0 (0.0%) | 3 (100.0%) |
| 5 or more Children | 0 (0.0%) | 0 (0.0%) |
| Total | 0 (0.0%) | 39 (60.9%) |
Income Below Poverty Among Married-Couple vs Single-Parent Households in Brownsville
The poverty data for Brownsville shows that 20 of the married-couple family households (11.3%) and 39 of the single-parent households (60.9%) are living below the poverty level. Within the married-couple family households, those with 1 or 2 children have the highest poverty rate, with 17 households (48.6%) falling below the poverty line. Among the single-parent households, those with 3 or 4 children have the highest poverty rate, with 3 household (100.0%) living below poverty.
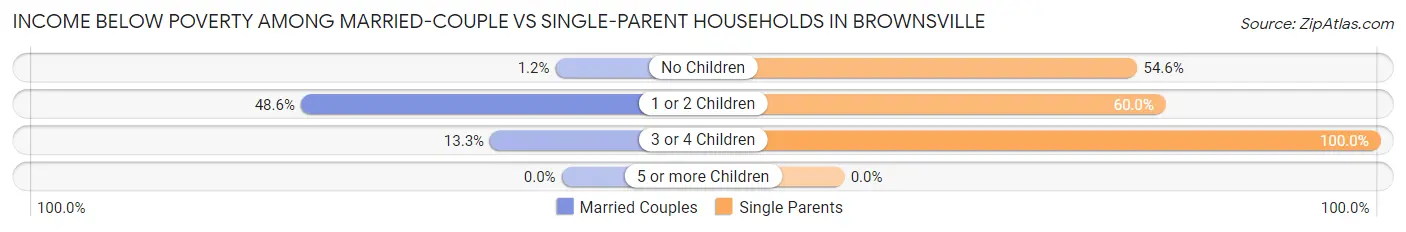
| Children | Married-Couple Families | Single-Parent Households |
| No Children | 1 (1.1%) | 6 (54.5%) |
| 1 or 2 Children | 17 (48.6%) | 30 (60.0%) |
| 3 or 4 Children | 2 (13.3%) | 3 (100.0%) |
| 5 or more Children | 0 (0.0%) | 0 (0.0%) |
| Total | 20 (11.3%) | 39 (60.9%) |
Race in Brownsville
The most populous races in Brownsville are White / Caucasian (1,008 | 96.0%), Two or more Races (35 | 3.3%), and Hispanic or Latino (13 | 1.2%).
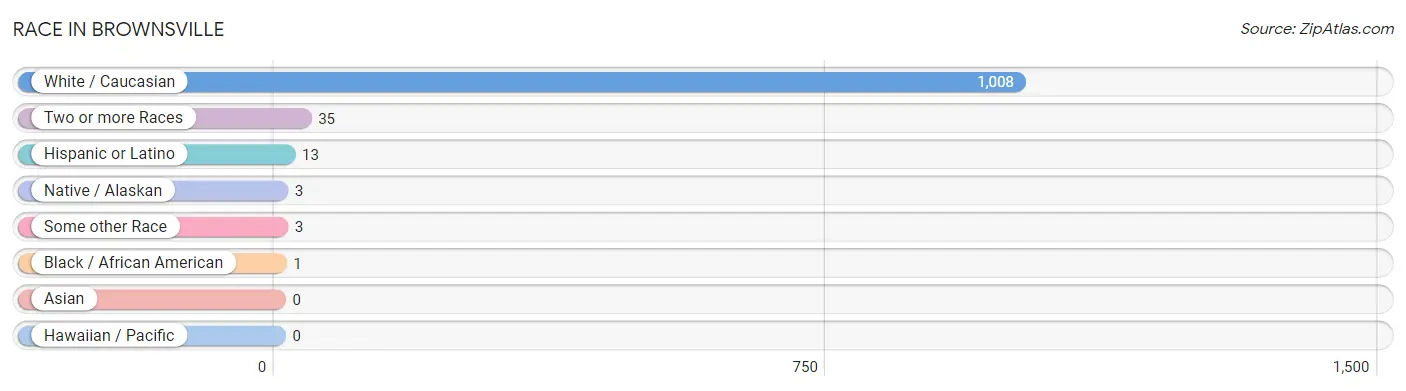
| Race | # Population | % Population |
| Asian | 0 | 0.0% |
| Black / African American | 1 | 0.1% |
| Hawaiian / Pacific | 0 | 0.0% |
| Hispanic or Latino | 13 | 1.2% |
| Native / Alaskan | 3 | 0.3% |
| White / Caucasian | 1,008 | 96.0% |
| Two or more Races | 35 | 3.3% |
| Some other Race | 3 | 0.3% |
| Total | 1,050 | 100.0% |
Ancestry in Brownsville
The most populous ancestries reported in Brownsville are German (291 | 27.7%), Irish (119 | 11.3%), American (99 | 9.4%), English (74 | 7.0%), and Austrian (32 | 3.0%), together accounting for 58.6% of all Brownsville residents.
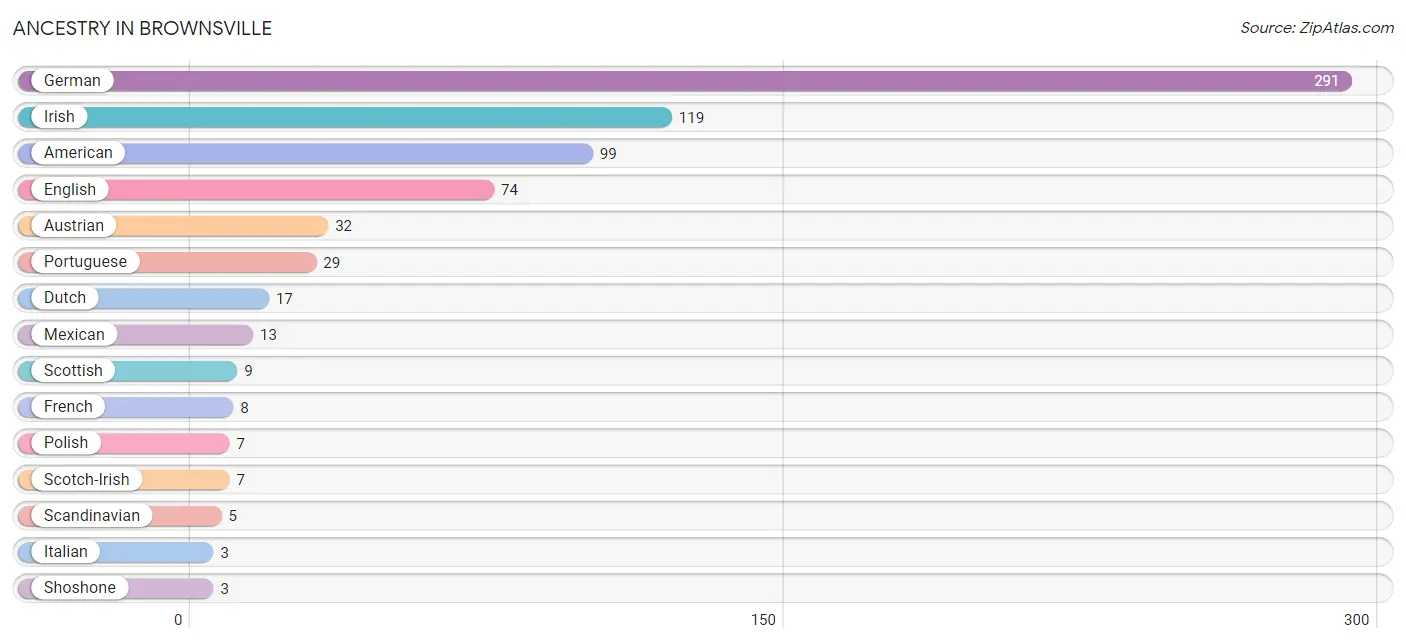
| Ancestry | # Population | % Population |
| American | 99 | 9.4% |
| Austrian | 32 | 3.0% |
| Burmese | 1 | 0.1% |
| Cherokee | 1 | 0.1% |
| Dutch | 17 | 1.6% |
| English | 74 | 7.0% |
| French | 8 | 0.8% |
| German | 291 | 27.7% |
| Irish | 119 | 11.3% |
| Italian | 3 | 0.3% |
| Mexican | 13 | 1.2% |
| Polish | 7 | 0.7% |
| Portuguese | 29 | 2.8% |
| Scandinavian | 5 | 0.5% |
| Scotch-Irish | 7 | 0.7% |
| Scottish | 9 | 0.9% |
| Shoshone | 3 | 0.3% | View All 17 Rows |
Immigrants in Brownsville

| Immigration Origin | # Population | % Population | View All 0 Rows |
Sex and Age in Brownsville
Sex and Age in Brownsville
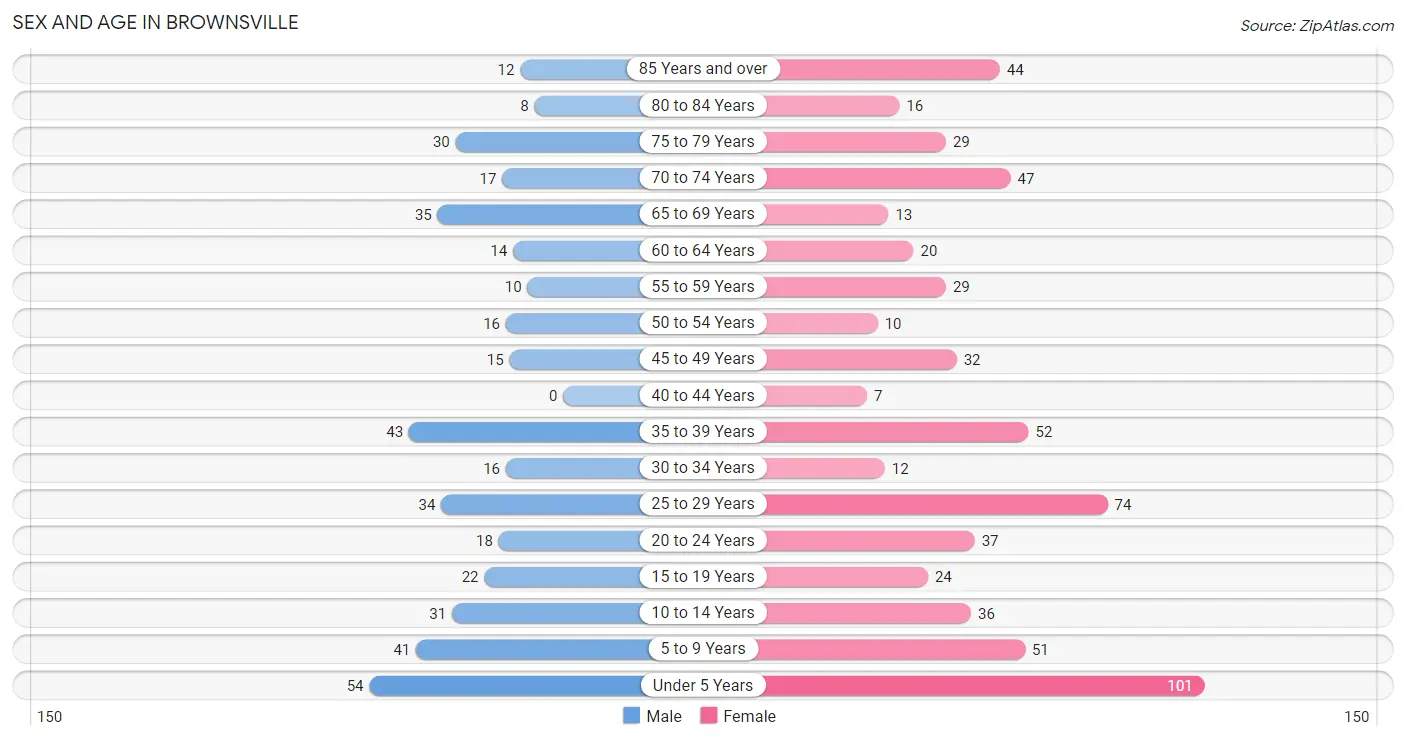
The most populous age groups in Brownsville are Under 5 Years (54 | 13.0%) for men and Under 5 Years (101 | 15.9%) for women.
| Age Bracket | Male | Female |
| Under 5 Years | 54 (13.0%) | 101 (15.9%) |
| 5 to 9 Years | 41 (9.9%) | 51 (8.0%) |
| 10 to 14 Years | 31 (7.4%) | 36 (5.7%) |
| 15 to 19 Years | 22 (5.3%) | 24 (3.8%) |
| 20 to 24 Years | 18 (4.3%) | 37 (5.8%) |
| 25 to 29 Years | 34 (8.2%) | 74 (11.7%) |
| 30 to 34 Years | 16 (3.8%) | 12 (1.9%) |
| 35 to 39 Years | 43 (10.3%) | 52 (8.2%) |
| 40 to 44 Years | 0 (0.0%) | 7 (1.1%) |
| 45 to 49 Years | 15 (3.6%) | 32 (5.1%) |
| 50 to 54 Years | 16 (3.8%) | 10 (1.6%) |
| 55 to 59 Years | 10 (2.4%) | 29 (4.6%) |
| 60 to 64 Years | 14 (3.4%) | 20 (3.2%) |
| 65 to 69 Years | 35 (8.4%) | 13 (2.1%) |
| 70 to 74 Years | 17 (4.1%) | 47 (7.4%) |
| 75 to 79 Years | 30 (7.2%) | 29 (4.6%) |
| 80 to 84 Years | 8 (1.9%) | 16 (2.5%) |
| 85 Years and over | 12 (2.9%) | 44 (6.9%) |
| Total | 416 (100.0%) | 634 (100.0%) |
Families and Households in Brownsville
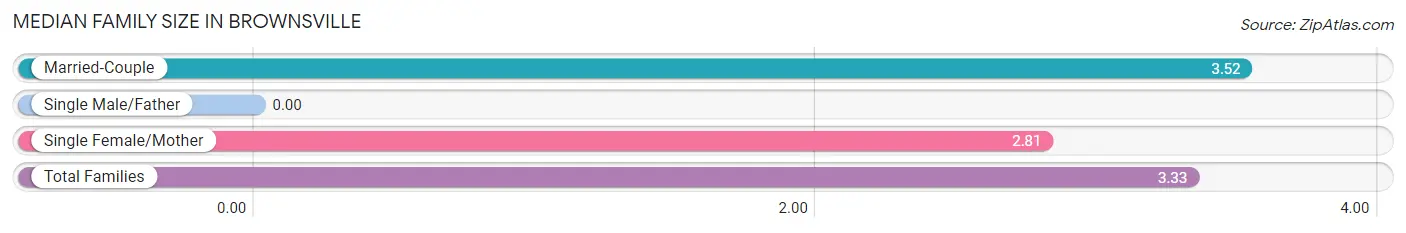
Median Family Size in Brownsville
| Family Type | # Families | Family Size |
| Married-Couple | 177 (73.4%) | 3.52 |
| Single Male/Father | 0 (0.0%) | - |
| Single Female/Mother | 64 (26.6%) | 2.81 |
| Total Families | 241 (100.0%) | 3.33 |
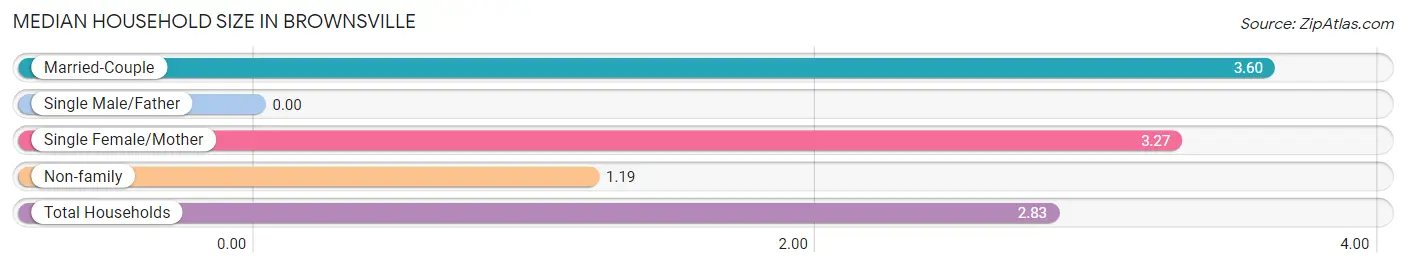
Median Household Size in Brownsville
| Household Type | # Households | Household Size |
| Married-Couple | 177 (51.9%) | 3.60 |
| Single Male/Father | 0 (0.0%) | - |
| Single Female/Mother | 64 (18.8%) | 3.27 |
| Non-family | 100 (29.3%) | 1.19 |
| Total Households | 341 (100.0%) | 2.83 |
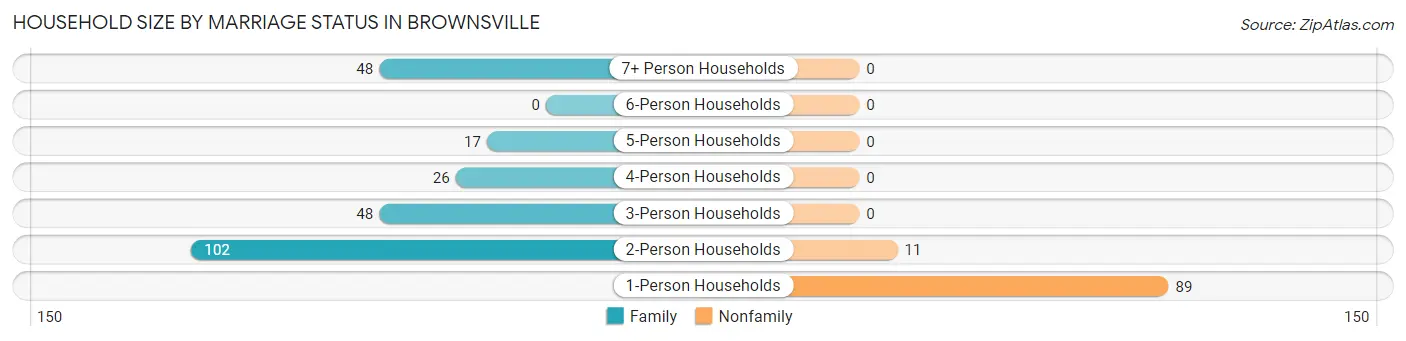
Household Size by Marriage Status in Brownsville
Out of a total of 341 households in Brownsville, 241 (70.7%) are family households, while 100 (29.3%) are nonfamily households. The most numerous type of family households are 2-person households, comprising 102, and the most common type of nonfamily households are 1-person households, comprising 89.
| Household Size | Family Households | Nonfamily Households |
| 1-Person Households | - | 89 (26.1%) |
| 2-Person Households | 102 (29.9%) | 11 (3.2%) |
| 3-Person Households | 48 (14.1%) | 0 (0.0%) |
| 4-Person Households | 26 (7.6%) | 0 (0.0%) |
| 5-Person Households | 17 (5.0%) | 0 (0.0%) |
| 6-Person Households | 0 (0.0%) | 0 (0.0%) |
| 7+ Person Households | 48 (14.1%) | 0 (0.0%) |
| Total | 241 (70.7%) | 100 (29.3%) |
Female Fertility in Brownsville
Fertility by Age in Brownsville
Average fertility rate in Brownsville is 206.0 births per 1,000 women. Women in the age bracket of 35 to 50 years have the highest fertility rate with 440.0 births per 1,000 women. Women in the age bracket of 35 to 50 years acount for 81.6% of all women with births.
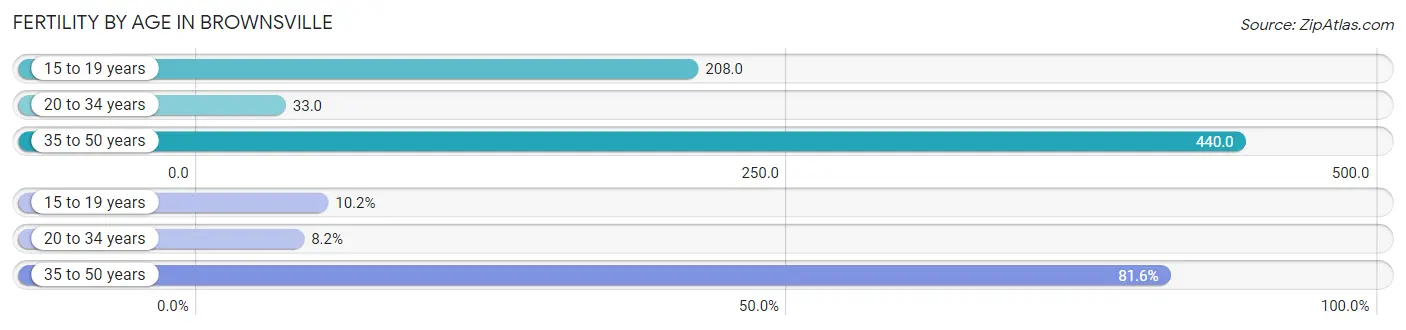
| Age Bracket | Women with Births | Births / 1,000 Women |
| 15 to 19 years | 5 (10.2%) | 208.0 |
| 20 to 34 years | 4 (8.2%) | 33.0 |
| 35 to 50 years | 40 (81.6%) | 440.0 |
| Total | 49 (100.0%) | 206.0 |
Fertility by Age by Marriage Status in Brownsville
91.8% of women with births (49) in Brownsville are married. The highest percentage of unmarried women with births falls into 15 to 19 years age bracket with 80.0% of them unmarried at the time of birth, while the lowest percentage of unmarried women with births belong to 20 to 34 years age bracket with 0.0% of them unmarried.
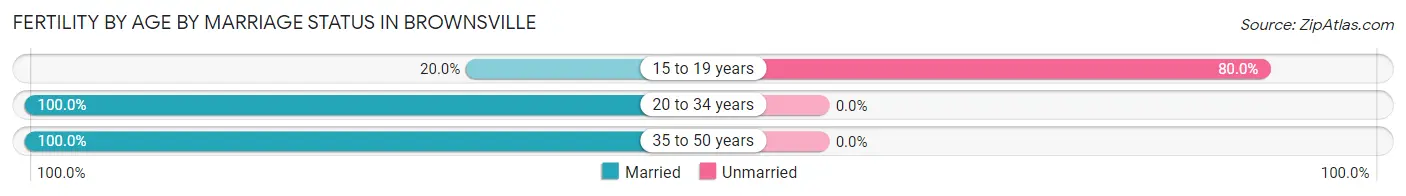
| Age Bracket | Married | Unmarried |
| 15 to 19 years | 1 (20.0%) | 4 (80.0%) |
| 20 to 34 years | 4 (100.0%) | 0 (0.0%) |
| 35 to 50 years | 40 (100.0%) | 0 (0.0%) |
| Total | 45 (91.8%) | 4 (8.2%) |
Fertility by Education in Brownsville
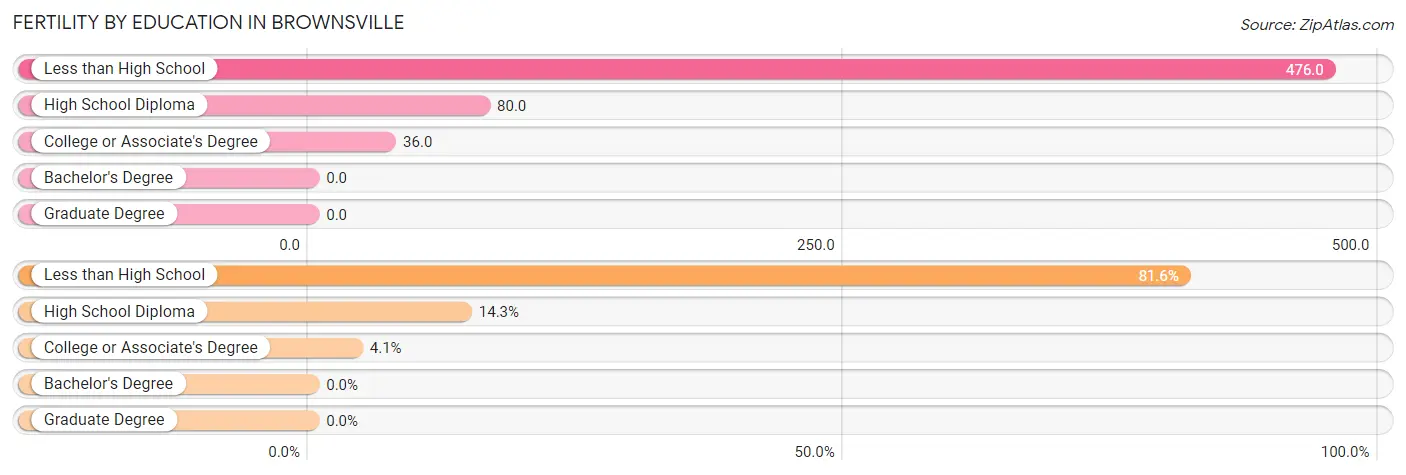
| Educational Attainment | Women with Births | Births / 1,000 Women |
| Less than High School | 40 (81.6%) | 476.0 |
| High School Diploma | 7 (14.3%) | 80.0 |
| College or Associate's Degree | 2 (4.1%) | 36.0 |
| Bachelor's Degree | 0 (0.0%) | 0.0 |
| Graduate Degree | 0 (0.0%) | 0.0 |
| Total | 49 (100.0%) | 206.0 |
Fertility by Education by Marriage Status in Brownsville
8.2% of women with births in Brownsville are unmarried. Women with the educational attainment of less than high school are most likely to be married with 100.0% of them married at childbirth, while women with the educational attainment of high school diploma are least likely to be married with 57.1% of them unmarried at childbirth.
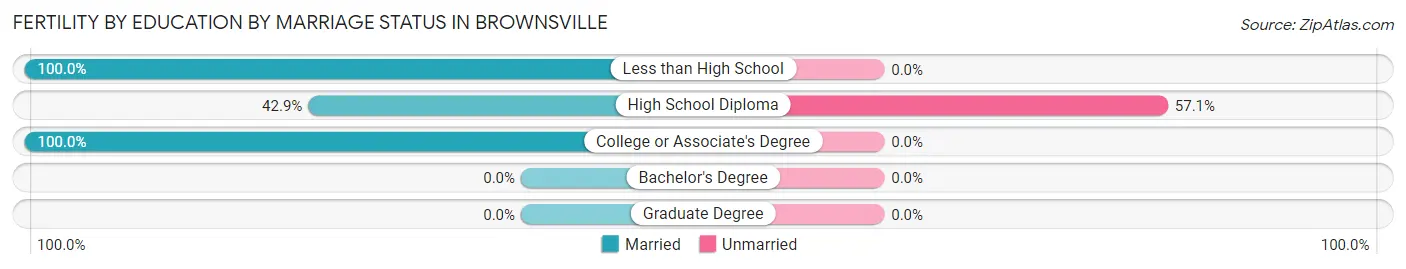
| Educational Attainment | Married | Unmarried |
| Less than High School | 40 (100.0%) | 0 (0.0%) |
| High School Diploma | 3 (42.9%) | 4 (57.1%) |
| College or Associate's Degree | 2 (100.0%) | 0 (0.0%) |
| Bachelor's Degree | 0 (0.0%) | 0 (0.0%) |
| Graduate Degree | 0 (0.0%) | 0 (0.0%) |
| Total | 45 (91.8%) | 4 (8.2%) |
Employment Characteristics in Brownsville
Employment by Class of Employer in Brownsville
Among the 271 employed individuals in Brownsville, private company employees (155 | 57.2%), not-for-profit organizations (86 | 31.7%), and state government employees (11 | 4.1%) make up the most common classes of employment.
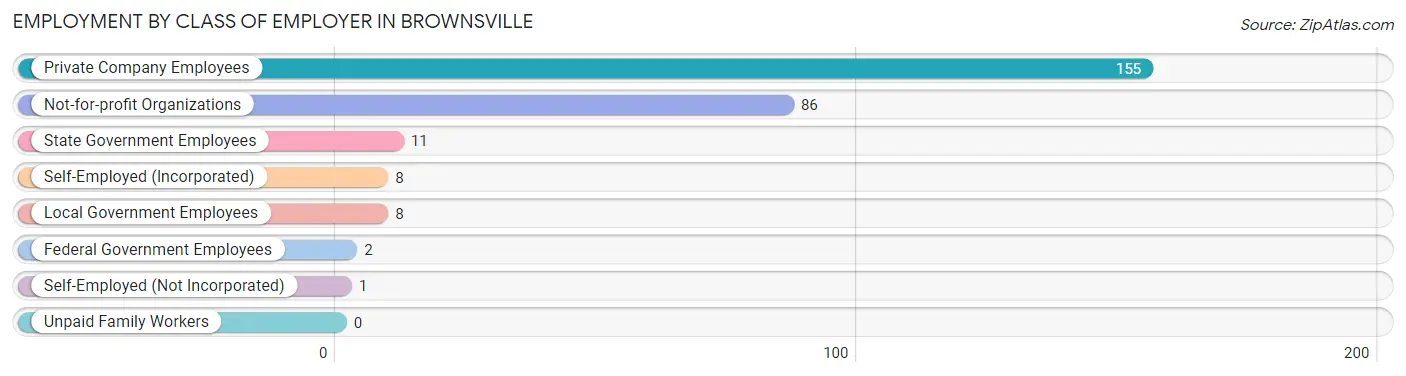
| Employer Class | # Employees | % Employees |
| Private Company Employees | 155 | 57.2% |
| Self-Employed (Incorporated) | 8 | 2.9% |
| Self-Employed (Not Incorporated) | 1 | 0.4% |
| Not-for-profit Organizations | 86 | 31.7% |
| Local Government Employees | 8 | 2.9% |
| State Government Employees | 11 | 4.1% |
| Federal Government Employees | 2 | 0.7% |
| Unpaid Family Workers | 0 | 0.0% |
| Total | 271 | 100.0% |
Employment Status by Age in Brownsville
According to the labor force statistics for Brownsville, out of the total population over 16 years of age (721), 42.0% or 303 individuals are in the labor force, with 7.6% or 23 of them unemployed. The age group with the highest labor force participation rate is 35 to 44 years, with 96.1% or 98 individuals in the labor force. Within the labor force, the 60 to 64 years age range has the highest percentage of unemployed individuals, with 30.0% or 3 of them being unemployed.
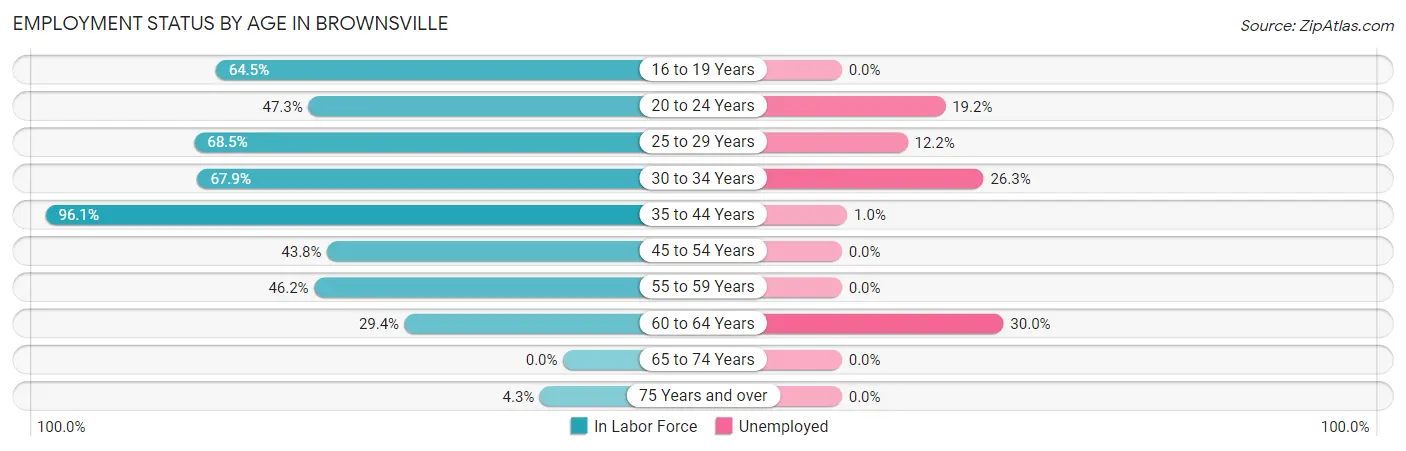
| Age Bracket | In Labor Force | Unemployed |
| 16 to 19 Years | 20 (64.5%) | 0 (0.0%) |
| 20 to 24 Years | 26 (47.3%) | 5 (19.2%) |
| 25 to 29 Years | 74 (68.5%) | 9 (12.2%) |
| 30 to 34 Years | 19 (67.9%) | 5 (26.3%) |
| 35 to 44 Years | 98 (96.1%) | 1 (1.0%) |
| 45 to 54 Years | 32 (43.8%) | 0 (0.0%) |
| 55 to 59 Years | 18 (46.2%) | 0 (0.0%) |
| 60 to 64 Years | 10 (29.4%) | 3 (30.0%) |
| 65 to 74 Years | 0 (0.0%) | 0 (0.0%) |
| 75 Years and over | 6 (4.3%) | 0 (0.0%) |
| Total | 303 (42.0%) | 23 (7.6%) |
Employment Status by Educational Attainment in Brownsville
According to labor force statistics for Brownsville, 65.4% of individuals (251) out of the total population between 25 and 64 years of age (384) are in the labor force, with 7.2% or 18 of them being unemployed. The group with the highest labor force participation rate are those with the educational attainment of less than high school, with 71.9% or 105 individuals in the labor force. Within the labor force, individuals with college / associate degree education have the highest percentage of unemployment, with 10.7% or 6 of them being unemployed.
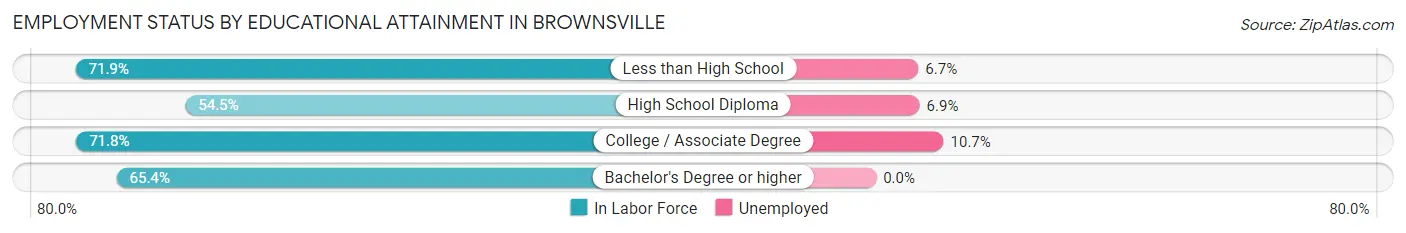
| Educational Attainment | In Labor Force | Unemployed |
| Less than High School | 105 (71.9%) | 10 (6.7%) |
| High School Diploma | 73 (54.5%) | 9 (6.9%) |
| College / Associate Degree | 56 (71.8%) | 8 (10.7%) |
| Bachelor's Degree or higher | 17 (65.4%) | 0 (0.0%) |
| Total | 251 (65.4%) | 28 (7.2%) |
Employment Occupations by Sex in Brownsville
Management, Business, Science and Arts Occupations
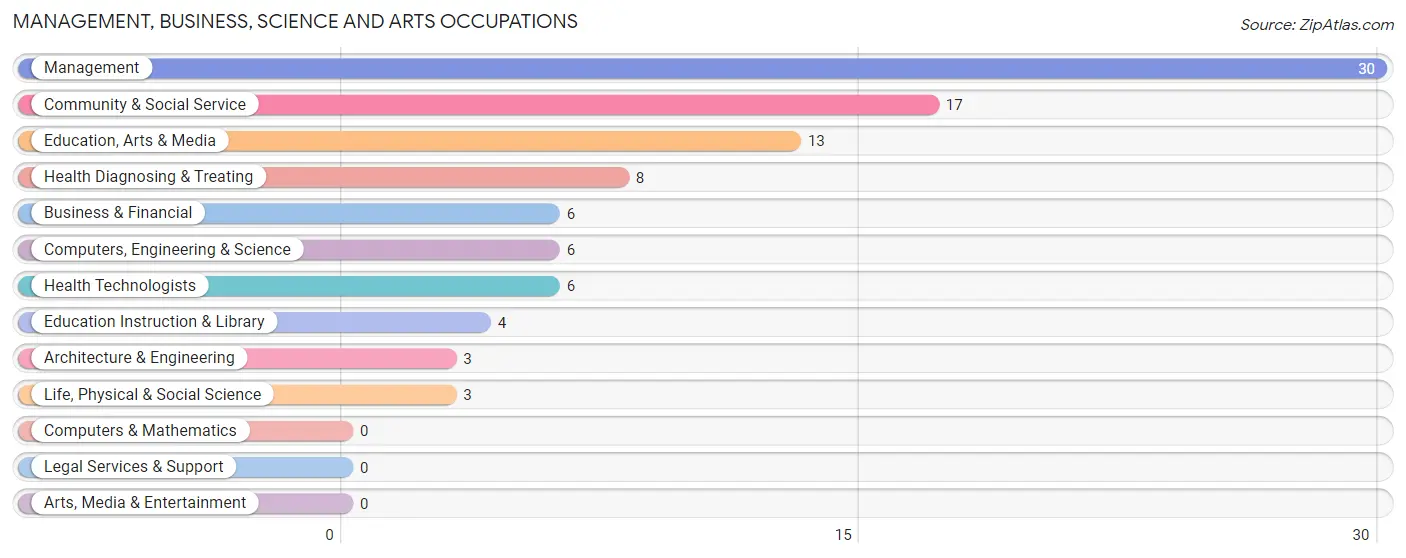
The most common Management, Business, Science and Arts occupations in Brownsville are Management (30 | 10.7%), Community & Social Service (17 | 6.1%), Education, Arts & Media (13 | 4.7%), Health Diagnosing & Treating (8 | 2.9%), and Business & Financial (6 | 2.1%).
Management, Business, Science and Arts Occupations by Sex
Within the Management, Business, Science and Arts occupations in Brownsville, the most male-oriented occupations are Computers, Engineering & Science (100.0%), Architecture & Engineering (100.0%), and Life, Physical & Social Science (100.0%), while the most female-oriented occupations are Business & Financial (100.0%), Health Technologists (100.0%), and Education, Arts & Media (84.6%).
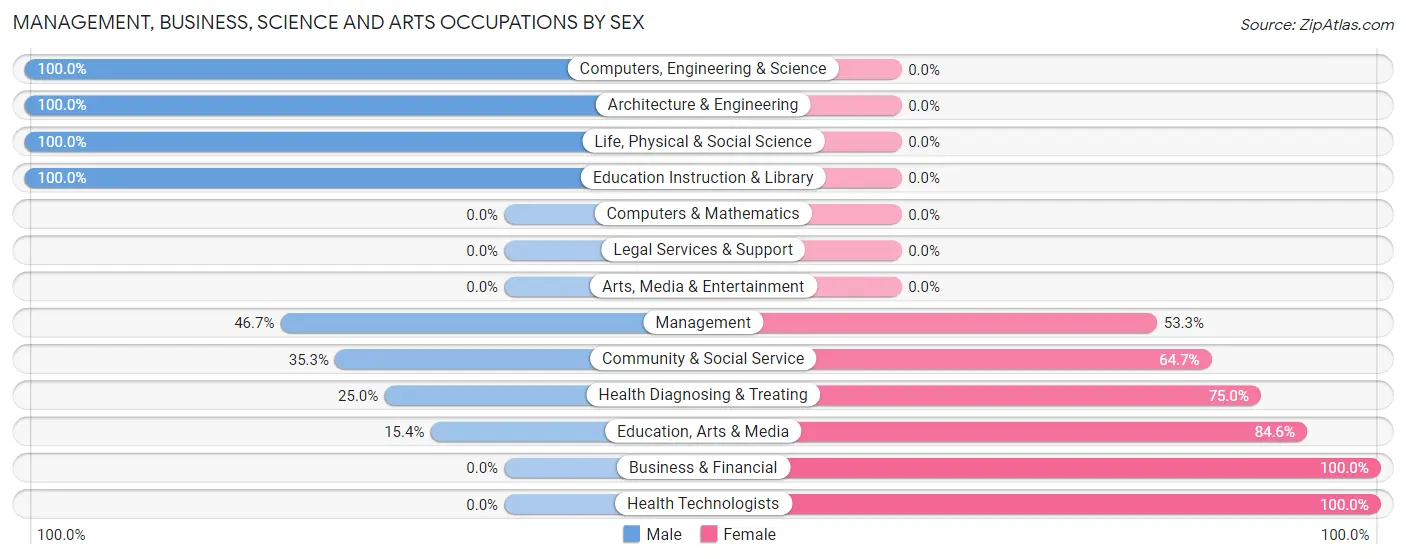
| Occupation | Male | Female |
| Management | 14 (46.7%) | 16 (53.3%) |
| Business & Financial | 0 (0.0%) | 6 (100.0%) |
| Computers, Engineering & Science | 6 (100.0%) | 0 (0.0%) |
| Computers & Mathematics | 0 (0.0%) | 0 (0.0%) |
| Architecture & Engineering | 3 (100.0%) | 0 (0.0%) |
| Life, Physical & Social Science | 3 (100.0%) | 0 (0.0%) |
| Community & Social Service | 6 (35.3%) | 11 (64.7%) |
| Education, Arts & Media | 2 (15.4%) | 11 (84.6%) |
| Legal Services & Support | 0 (0.0%) | 0 (0.0%) |
| Education Instruction & Library | 4 (100.0%) | 0 (0.0%) |
| Arts, Media & Entertainment | 0 (0.0%) | 0 (0.0%) |
| Health Diagnosing & Treating | 2 (25.0%) | 6 (75.0%) |
| Health Technologists | 0 (0.0%) | 6 (100.0%) |
| Total (Category) | 28 (41.8%) | 39 (58.2%) |
| Total (Overall) | 129 (46.2%) | 150 (53.8%) |
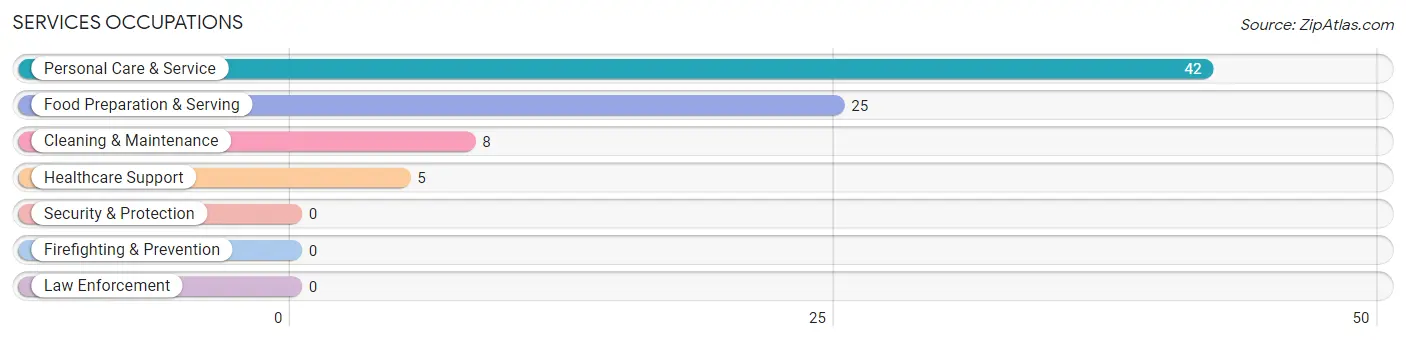
Services Occupations
The most common Services occupations in Brownsville are Personal Care & Service (42 | 15.0%), Food Preparation & Serving (25 | 9.0%), Cleaning & Maintenance (8 | 2.9%), and Healthcare Support (5 | 1.8%).
Services Occupations by Sex
Within the Services occupations in Brownsville, the most male-oriented occupations are Personal Care & Service (4.8%), and Food Preparation & Serving (4.0%), while the most female-oriented occupations are Healthcare Support (100.0%), Cleaning & Maintenance (100.0%), and Food Preparation & Serving (96.0%).
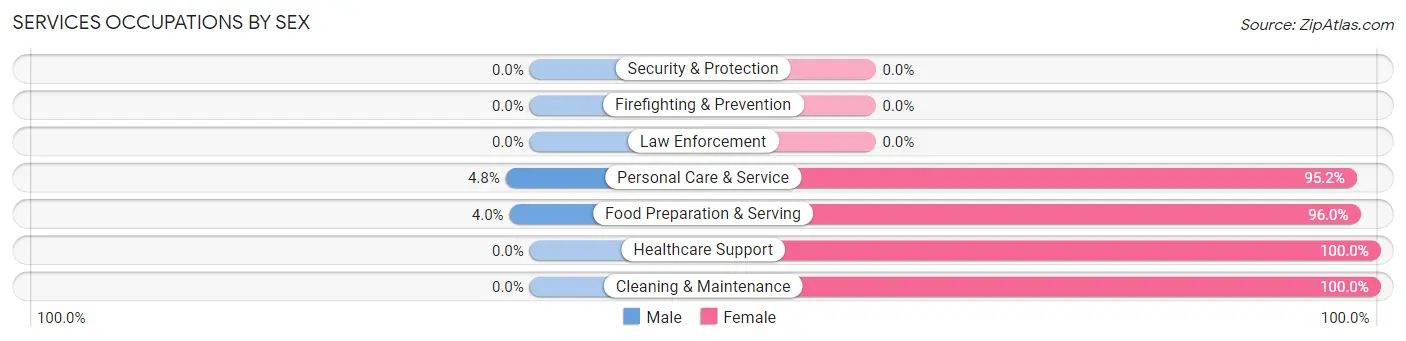
| Occupation | Male | Female |
| Healthcare Support | 0 (0.0%) | 5 (100.0%) |
| Security & Protection | 0 (0.0%) | 0 (0.0%) |
| Firefighting & Prevention | 0 (0.0%) | 0 (0.0%) |
| Law Enforcement | 0 (0.0%) | 0 (0.0%) |
| Food Preparation & Serving | 1 (4.0%) | 24 (96.0%) |
| Cleaning & Maintenance | 0 (0.0%) | 8 (100.0%) |
| Personal Care & Service | 2 (4.8%) | 40 (95.2%) |
| Total (Category) | 3 (3.7%) | 77 (96.3%) |
| Total (Overall) | 129 (46.2%) | 150 (53.8%) |
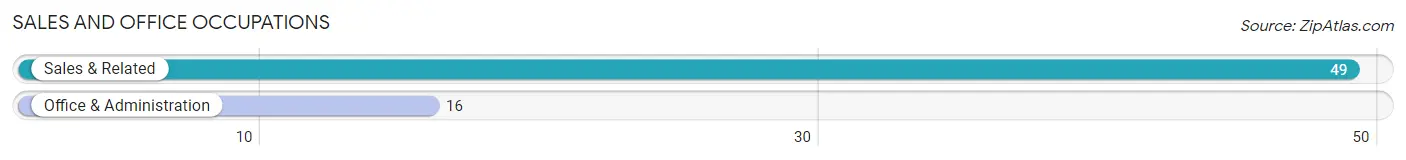
Sales and Office Occupations
The most common Sales and Office occupations in Brownsville are Sales & Related (49 | 17.6%), and Office & Administration (16 | 5.7%).
Sales and Office Occupations by Sex
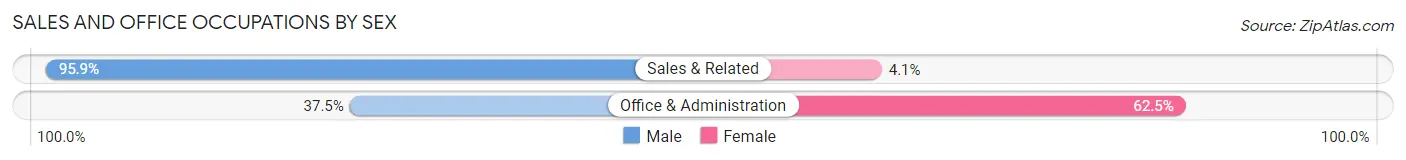
| Occupation | Male | Female |
| Sales & Related | 47 (95.9%) | 2 (4.1%) |
| Office & Administration | 6 (37.5%) | 10 (62.5%) |
| Total (Category) | 53 (81.5%) | 12 (18.5%) |
| Total (Overall) | 129 (46.2%) | 150 (53.8%) |
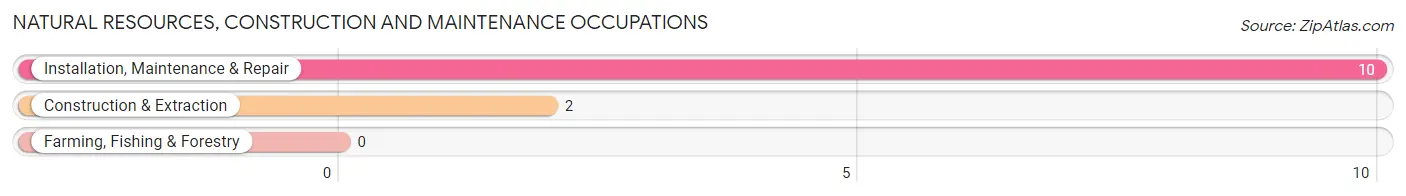
Natural Resources, Construction and Maintenance Occupations
The most common Natural Resources, Construction and Maintenance occupations in Brownsville are Installation, Maintenance & Repair (10 | 3.6%), and Construction & Extraction (2 | 0.7%).
Natural Resources, Construction and Maintenance Occupations by Sex
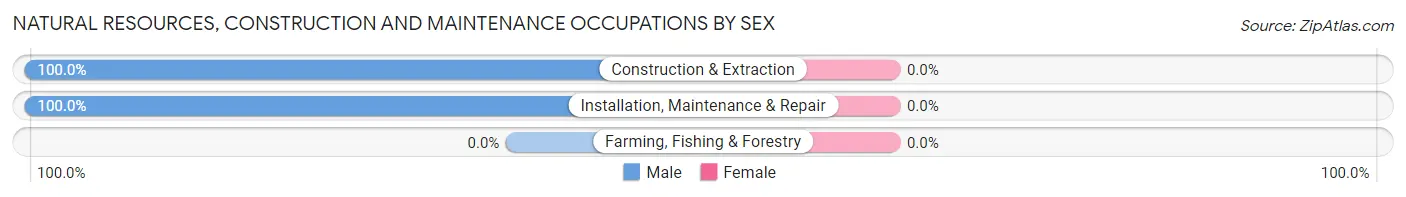
| Occupation | Male | Female |
| Farming, Fishing & Forestry | 0 (0.0%) | 0 (0.0%) |
| Construction & Extraction | 2 (100.0%) | 0 (0.0%) |
| Installation, Maintenance & Repair | 10 (100.0%) | 0 (0.0%) |
| Total (Category) | 12 (100.0%) | 0 (0.0%) |
| Total (Overall) | 129 (46.2%) | 150 (53.8%) |
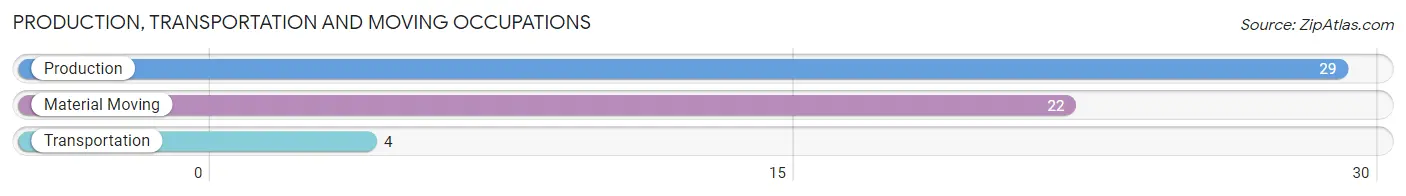
Production, Transportation and Moving Occupations
The most common Production, Transportation and Moving occupations in Brownsville are Production (29 | 10.4%), Material Moving (22 | 7.9%), and Transportation (4 | 1.4%).
Production, Transportation and Moving Occupations by Sex
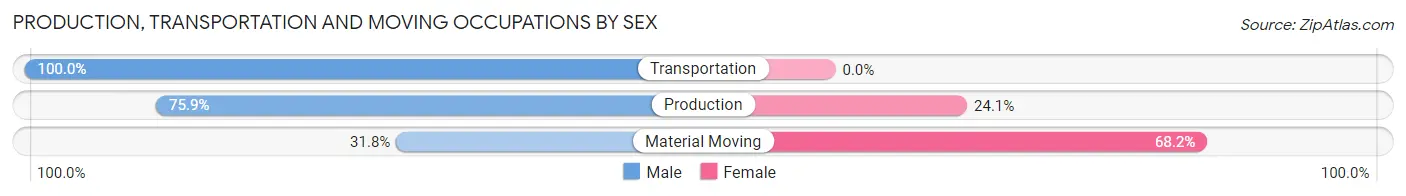
| Occupation | Male | Female |
| Production | 22 (75.9%) | 7 (24.1%) |
| Transportation | 4 (100.0%) | 0 (0.0%) |
| Material Moving | 7 (31.8%) | 15 (68.2%) |
| Total (Category) | 33 (60.0%) | 22 (40.0%) |
| Total (Overall) | 129 (46.2%) | 150 (53.8%) |
Employment Industries by Sex in Brownsville
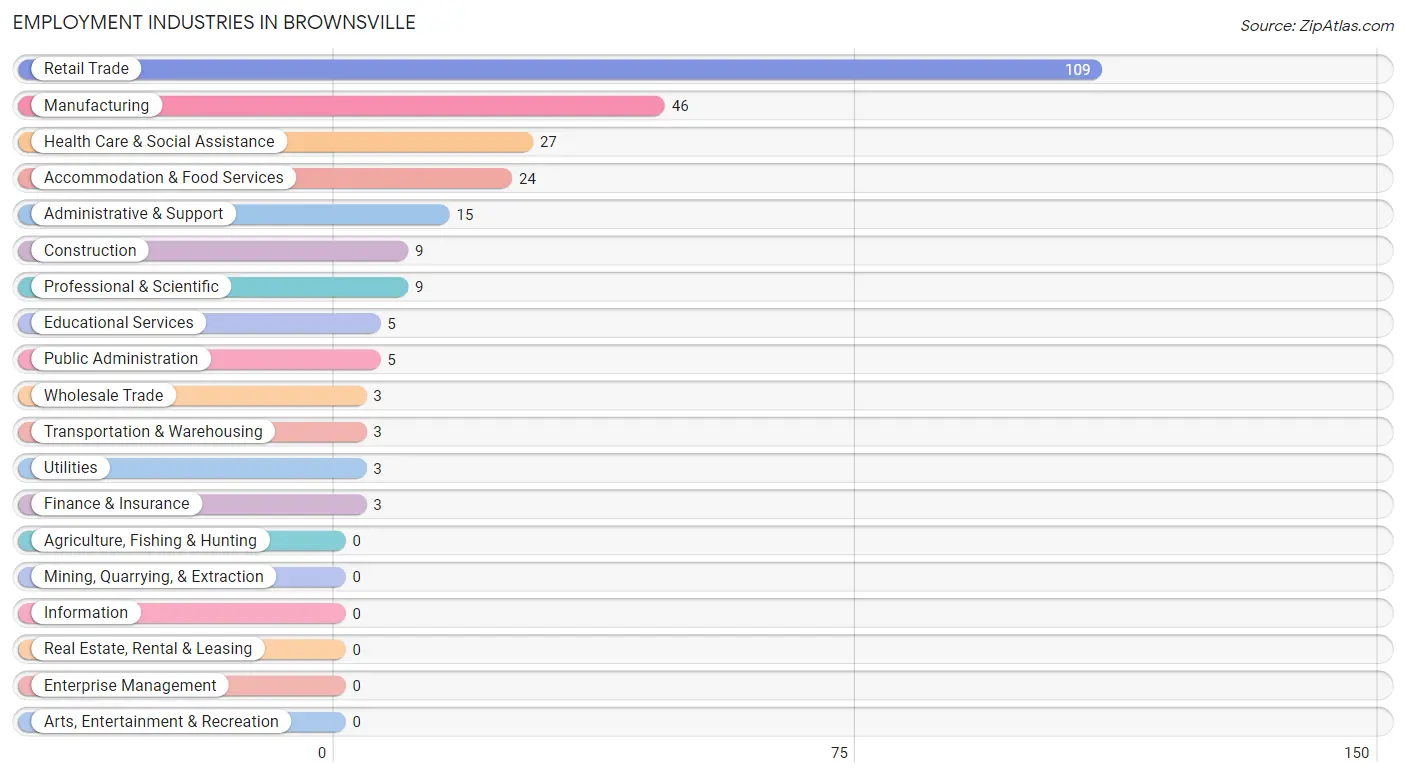
Employment Industries in Brownsville
The major employment industries in Brownsville include Retail Trade (109 | 39.1%), Manufacturing (46 | 16.5%), Health Care & Social Assistance (27 | 9.7%), Accommodation & Food Services (24 | 8.6%), and Administrative & Support (15 | 5.4%).
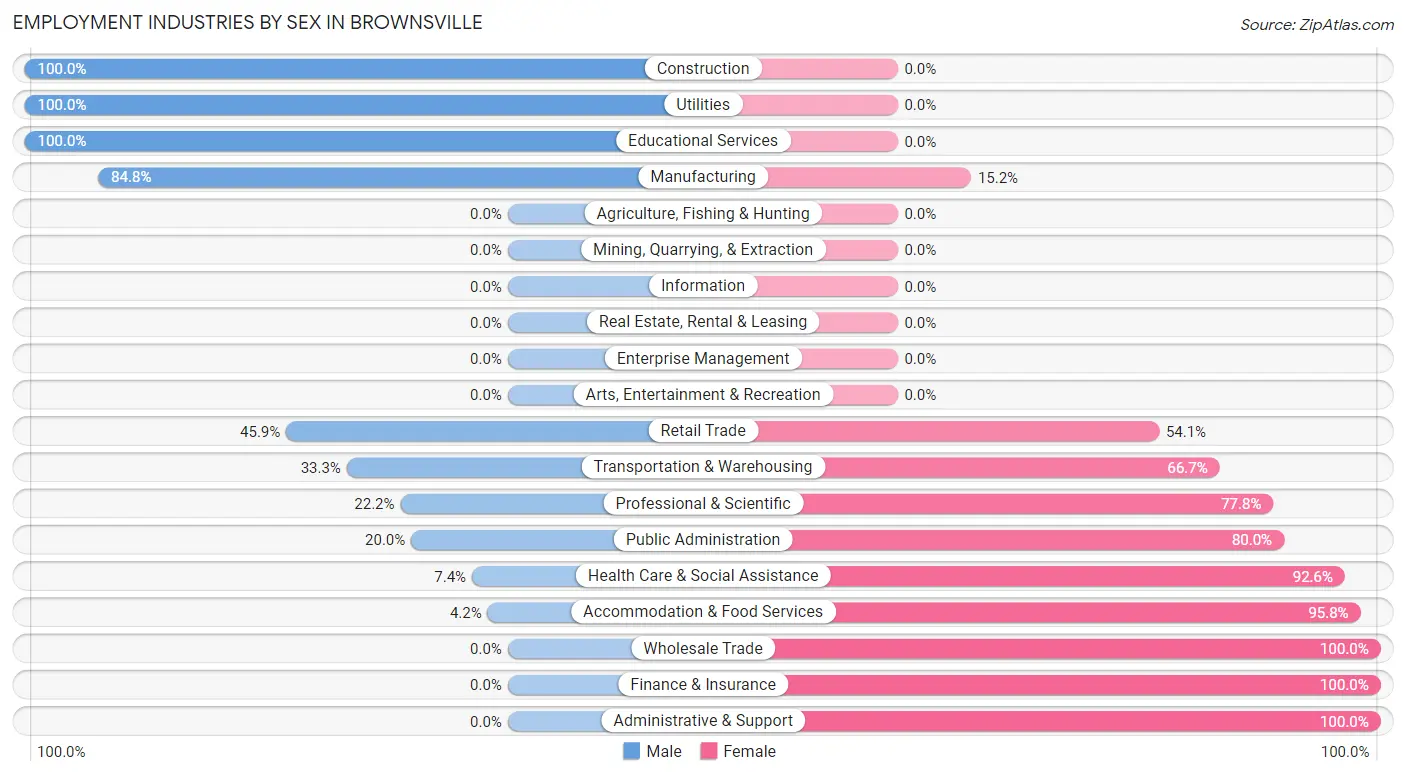
Employment Industries by Sex in Brownsville
The Brownsville industries that see more men than women are Construction (100.0%), Utilities (100.0%), and Educational Services (100.0%), whereas the industries that tend to have a higher number of women are Wholesale Trade (100.0%), Finance & Insurance (100.0%), and Administrative & Support (100.0%).
| Industry | Male | Female |
| Agriculture, Fishing & Hunting | 0 (0.0%) | 0 (0.0%) |
| Mining, Quarrying, & Extraction | 0 (0.0%) | 0 (0.0%) |
| Construction | 9 (100.0%) | 0 (0.0%) |
| Manufacturing | 39 (84.8%) | 7 (15.2%) |
| Wholesale Trade | 0 (0.0%) | 3 (100.0%) |
| Retail Trade | 50 (45.9%) | 59 (54.1%) |
| Transportation & Warehousing | 1 (33.3%) | 2 (66.7%) |
| Utilities | 3 (100.0%) | 0 (0.0%) |
| Information | 0 (0.0%) | 0 (0.0%) |
| Finance & Insurance | 0 (0.0%) | 3 (100.0%) |
| Real Estate, Rental & Leasing | 0 (0.0%) | 0 (0.0%) |
| Professional & Scientific | 2 (22.2%) | 7 (77.8%) |
| Enterprise Management | 0 (0.0%) | 0 (0.0%) |
| Administrative & Support | 0 (0.0%) | 15 (100.0%) |
| Educational Services | 5 (100.0%) | 0 (0.0%) |
| Health Care & Social Assistance | 2 (7.4%) | 25 (92.6%) |
| Arts, Entertainment & Recreation | 0 (0.0%) | 0 (0.0%) |
| Accommodation & Food Services | 1 (4.2%) | 23 (95.8%) |
| Public Administration | 1 (20.0%) | 4 (80.0%) |
| Total | 129 (46.2%) | 150 (53.8%) |
Education in Brownsville
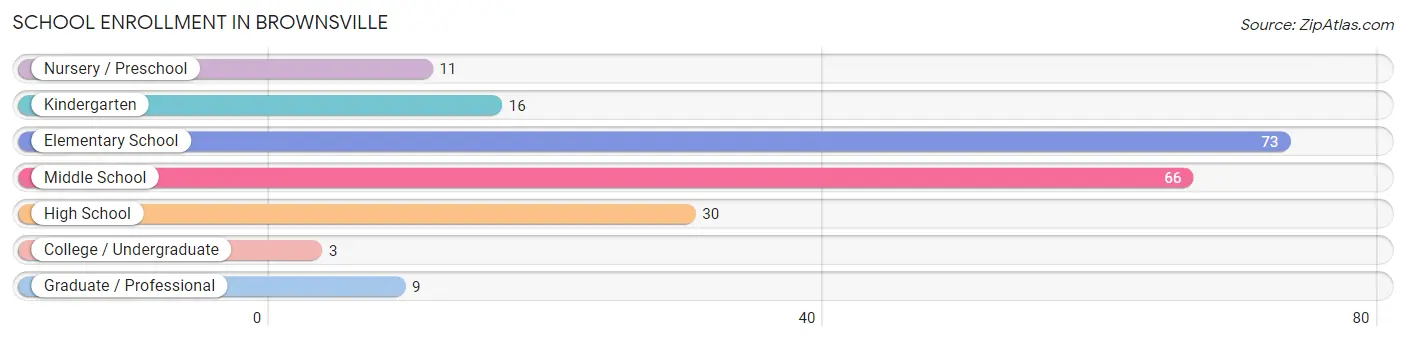
School Enrollment in Brownsville
The most common levels of schooling among the 208 students in Brownsville are elementary school (73 | 35.1%), middle school (66 | 31.7%), and high school (30 | 14.4%).
| School Level | # Students | % Students |
| Nursery / Preschool | 11 | 5.3% |
| Kindergarten | 16 | 7.7% |
| Elementary School | 73 | 35.1% |
| Middle School | 66 | 31.7% |
| High School | 30 | 14.4% |
| College / Undergraduate | 3 | 1.4% |
| Graduate / Professional | 9 | 4.3% |
| Total | 208 | 100.0% |
School Enrollment by Age by Funding Source in Brownsville
Out of a total of 208 students who are enrolled in schools in Brownsville, 106 (51.0%) attend a private institution, while the remaining 102 (49.0%) are enrolled in public schools. The age group of 25 to 34 year olds has the highest likelihood of being enrolled in private schools, with 4 (66.7% in the age bracket) enrolled. Conversely, the age group of 18 to 19 year olds has the lowest likelihood of being enrolled in a private school, with 7 (100.0% in the age bracket) attending a public institution.
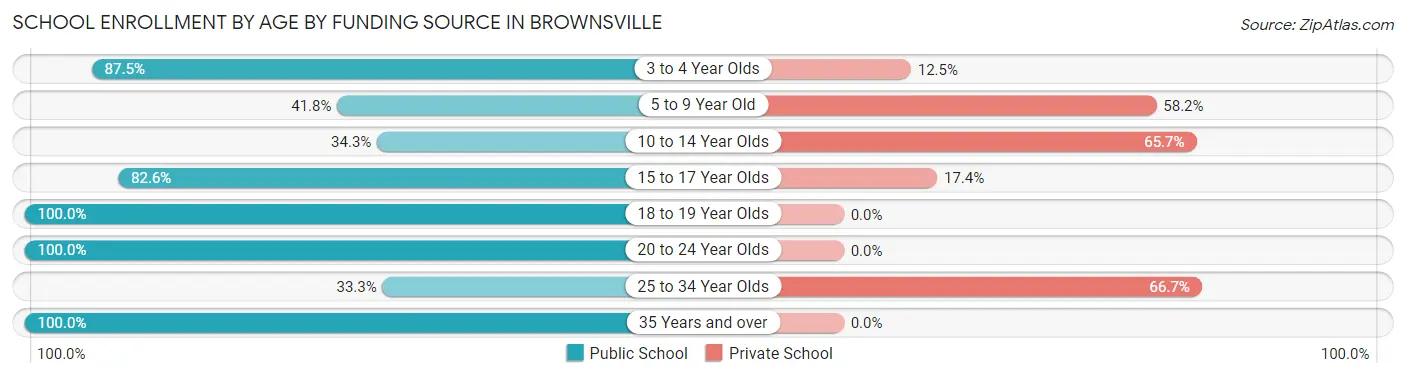
| Age Bracket | Public School | Private School |
| 3 to 4 Year Olds | 7 (87.5%) | 1 (12.5%) |
| 5 to 9 Year Old | 38 (41.8%) | 53 (58.2%) |
| 10 to 14 Year Olds | 23 (34.3%) | 44 (65.7%) |
| 15 to 17 Year Olds | 19 (82.6%) | 4 (17.4%) |
| 18 to 19 Year Olds | 7 (100.0%) | 0 (0.0%) |
| 20 to 24 Year Olds | 3 (100.0%) | 0 (0.0%) |
| 25 to 34 Year Olds | 2 (33.3%) | 4 (66.7%) |
| 35 Years and over | 3 (100.0%) | 0 (0.0%) |
| Total | 102 (49.0%) | 106 (51.0%) |
Educational Attainment by Field of Study in Brownsville
Education (25 | 39.1%), business (13 | 20.3%), science & technology (7 | 10.9%), arts & humanities (6 | 9.4%), and bio, nature & agricultural (5 | 7.8%) are the most common fields of study among 64 individuals in Brownsville who have obtained a bachelor's degree or higher.
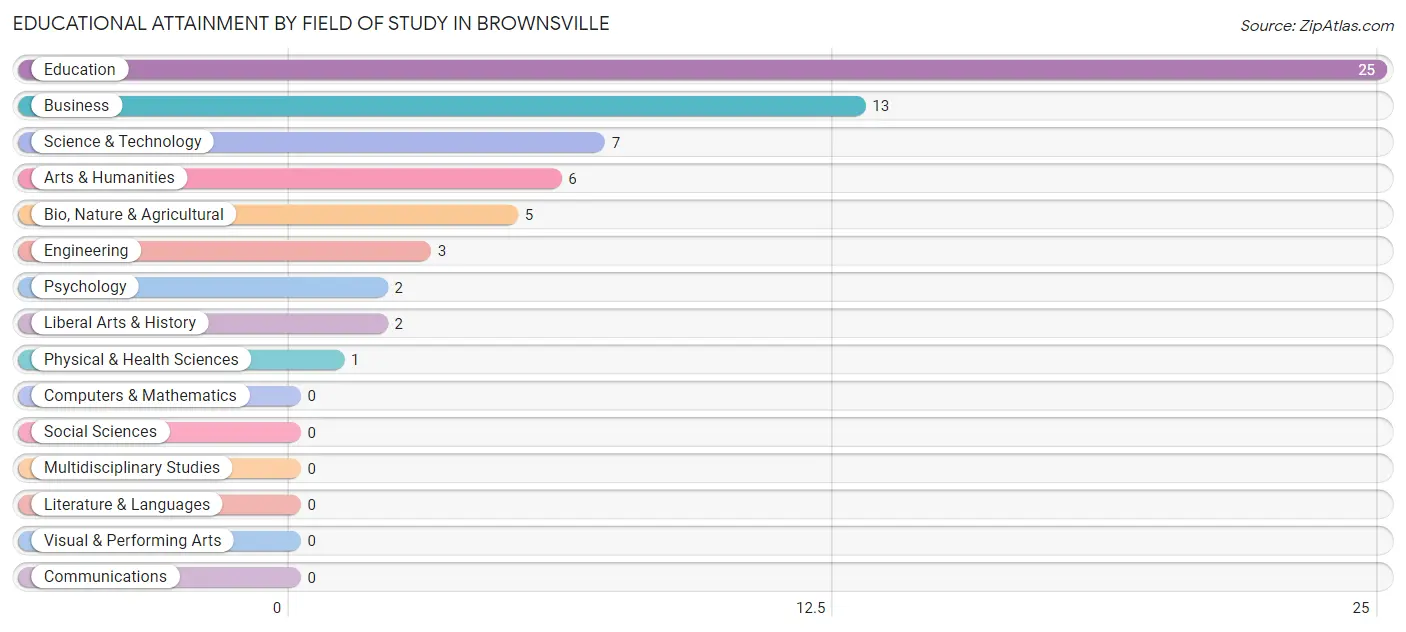
| Field of Study | # Graduates | % Graduates |
| Computers & Mathematics | 0 | 0.0% |
| Bio, Nature & Agricultural | 5 | 7.8% |
| Physical & Health Sciences | 1 | 1.6% |
| Psychology | 2 | 3.1% |
| Social Sciences | 0 | 0.0% |
| Engineering | 3 | 4.7% |
| Multidisciplinary Studies | 0 | 0.0% |
| Science & Technology | 7 | 10.9% |
| Business | 13 | 20.3% |
| Education | 25 | 39.1% |
| Literature & Languages | 0 | 0.0% |
| Liberal Arts & History | 2 | 3.1% |
| Visual & Performing Arts | 0 | 0.0% |
| Communications | 0 | 0.0% |
| Arts & Humanities | 6 | 9.4% |
| Total | 64 | 100.0% |
Transportation & Commute in Brownsville
Vehicle Availability by Sex in Brownsville
The most prevalent vehicle ownership categories in Brownsville are males with 2 vehicles (47, accounting for 36.7%) and females with 2 vehicles (35, making up 32.9%).
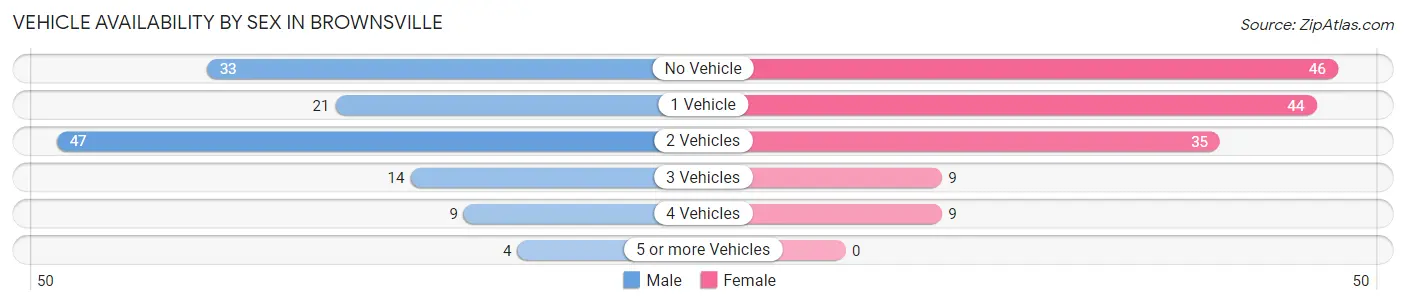
| Vehicles Available | Male | Female |
| No Vehicle | 33 (25.8%) | 46 (32.2%) |
| 1 Vehicle | 21 (16.4%) | 44 (30.8%) |
| 2 Vehicles | 47 (36.7%) | 35 (24.5%) |
| 3 Vehicles | 14 (10.9%) | 9 (6.3%) |
| 4 Vehicles | 9 (7.0%) | 9 (6.3%) |
| 5 or more Vehicles | 4 (3.1%) | 0 (0.0%) |
| Total | 128 (100.0%) | 143 (100.0%) |
Commute Time in Brownsville
The most frequently occuring commute durations in Brownsville are less than 5 minutes (107 commuters, 39.5%), 5 to 9 minutes (31 commuters, 11.4%), and 45 to 59 minutes (31 commuters, 11.4%).
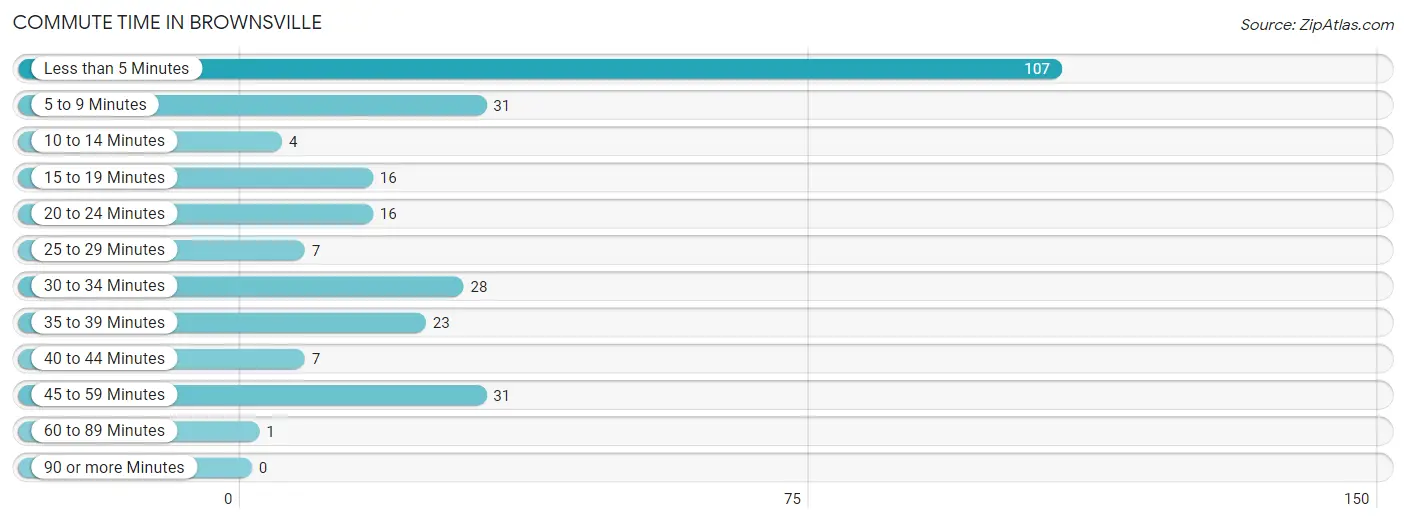
| Commute Time | # Commuters | % Commuters |
| Less than 5 Minutes | 107 | 39.5% |
| 5 to 9 Minutes | 31 | 11.4% |
| 10 to 14 Minutes | 4 | 1.5% |
| 15 to 19 Minutes | 16 | 5.9% |
| 20 to 24 Minutes | 16 | 5.9% |
| 25 to 29 Minutes | 7 | 2.6% |
| 30 to 34 Minutes | 28 | 10.3% |
| 35 to 39 Minutes | 23 | 8.5% |
| 40 to 44 Minutes | 7 | 2.6% |
| 45 to 59 Minutes | 31 | 11.4% |
| 60 to 89 Minutes | 1 | 0.4% |
| 90 or more Minutes | 0 | 0.0% |
Commute Time by Sex in Brownsville
The most common commute times in Brownsville are less than 5 minutes (38 commuters, 29.7%) for males and less than 5 minutes (69 commuters, 48.2%) for females.
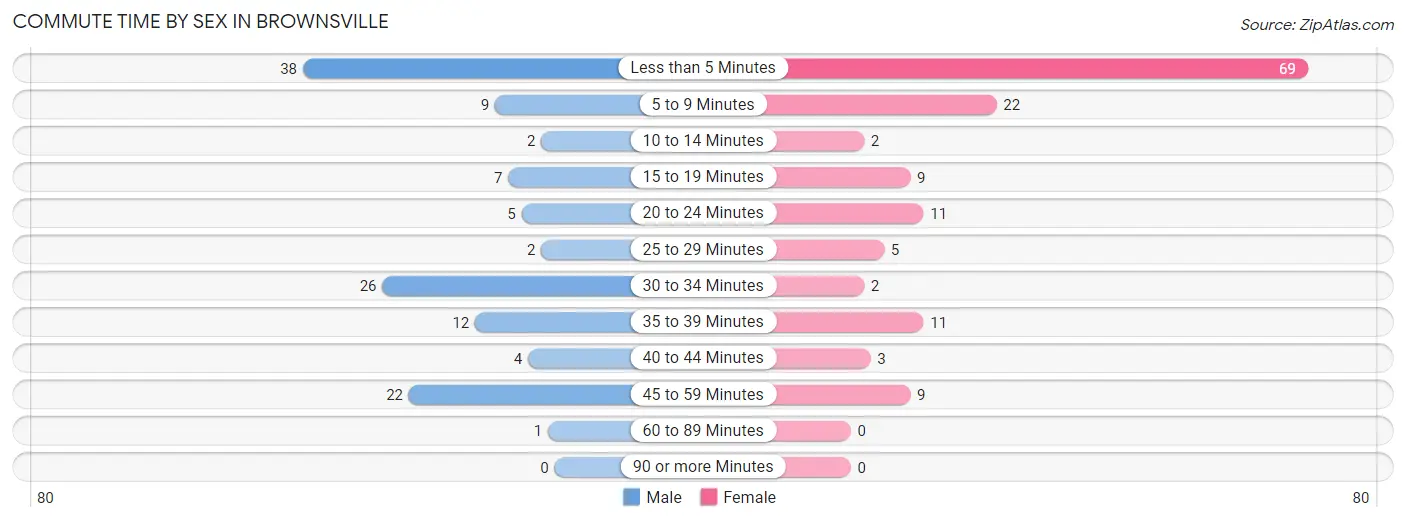
| Commute Time | Male | Female |
| Less than 5 Minutes | 38 (29.7%) | 69 (48.2%) |
| 5 to 9 Minutes | 9 (7.0%) | 22 (15.4%) |
| 10 to 14 Minutes | 2 (1.6%) | 2 (1.4%) |
| 15 to 19 Minutes | 7 (5.5%) | 9 (6.3%) |
| 20 to 24 Minutes | 5 (3.9%) | 11 (7.7%) |
| 25 to 29 Minutes | 2 (1.6%) | 5 (3.5%) |
| 30 to 34 Minutes | 26 (20.3%) | 2 (1.4%) |
| 35 to 39 Minutes | 12 (9.4%) | 11 (7.7%) |
| 40 to 44 Minutes | 4 (3.1%) | 3 (2.1%) |
| 45 to 59 Minutes | 22 (17.2%) | 9 (6.3%) |
| 60 to 89 Minutes | 1 (0.8%) | 0 (0.0%) |
| 90 or more Minutes | 0 (0.0%) | 0 (0.0%) |
Time of Departure to Work by Sex in Brownsville
The most frequent times of departure to work in Brownsville are 10:00 AM to 10:59 AM (33, 25.8%) for males and 6:30 AM to 6:59 AM (40, 28.0%) for females.
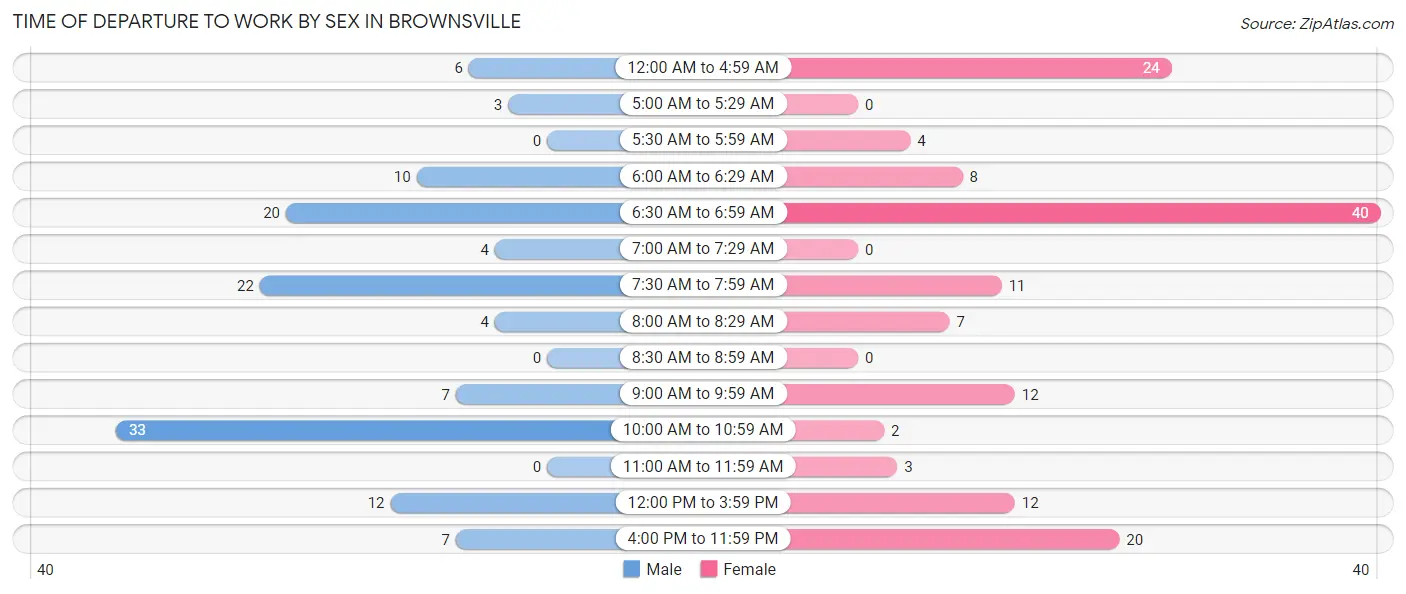
| Time of Departure | Male | Female |
| 12:00 AM to 4:59 AM | 6 (4.7%) | 24 (16.8%) |
| 5:00 AM to 5:29 AM | 3 (2.3%) | 0 (0.0%) |
| 5:30 AM to 5:59 AM | 0 (0.0%) | 4 (2.8%) |
| 6:00 AM to 6:29 AM | 10 (7.8%) | 8 (5.6%) |
| 6:30 AM to 6:59 AM | 20 (15.6%) | 40 (28.0%) |
| 7:00 AM to 7:29 AM | 4 (3.1%) | 0 (0.0%) |
| 7:30 AM to 7:59 AM | 22 (17.2%) | 11 (7.7%) |
| 8:00 AM to 8:29 AM | 4 (3.1%) | 7 (4.9%) |
| 8:30 AM to 8:59 AM | 0 (0.0%) | 0 (0.0%) |
| 9:00 AM to 9:59 AM | 7 (5.5%) | 12 (8.4%) |
| 10:00 AM to 10:59 AM | 33 (25.8%) | 2 (1.4%) |
| 11:00 AM to 11:59 AM | 0 (0.0%) | 3 (2.1%) |
| 12:00 PM to 3:59 PM | 12 (9.4%) | 12 (8.4%) |
| 4:00 PM to 11:59 PM | 7 (5.5%) | 20 (14.0%) |
| Total | 128 (100.0%) | 143 (100.0%) |
Housing Occupancy in Brownsville
Occupancy by Ownership in Brownsville
Of the total 341 dwellings in Brownsville, owner-occupied units account for 163 (47.8%), while renter-occupied units make up 178 (52.2%).
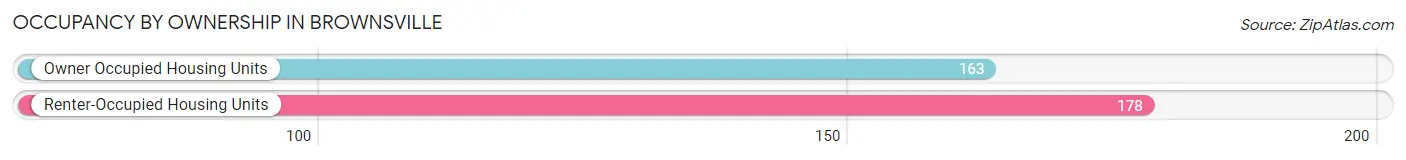
| Occupancy | # Housing Units | % Housing Units |
| Owner Occupied Housing Units | 163 | 47.8% |
| Renter-Occupied Housing Units | 178 | 52.2% |
| Total Occupied Housing Units | 341 | 100.0% |
Occupancy by Household Size in Brownsville
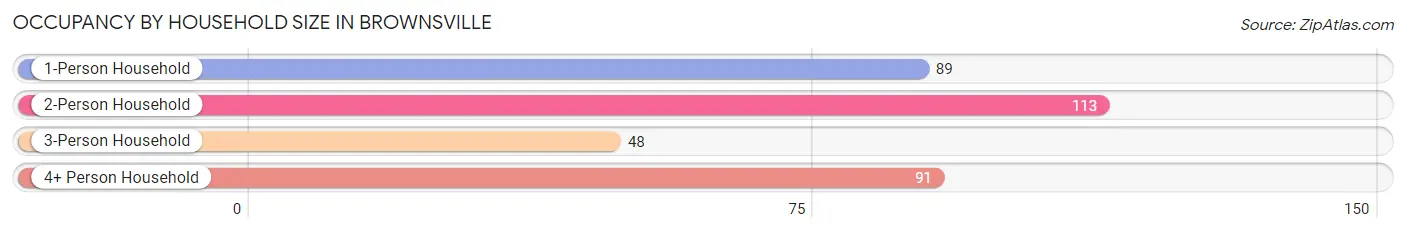
| Household Size | # Housing Units | % Housing Units |
| 1-Person Household | 89 | 26.1% |
| 2-Person Household | 113 | 33.1% |
| 3-Person Household | 48 | 14.1% |
| 4+ Person Household | 91 | 26.7% |
| Total Housing Units | 341 | 100.0% |
Occupancy by Ownership by Household Size in Brownsville
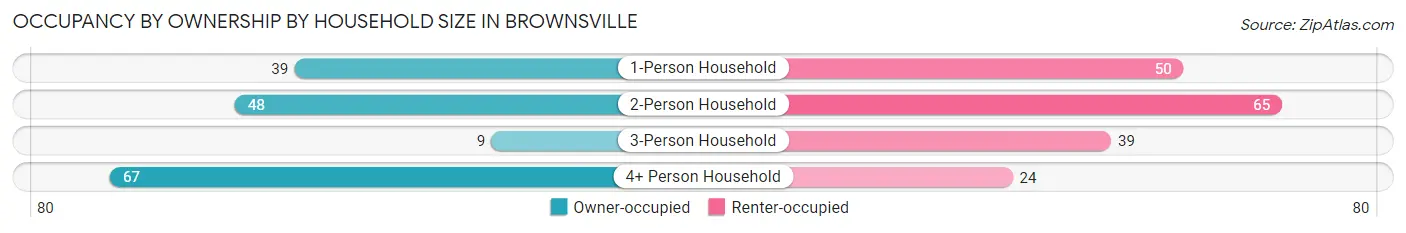
| Household Size | Owner-occupied | Renter-occupied |
| 1-Person Household | 39 (43.8%) | 50 (56.2%) |
| 2-Person Household | 48 (42.5%) | 65 (57.5%) |
| 3-Person Household | 9 (18.8%) | 39 (81.2%) |
| 4+ Person Household | 67 (73.6%) | 24 (26.4%) |
| Total Housing Units | 163 (47.8%) | 178 (52.2%) |
Occupancy by Educational Attainment in Brownsville
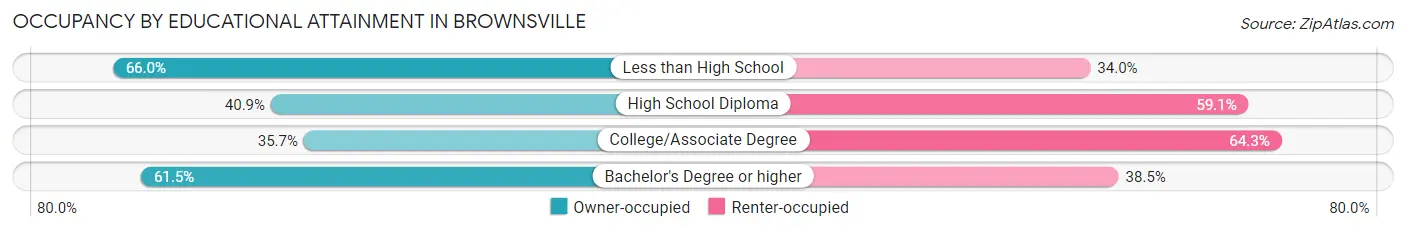
| Household Size | Owner-occupied | Renter-occupied |
| Less than High School | 68 (66.0%) | 35 (34.0%) |
| High School Diploma | 52 (40.9%) | 75 (59.1%) |
| College/Associate Degree | 35 (35.7%) | 63 (64.3%) |
| Bachelor's Degree or higher | 8 (61.5%) | 5 (38.5%) |
Occupancy by Age of Householder in Brownsville
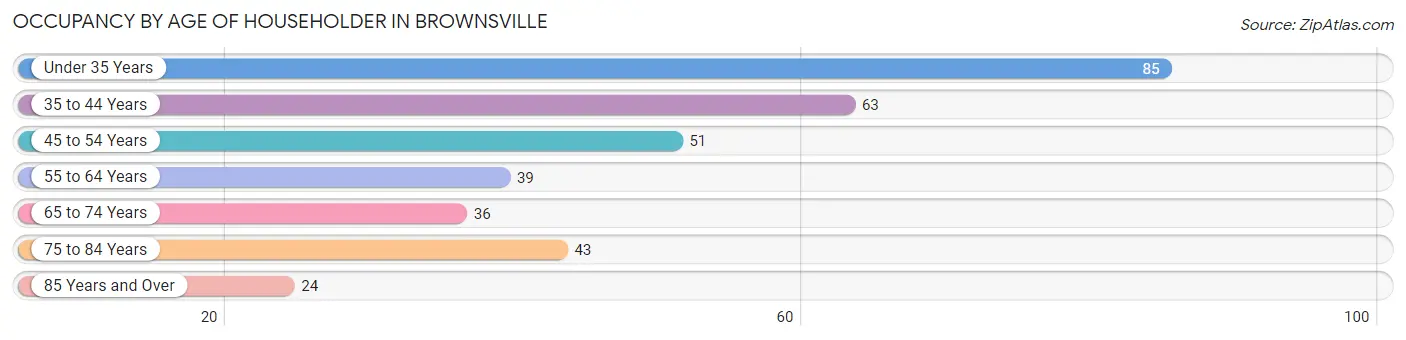
| Age Bracket | # Households | % Households |
| Under 35 Years | 85 | 24.9% |
| 35 to 44 Years | 63 | 18.5% |
| 45 to 54 Years | 51 | 15.0% |
| 55 to 64 Years | 39 | 11.4% |
| 65 to 74 Years | 36 | 10.6% |
| 75 to 84 Years | 43 | 12.6% |
| 85 Years and Over | 24 | 7.0% |
| Total | 341 | 100.0% |
Housing Finances in Brownsville
Median Income by Occupancy in Brownsville
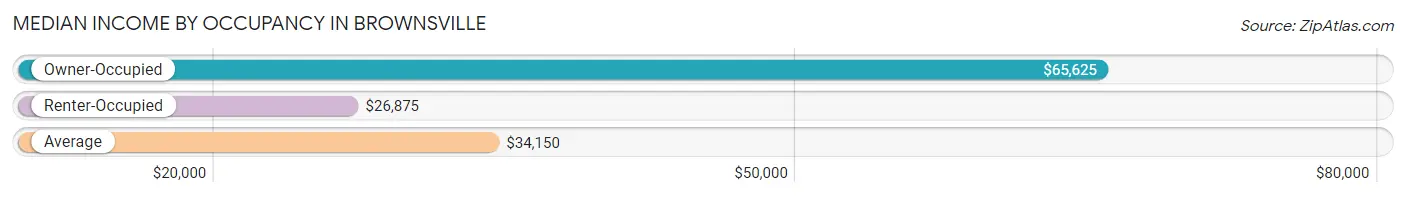
| Occupancy Type | # Households | Median Income |
| Owner-Occupied | 163 (47.8%) | $65,625 |
| Renter-Occupied | 178 (52.2%) | $26,875 |
| Average | 341 (100.0%) | $34,150 |
Occupancy by Householder Income Bracket in Brownsville
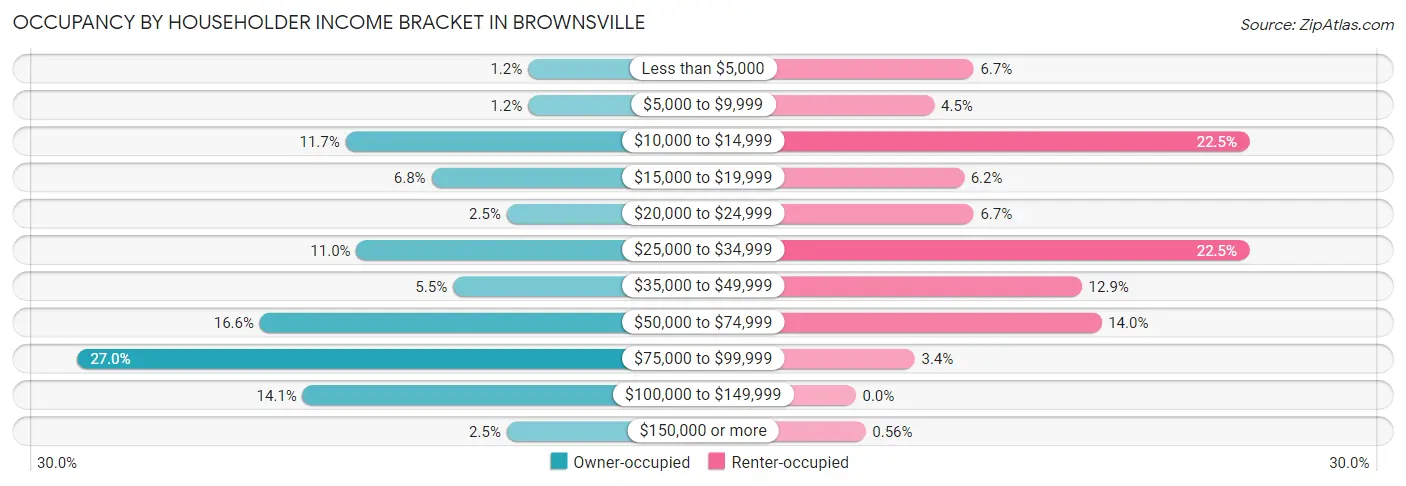
| Income Bracket | Owner-occupied | Renter-occupied |
| Less than $5,000 | 2 (1.2%) | 12 (6.7%) |
| $5,000 to $9,999 | 2 (1.2%) | 8 (4.5%) |
| $10,000 to $14,999 | 19 (11.7%) | 40 (22.5%) |
| $15,000 to $19,999 | 11 (6.8%) | 11 (6.2%) |
| $20,000 to $24,999 | 4 (2.5%) | 12 (6.7%) |
| $25,000 to $34,999 | 18 (11.0%) | 40 (22.5%) |
| $35,000 to $49,999 | 9 (5.5%) | 23 (12.9%) |
| $50,000 to $74,999 | 27 (16.6%) | 25 (14.0%) |
| $75,000 to $99,999 | 44 (27.0%) | 6 (3.4%) |
| $100,000 to $149,999 | 23 (14.1%) | 0 (0.0%) |
| $150,000 or more | 4 (2.5%) | 1 (0.6%) |
| Total | 163 (100.0%) | 178 (100.0%) |
Monthly Housing Cost Tiers in Brownsville
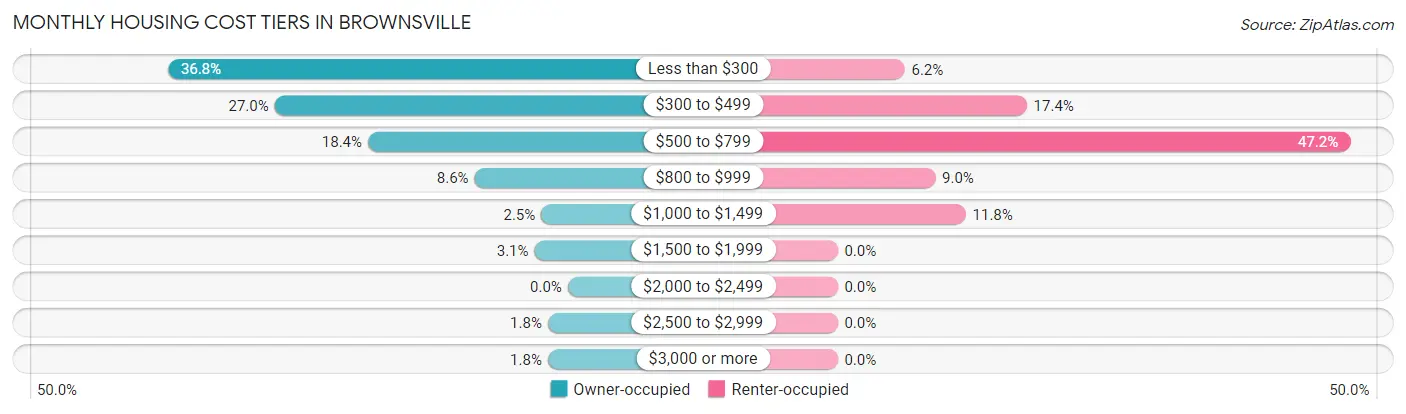
| Monthly Cost | Owner-occupied | Renter-occupied |
| Less than $300 | 60 (36.8%) | 11 (6.2%) |
| $300 to $499 | 44 (27.0%) | 31 (17.4%) |
| $500 to $799 | 30 (18.4%) | 84 (47.2%) |
| $800 to $999 | 14 (8.6%) | 16 (9.0%) |
| $1,000 to $1,499 | 4 (2.5%) | 21 (11.8%) |
| $1,500 to $1,999 | 5 (3.1%) | 0 (0.0%) |
| $2,000 to $2,499 | 0 (0.0%) | 0 (0.0%) |
| $2,500 to $2,999 | 3 (1.8%) | 0 (0.0%) |
| $3,000 or more | 3 (1.8%) | 0 (0.0%) |
| Total | 163 (100.0%) | 178 (100.0%) |
Physical Housing Characteristics in Brownsville
Housing Structures in Brownsville
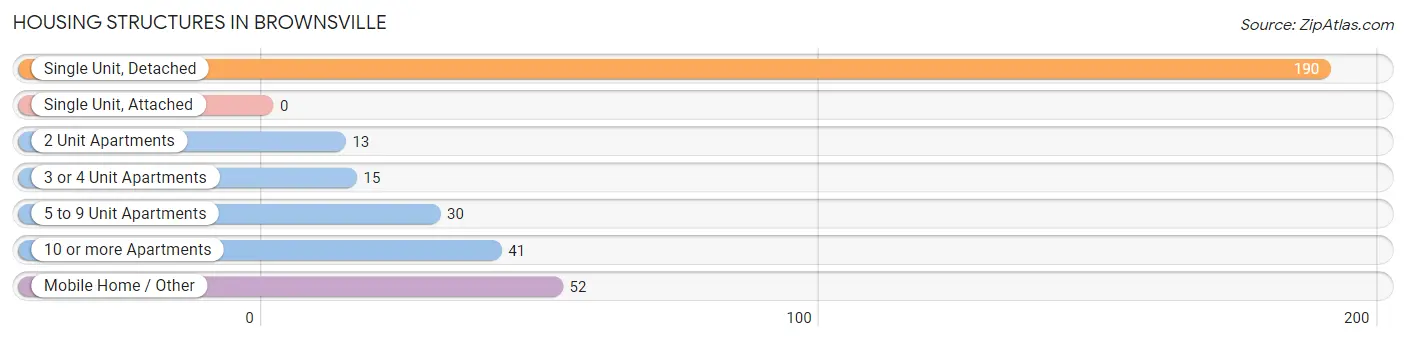
| Structure Type | # Housing Units | % Housing Units |
| Single Unit, Detached | 190 | 55.7% |
| Single Unit, Attached | 0 | 0.0% |
| 2 Unit Apartments | 13 | 3.8% |
| 3 or 4 Unit Apartments | 15 | 4.4% |
| 5 to 9 Unit Apartments | 30 | 8.8% |
| 10 or more Apartments | 41 | 12.0% |
| Mobile Home / Other | 52 | 15.2% |
| Total | 341 | 100.0% |
Housing Structures by Occupancy in Brownsville
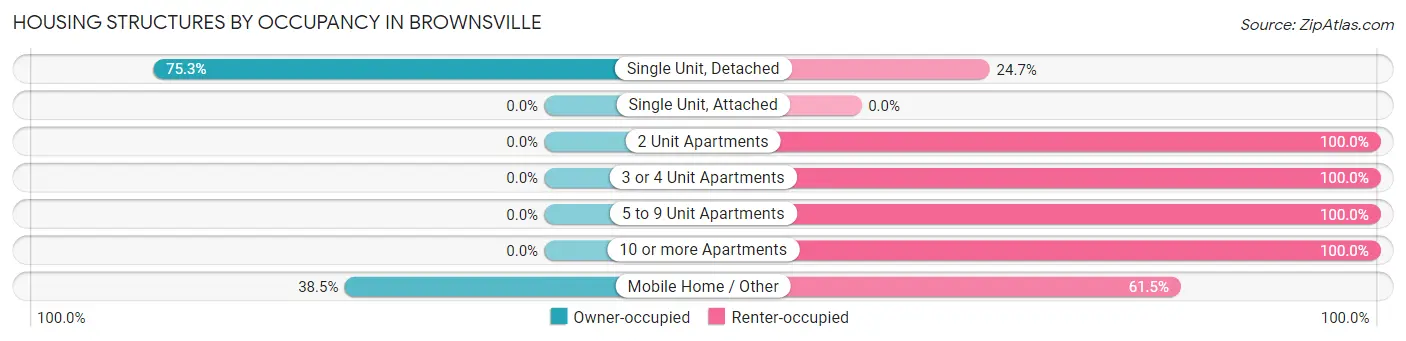
| Structure Type | Owner-occupied | Renter-occupied |
| Single Unit, Detached | 143 (75.3%) | 47 (24.7%) |
| Single Unit, Attached | 0 (0.0%) | 0 (0.0%) |
| 2 Unit Apartments | 0 (0.0%) | 13 (100.0%) |
| 3 or 4 Unit Apartments | 0 (0.0%) | 15 (100.0%) |
| 5 to 9 Unit Apartments | 0 (0.0%) | 30 (100.0%) |
| 10 or more Apartments | 0 (0.0%) | 41 (100.0%) |
| Mobile Home / Other | 20 (38.5%) | 32 (61.5%) |
| Total | 163 (47.8%) | 178 (52.2%) |
Housing Structures by Number of Rooms in Brownsville
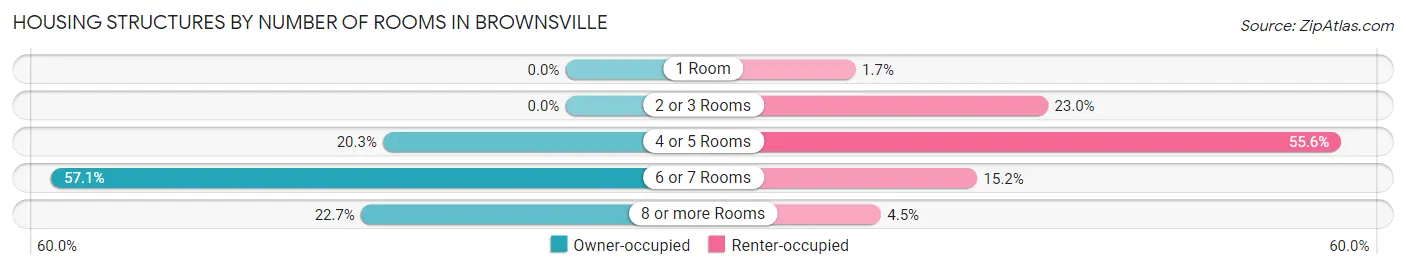
| Number of Rooms | Owner-occupied | Renter-occupied |
| 1 Room | 0 (0.0%) | 3 (1.7%) |
| 2 or 3 Rooms | 0 (0.0%) | 41 (23.0%) |
| 4 or 5 Rooms | 33 (20.3%) | 99 (55.6%) |
| 6 or 7 Rooms | 93 (57.1%) | 27 (15.2%) |
| 8 or more Rooms | 37 (22.7%) | 8 (4.5%) |
| Total | 163 (100.0%) | 178 (100.0%) |
Housing Structure by Heating Type in Brownsville
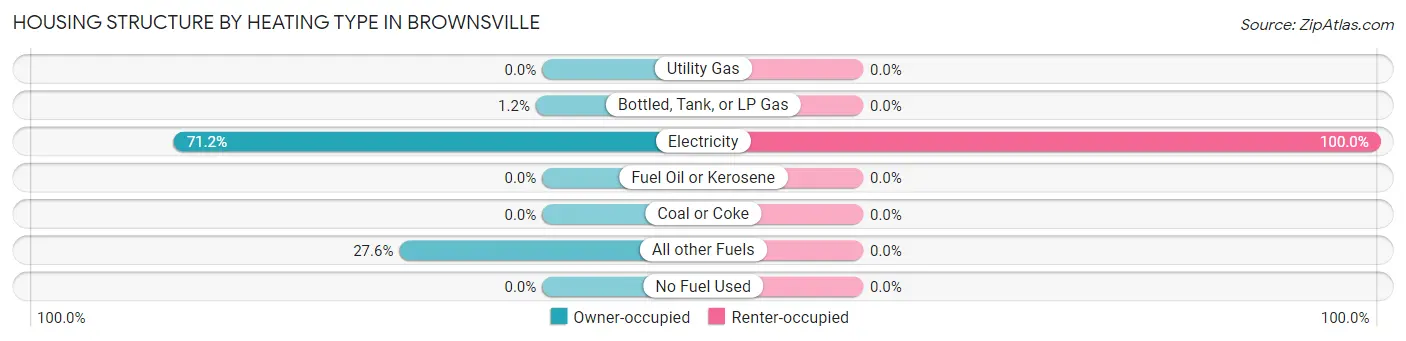
| Heating Type | Owner-occupied | Renter-occupied |
| Utility Gas | 0 (0.0%) | 0 (0.0%) |
| Bottled, Tank, or LP Gas | 2 (1.2%) | 0 (0.0%) |
| Electricity | 116 (71.2%) | 178 (100.0%) |
| Fuel Oil or Kerosene | 0 (0.0%) | 0 (0.0%) |
| Coal or Coke | 0 (0.0%) | 0 (0.0%) |
| All other Fuels | 45 (27.6%) | 0 (0.0%) |
| No Fuel Used | 0 (0.0%) | 0 (0.0%) |
| Total | 163 (100.0%) | 178 (100.0%) |
Household Vehicle Usage in Brownsville
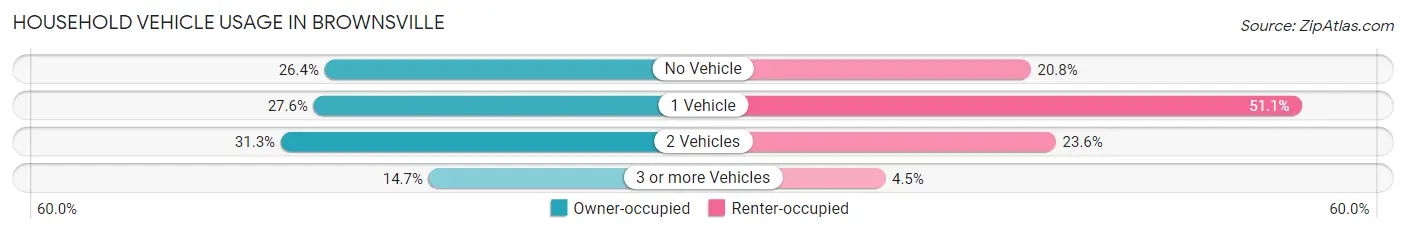
| Vehicles per Household | Owner-occupied | Renter-occupied |
| No Vehicle | 43 (26.4%) | 37 (20.8%) |
| 1 Vehicle | 45 (27.6%) | 91 (51.1%) |
| 2 Vehicles | 51 (31.3%) | 42 (23.6%) |
| 3 or more Vehicles | 24 (14.7%) | 8 (4.5%) |
| Total | 163 (100.0%) | 178 (100.0%) |
Real Estate & Mortgages in Brownsville
Real Estate and Mortgage Overview in Brownsville
| Characteristic | Without Mortgage | With Mortgage |
| Housing Units | 123 | 40 |
| Median Property Value | $213,900 | $110,000 |
| Median Household Income | - | - |
| Monthly Housing Costs | $307 | $3 |
| Real Estate Taxes | $827 | $2 |
Property Value by Mortgage Status in Brownsville
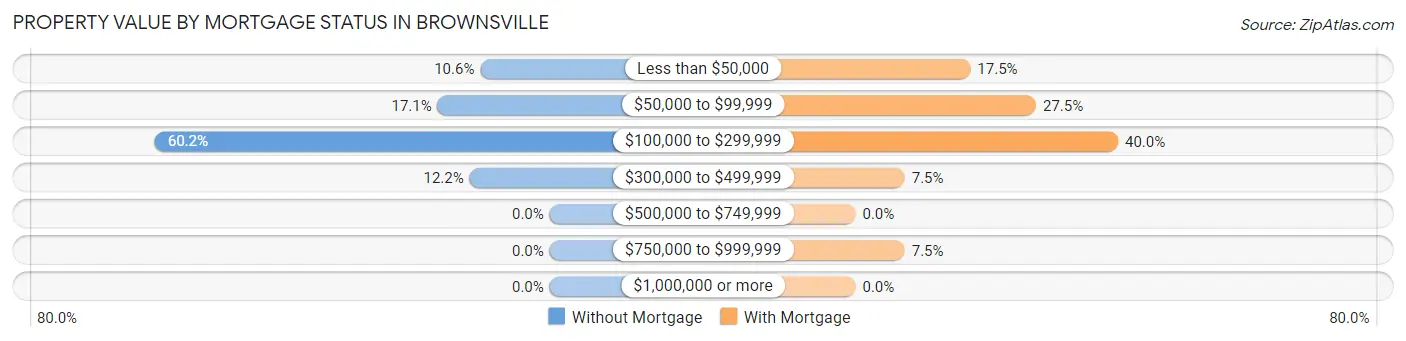
| Property Value | Without Mortgage | With Mortgage |
| Less than $50,000 | 13 (10.6%) | 7 (17.5%) |
| $50,000 to $99,999 | 21 (17.1%) | 11 (27.5%) |
| $100,000 to $299,999 | 74 (60.2%) | 16 (40.0%) |
| $300,000 to $499,999 | 15 (12.2%) | 3 (7.5%) |
| $500,000 to $749,999 | 0 (0.0%) | 0 (0.0%) |
| $750,000 to $999,999 | 0 (0.0%) | 3 (7.5%) |
| $1,000,000 or more | 0 (0.0%) | 0 (0.0%) |
| Total | 123 (100.0%) | 40 (100.0%) |
Household Income by Mortgage Status in Brownsville
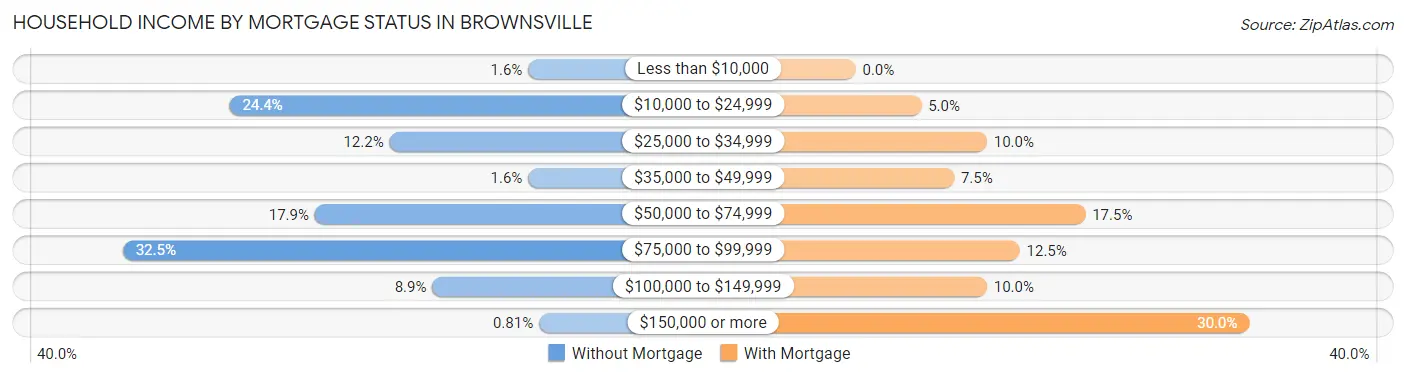
| Household Income | Without Mortgage | With Mortgage |
| Less than $10,000 | 2 (1.6%) | 0 (0.0%) |
| $10,000 to $24,999 | 30 (24.4%) | 2 (5.0%) |
| $25,000 to $34,999 | 15 (12.2%) | 4 (10.0%) |
| $35,000 to $49,999 | 2 (1.6%) | 3 (7.5%) |
| $50,000 to $74,999 | 22 (17.9%) | 7 (17.5%) |
| $75,000 to $99,999 | 40 (32.5%) | 5 (12.5%) |
| $100,000 to $149,999 | 11 (8.9%) | 4 (10.0%) |
| $150,000 or more | 1 (0.8%) | 12 (30.0%) |
| Total | 123 (100.0%) | 40 (100.0%) |
Property Value to Household Income Ratio in Brownsville
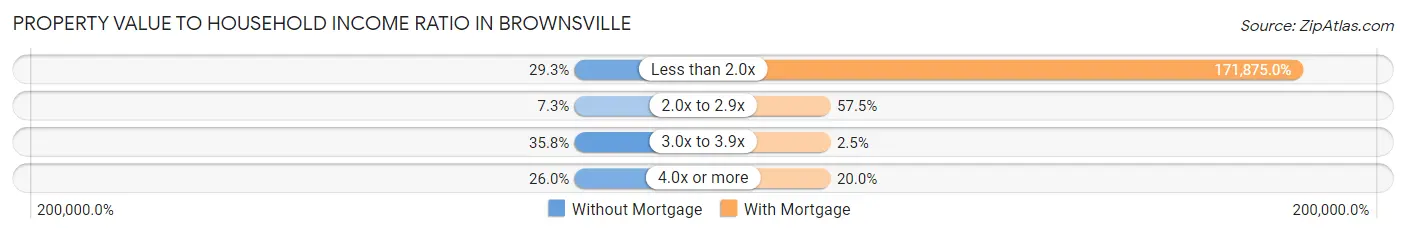
| Value-to-Income Ratio | Without Mortgage | With Mortgage |
| Less than 2.0x | 36 (29.3%) | 68,750 (171,875.0%) |
| 2.0x to 2.9x | 9 (7.3%) | 23 (57.5%) |
| 3.0x to 3.9x | 44 (35.8%) | 1 (2.5%) |
| 4.0x or more | 32 (26.0%) | 8 (20.0%) |
| Total | 123 (100.0%) | 40 (100.0%) |
Real Estate Taxes by Mortgage Status in Brownsville
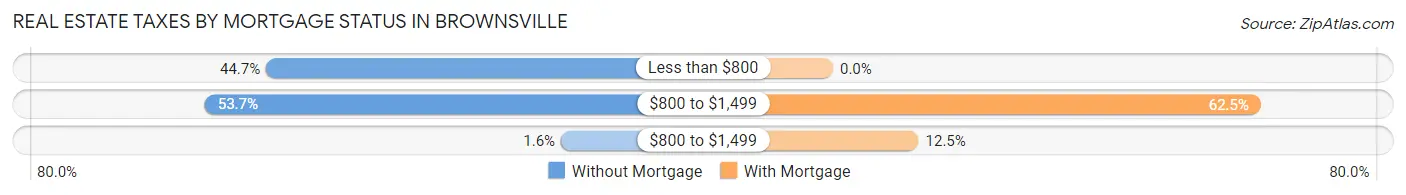
| Property Taxes | Without Mortgage | With Mortgage |
| Less than $800 | 55 (44.7%) | 0 (0.0%) |
| $800 to $1,499 | 66 (53.7%) | 25 (62.5%) |
| $800 to $1,499 | 2 (1.6%) | 5 (12.5%) |
| Total | 123 (100.0%) | 40 (100.0%) |
Health & Disability in Brownsville
Health Insurance Coverage by Age in Brownsville
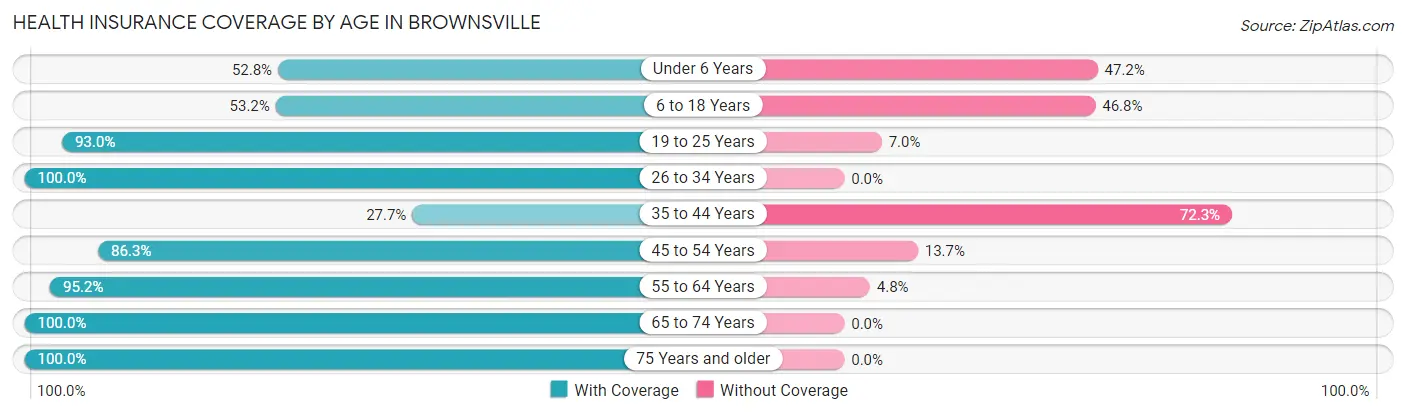
| Age Bracket | With Coverage | Without Coverage |
| Under 6 Years | 86 (52.8%) | 77 (47.2%) |
| 6 to 18 Years | 100 (53.2%) | 88 (46.8%) |
| 19 to 25 Years | 80 (93.0%) | 6 (7.0%) |
| 26 to 34 Years | 114 (100.0%) | 0 (0.0%) |
| 35 to 44 Years | 28 (27.7%) | 73 (72.3%) |
| 45 to 54 Years | 63 (86.3%) | 10 (13.7%) |
| 55 to 64 Years | 60 (95.2%) | 3 (4.8%) |
| 65 to 74 Years | 83 (100.0%) | 0 (0.0%) |
| 75 Years and older | 93 (100.0%) | 0 (0.0%) |
| Total | 707 (73.3%) | 257 (26.7%) |
Health Insurance Coverage by Citizenship Status in Brownsville
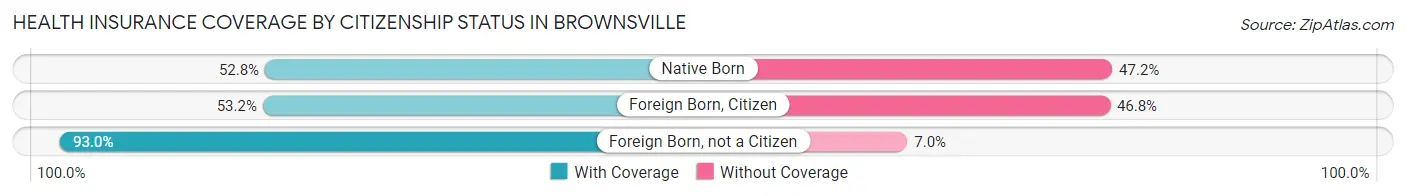
| Citizenship Status | With Coverage | Without Coverage |
| Native Born | 86 (52.8%) | 77 (47.2%) |
| Foreign Born, Citizen | 100 (53.2%) | 88 (46.8%) |
| Foreign Born, not a Citizen | 80 (93.0%) | 6 (7.0%) |
Health Insurance Coverage by Household Income in Brownsville
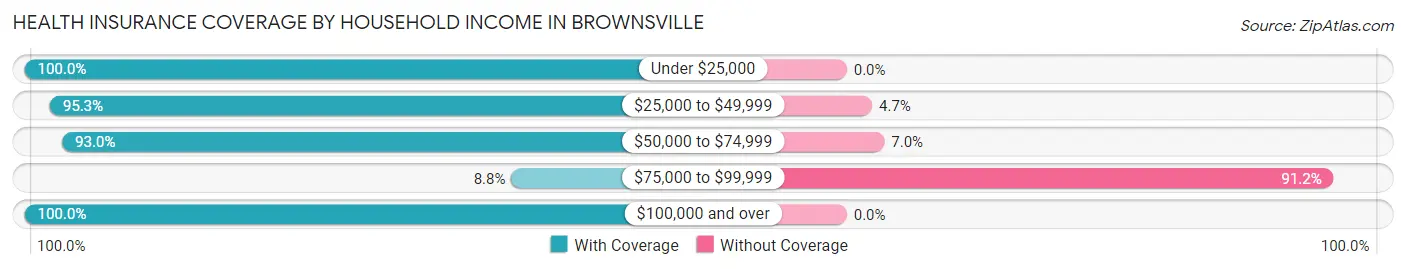
| Household Income | With Coverage | Without Coverage |
| Under $25,000 | 283 (100.0%) | 0 (0.0%) |
| $25,000 to $49,999 | 181 (95.3%) | 9 (4.7%) |
| $50,000 to $74,999 | 132 (93.0%) | 10 (7.0%) |
| $75,000 to $99,999 | 23 (8.8%) | 238 (91.2%) |
| $100,000 and over | 88 (100.0%) | 0 (0.0%) |
Public vs Private Health Insurance Coverage by Age in Brownsville
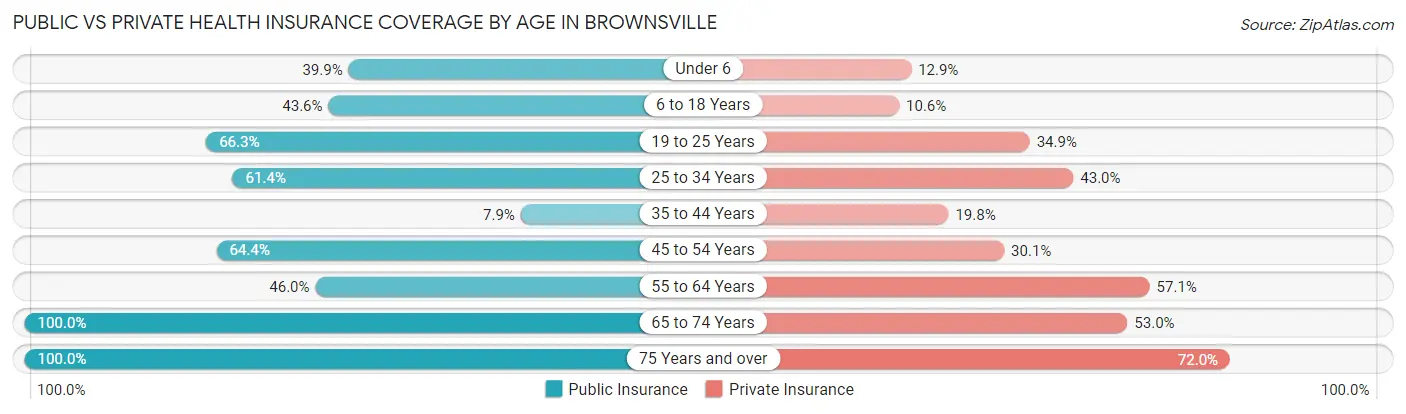
| Age Bracket | Public Insurance | Private Insurance |
| Under 6 | 65 (39.9%) | 21 (12.9%) |
| 6 to 18 Years | 82 (43.6%) | 20 (10.6%) |
| 19 to 25 Years | 57 (66.3%) | 30 (34.9%) |
| 25 to 34 Years | 70 (61.4%) | 49 (43.0%) |
| 35 to 44 Years | 8 (7.9%) | 20 (19.8%) |
| 45 to 54 Years | 47 (64.4%) | 22 (30.1%) |
| 55 to 64 Years | 29 (46.0%) | 36 (57.1%) |
| 65 to 74 Years | 83 (100.0%) | 44 (53.0%) |
| 75 Years and over | 93 (100.0%) | 67 (72.0%) |
| Total | 534 (55.4%) | 309 (32.1%) |
Disability Status by Sex by Age in Brownsville
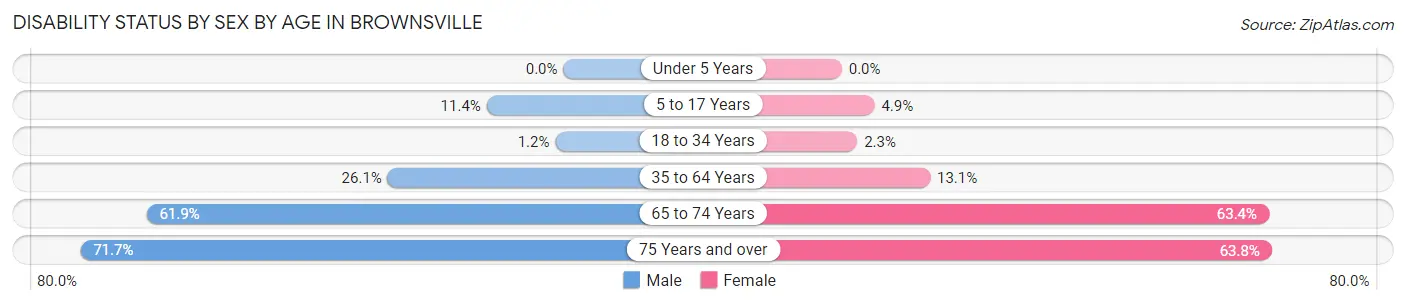
| Age Bracket | Male | Female |
| Under 5 Years | 0 (0.0%) | 0 (0.0%) |
| 5 to 17 Years | 9 (11.4%) | 5 (4.9%) |
| 18 to 34 Years | 1 (1.2%) | 3 (2.3%) |
| 35 to 64 Years | 24 (26.1%) | 19 (13.1%) |
| 65 to 74 Years | 26 (61.9%) | 26 (63.4%) |
| 75 Years and over | 33 (71.7%) | 30 (63.8%) |
Disability Class by Sex by Age in Brownsville
Disability Class: Hearing Difficulty
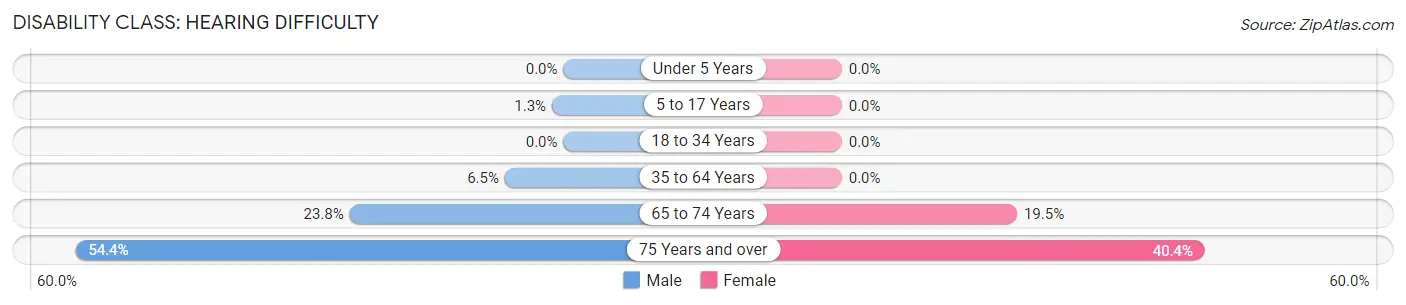
| Age Bracket | Male | Female |
| Under 5 Years | 0 (0.0%) | 0 (0.0%) |
| 5 to 17 Years | 1 (1.3%) | 0 (0.0%) |
| 18 to 34 Years | 0 (0.0%) | 0 (0.0%) |
| 35 to 64 Years | 6 (6.5%) | 0 (0.0%) |
| 65 to 74 Years | 10 (23.8%) | 8 (19.5%) |
| 75 Years and over | 25 (54.3%) | 19 (40.4%) |
Disability Class: Vision Difficulty
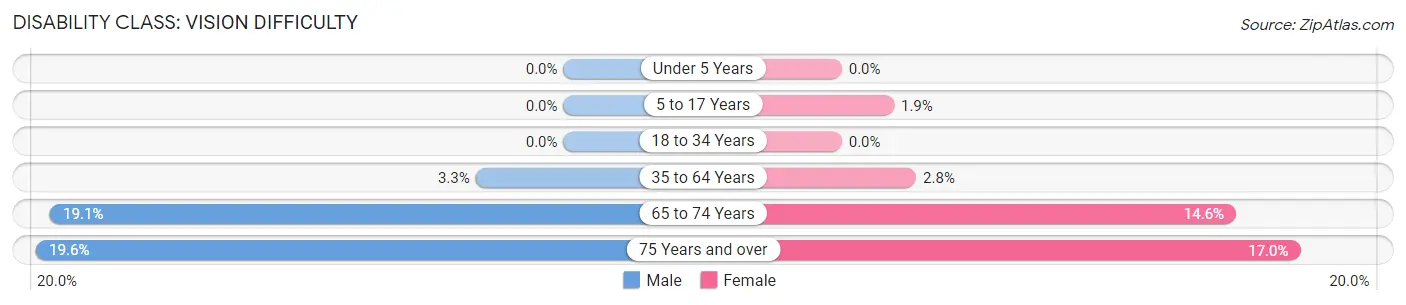
| Age Bracket | Male | Female |
| Under 5 Years | 0 (0.0%) | 0 (0.0%) |
| 5 to 17 Years | 0 (0.0%) | 2 (1.9%) |
| 18 to 34 Years | 0 (0.0%) | 0 (0.0%) |
| 35 to 64 Years | 3 (3.3%) | 4 (2.8%) |
| 65 to 74 Years | 8 (19.1%) | 6 (14.6%) |
| 75 Years and over | 9 (19.6%) | 8 (17.0%) |
Disability Class: Cognitive Difficulty
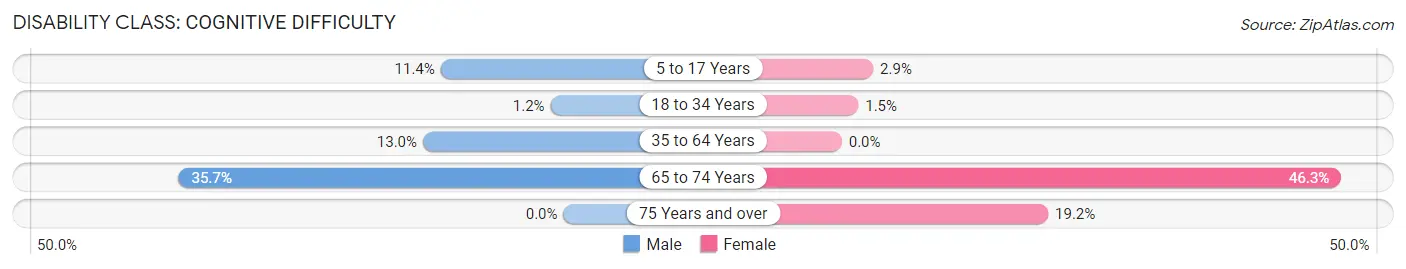
| Age Bracket | Male | Female |
| 5 to 17 Years | 9 (11.4%) | 3 (2.9%) |
| 18 to 34 Years | 1 (1.2%) | 2 (1.5%) |
| 35 to 64 Years | 12 (13.0%) | 0 (0.0%) |
| 65 to 74 Years | 15 (35.7%) | 19 (46.3%) |
| 75 Years and over | 0 (0.0%) | 9 (19.2%) |
Disability Class: Ambulatory Difficulty
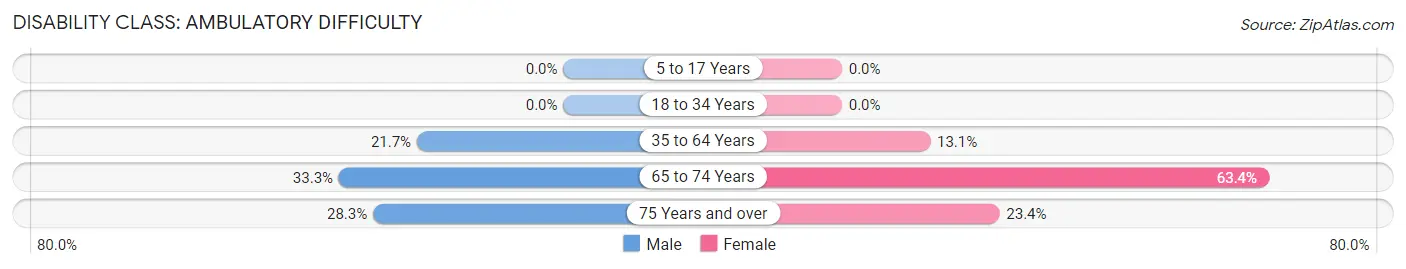
| Age Bracket | Male | Female |
| 5 to 17 Years | 0 (0.0%) | 0 (0.0%) |
| 18 to 34 Years | 0 (0.0%) | 0 (0.0%) |
| 35 to 64 Years | 20 (21.7%) | 19 (13.1%) |
| 65 to 74 Years | 14 (33.3%) | 26 (63.4%) |
| 75 Years and over | 13 (28.3%) | 11 (23.4%) |
Disability Class: Self-Care Difficulty
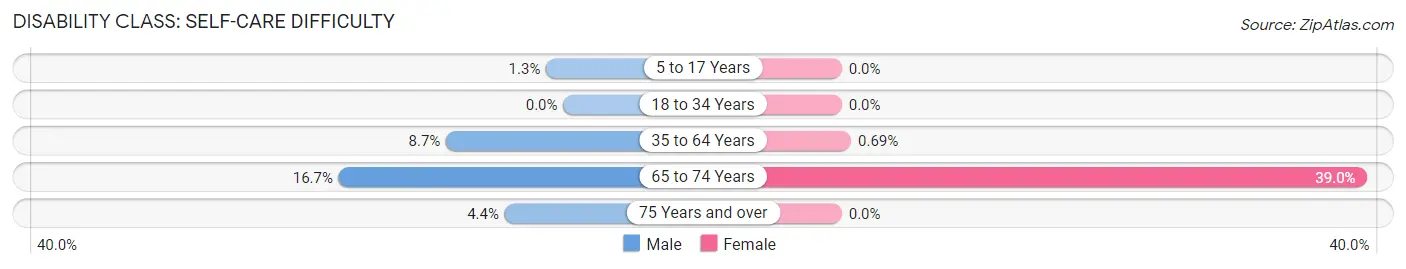
| Age Bracket | Male | Female |
| 5 to 17 Years | 1 (1.3%) | 0 (0.0%) |
| 18 to 34 Years | 0 (0.0%) | 0 (0.0%) |
| 35 to 64 Years | 8 (8.7%) | 1 (0.7%) |
| 65 to 74 Years | 7 (16.7%) | 16 (39.0%) |
| 75 Years and over | 2 (4.3%) | 0 (0.0%) |
Technology Access in Brownsville
Computing Device Access in Brownsville
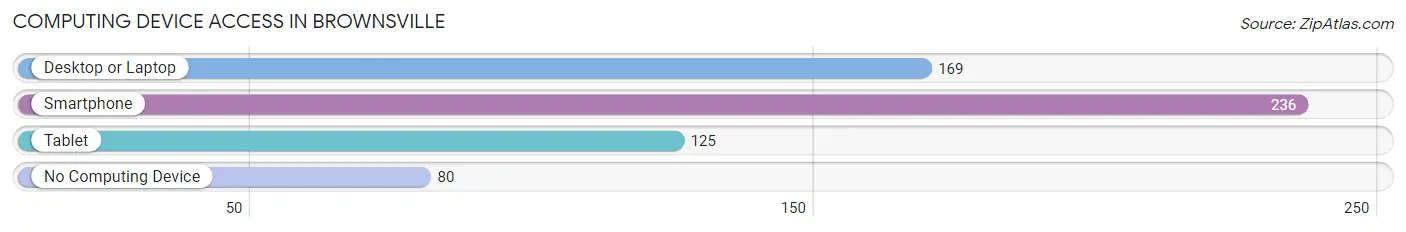
| Device Type | # Households | % Households |
| Desktop or Laptop | 169 | 49.6% |
| Smartphone | 236 | 69.2% |
| Tablet | 125 | 36.7% |
| No Computing Device | 80 | 23.5% |
| Total | 341 | 100.0% |
Internet Access in Brownsville
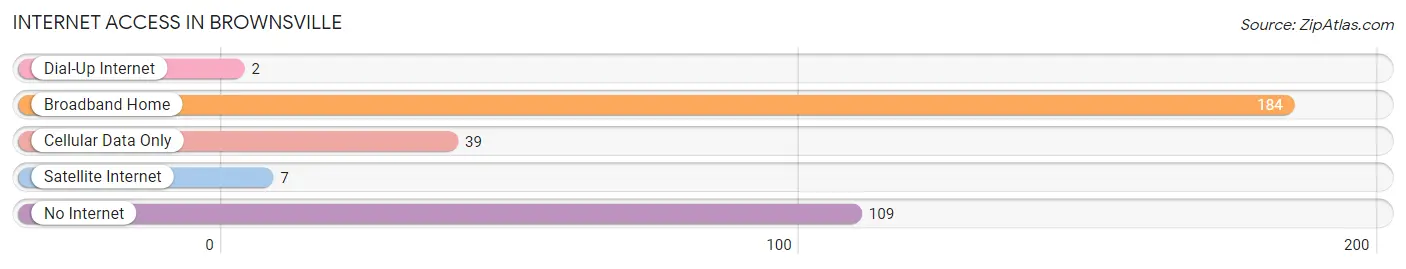
| Internet Type | # Households | % Households |
| Dial-Up Internet | 2 | 0.6% |
| Broadband Home | 184 | 54.0% |
| Cellular Data Only | 39 | 11.4% |
| Satellite Internet | 7 | 2.1% |
| No Internet | 109 | 32.0% |
| Total | 341 | 100.0% |
Brownsville Summary
Brownsville, Kentucky is a small city located in Edmonson County, Kentucky. It is situated on the banks of the Green River, and is the county seat of Edmonson County. The city has a population of approximately 2,000 people, and is part of the Bowling Green Metropolitan Statistical Area.
History
The area that is now Brownsville was first settled in the early 1800s by a group of settlers from Virginia. The town was originally known as “Brown’s Station”, after the first settler, William Brown. The town was officially incorporated in 1836, and was renamed Brownsville.
In the late 1800s, Brownsville was a thriving river port town, with a large number of steamboats and barges traveling up and down the Green River. The town was also home to a number of businesses, including a sawmill, a gristmill, a tannery, and a distillery.
In the early 1900s, the town began to decline as the river traffic decreased and the businesses closed. The town was further impacted by the Great Depression, and by the 1950s, the population had dropped to just over 1,000 people.
Geography
Brownsville is located in Edmonson County, Kentucky, on the banks of the Green River. The city is situated at an elevation of 590 feet above sea level. The city covers an area of 1.3 square miles, and is bordered by the cities of Smiths Grove and Rocky Hill.
The climate in Brownsville is classified as humid subtropical, with hot, humid summers and mild winters. The average annual temperature is 61 degrees Fahrenheit, and the average annual precipitation is 44 inches.
Economy
The economy of Brownsville is largely based on agriculture and tourism. The city is home to a number of farms, and the surrounding area is known for its production of tobacco, corn, and soybeans.
The city is also home to a number of tourist attractions, including the Green River State Park, the Mammoth Cave National Park, and the Brownsville Museum of History. The city is also home to a number of restaurants, shops, and other businesses.
Demographics
As of the 2010 census, the population of Brownsville was 2,000 people. The racial makeup of the city was 97.5% White, 0.5% African American, 0.5% Native American, 0.5% Asian, and 1.0% from other races.
The median household income in Brownsville was $30,000, and the median family income was $35,000. The per capita income in the city was $15,000. The poverty rate in the city was 22.5%.
Conclusion
Brownsville, Kentucky is a small city located in Edmonson County, Kentucky. It is situated on the banks of the Green River, and is the county seat of Edmonson County. The city has a population of approximately 2,000 people, and is part of the Bowling Green Metropolitan Statistical Area. The economy of Brownsville is largely based on agriculture and tourism, and the city is home to a number of tourist attractions. The racial makeup of the city is 97.5% White, 0.5% African American, 0.5% Native American, 0.5% Asian, and 1.0% from other races. The median household income in Brownsville was $30,000, and the median family income was $35,000. The per capita income in the city was $15,000. The poverty rate in the city was 22.5%.
Common Questions
What is Per Capita Income in Brownsville?
Per Capita income in Brownsville is $15,605.
What is the Median Family Income in Brownsville?
Median Family Income in Brownsville is $51,750.
What is the Median Household income in Brownsville?
Median Household Income in Brownsville is $34,150.
What is Income or Wage Gap in Brownsville?
Income or Wage Gap in Brownsville is 52.7%.
Women in Brownsville earn 47.3 cents for every dollar earned by a man.
What is Family Income Deficit in Brownsville?
Family Income Deficit in Brownsville is $10,742.
Families that are below poverty line in Brownsville earn $10,742 less on average than the poverty threshold level.
What is Inequality or Gini Index in Brownsville?
Inequality or Gini Index in Brownsville is 0.42.
What is the Total Population of Brownsville?
Total Population of Brownsville is 1,050.
What is the Total Male Population of Brownsville?
Total Male Population of Brownsville is 416.
What is the Total Female Population of Brownsville?
Total Female Population of Brownsville is 634.
What is the Ratio of Males per 100 Females in Brownsville?
There are 65.62 Males per 100 Females in Brownsville.
What is the Ratio of Females per 100 Males in Brownsville?
There are 152.40 Females per 100 Males in Brownsville.
What is the Median Population Age in Brownsville?
Median Population Age in Brownsville is 30.1 Years.
What is the Average Family Size in Brownsville
Average Family Size in Brownsville is 3.3 People.
What is the Average Household Size in Brownsville
Average Household Size in Brownsville is 2.8 People.
How Large is the Labor Force in Brownsville?
There are 303 People in the Labor Forcein in Brownsville.
What is the Percentage of People in the Labor Force in Brownsville?
42.0% of People are in the Labor Force in Brownsville.
What is the Unemployment Rate in Brownsville?
Unemployment Rate in Brownsville is 7.6%.