Adairville, KY Map & Demographics
Adairville Map
Adairville Overview
$22,840
PER CAPITA INCOME
$41,450
AVG FAMILY INCOME
$36,176
AVG HOUSEHOLD INCOME
$12,119
FAMILY INCOME DEFICIT
0.46
INEQUALITY / GINI INDEX
747
TOTAL POPULATION
315
MALE POPULATION
432
FEMALE POPULATION
72.92
MALES / 100 FEMALES
137.14
FEMALES / 100 MALES
52.6
MEDIAN AGE
2.6
AVG FAMILY SIZE
2.1
AVG HOUSEHOLD SIZE
297
LABOR FORCE [ PEOPLE ]
45.9%
PERCENT IN LABOR FORCE
4.0%
UNEMPLOYMENT RATE
Adairville Zip Codes
Adairville Area Codes
Income in Adairville
Income Overview in Adairville
Per Capita Income in Adairville is $22,840, while median incomes of families and households are $41,450 and $36,176 respectively.
| Characteristic | Number | Measure |
| Per Capita Income | 747 | $22,840 |
| Median Family Income | 211 | $41,450 |
| Mean Family Income | 211 | $47,932 |
| Median Household Income | 360 | $36,176 |
| Mean Household Income | 360 | $45,276 |
| Income Deficit | 211 | $12,119 |
| Wage / Income Gap (%) | 747 | 0.00% |
| Wage / Income Gap ($) | 747 | 100.00¢ per $1 |
| Gini / Inequality Index | 747 | 0.46 |
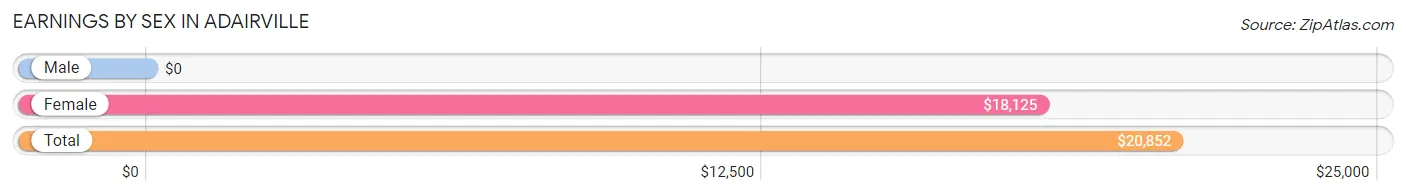
Earnings by Sex in Adairville
| Sex | Number | Average Earnings |
| Male | 168 (55.4%) | $0 |
| Female | 135 (44.6%) | $18,125 |
| Total | 303 (100.0%) | $20,852 |
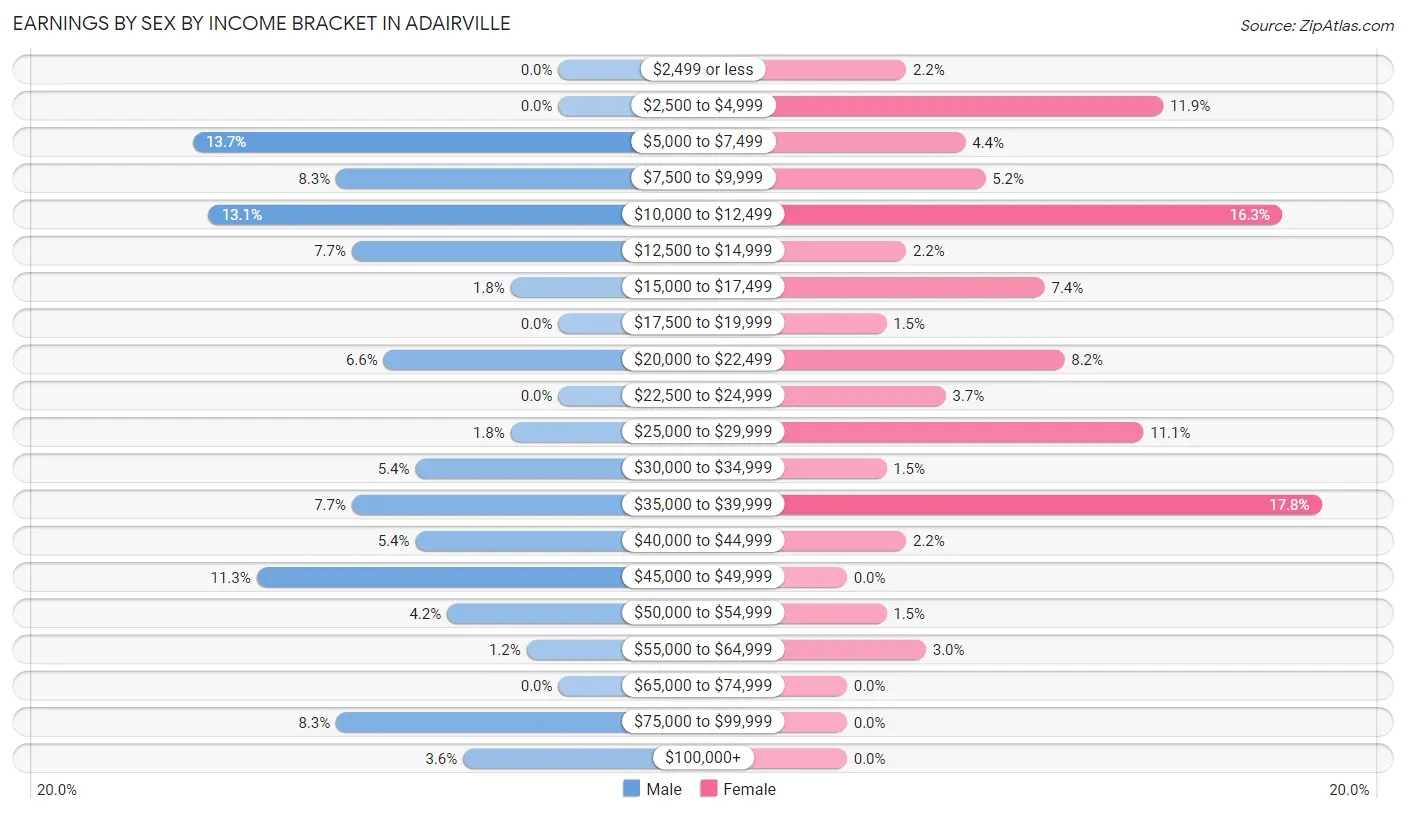
Earnings by Sex by Income Bracket in Adairville
The most common earnings brackets in Adairville are $5,000 to $7,499 for men (23 | 13.7%) and $35,000 to $39,999 for women (24 | 17.8%).
| Income | Male | Female |
| $2,499 or less | 0 (0.0%) | 3 (2.2%) |
| $2,500 to $4,999 | 0 (0.0%) | 16 (11.8%) |
| $5,000 to $7,499 | 23 (13.7%) | 6 (4.4%) |
| $7,500 to $9,999 | 14 (8.3%) | 7 (5.2%) |
| $10,000 to $12,499 | 22 (13.1%) | 22 (16.3%) |
| $12,500 to $14,999 | 13 (7.7%) | 3 (2.2%) |
| $15,000 to $17,499 | 3 (1.8%) | 10 (7.4%) |
| $17,500 to $19,999 | 0 (0.0%) | 2 (1.5%) |
| $20,000 to $22,499 | 11 (6.6%) | 11 (8.2%) |
| $22,500 to $24,999 | 0 (0.0%) | 5 (3.7%) |
| $25,000 to $29,999 | 3 (1.8%) | 15 (11.1%) |
| $30,000 to $34,999 | 9 (5.4%) | 2 (1.5%) |
| $35,000 to $39,999 | 13 (7.7%) | 24 (17.8%) |
| $40,000 to $44,999 | 9 (5.4%) | 3 (2.2%) |
| $45,000 to $49,999 | 19 (11.3%) | 0 (0.0%) |
| $50,000 to $54,999 | 7 (4.2%) | 2 (1.5%) |
| $55,000 to $64,999 | 2 (1.2%) | 4 (3.0%) |
| $65,000 to $74,999 | 0 (0.0%) | 0 (0.0%) |
| $75,000 to $99,999 | 14 (8.3%) | 0 (0.0%) |
| $100,000+ | 6 (3.6%) | 0 (0.0%) |
| Total | 168 (100.0%) | 135 (100.0%) |
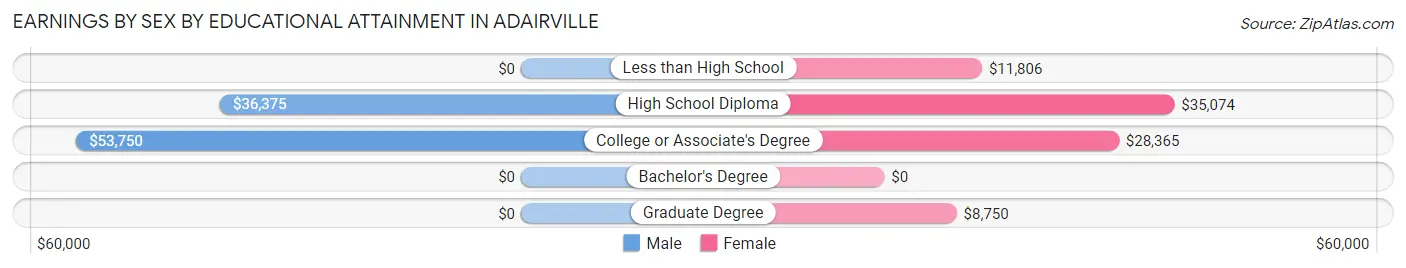
Earnings by Sex by Educational Attainment in Adairville
Average earnings in Adairville are $33,500 for men and $20,682 for women, a difference of 38.3%. Men with an educational attainment of college or associate's degree enjoy the highest average annual earnings of $53,750, while those with high school diploma education earn the least with $36,375. Women with an educational attainment of high school diploma earn the most with the average annual earnings of $35,074, while those with graduate degree education have the smallest earnings of $8,750.
| Educational Attainment | Male Income | Female Income |
| Less than High School | - | - |
| High School Diploma | $36,375 | $35,074 |
| College or Associate's Degree | $53,750 | $28,365 |
| Bachelor's Degree | - | - |
| Graduate Degree | - | - |
| Total | $33,500 | $20,682 |
Family Income in Adairville
Family Income Brackets in Adairville
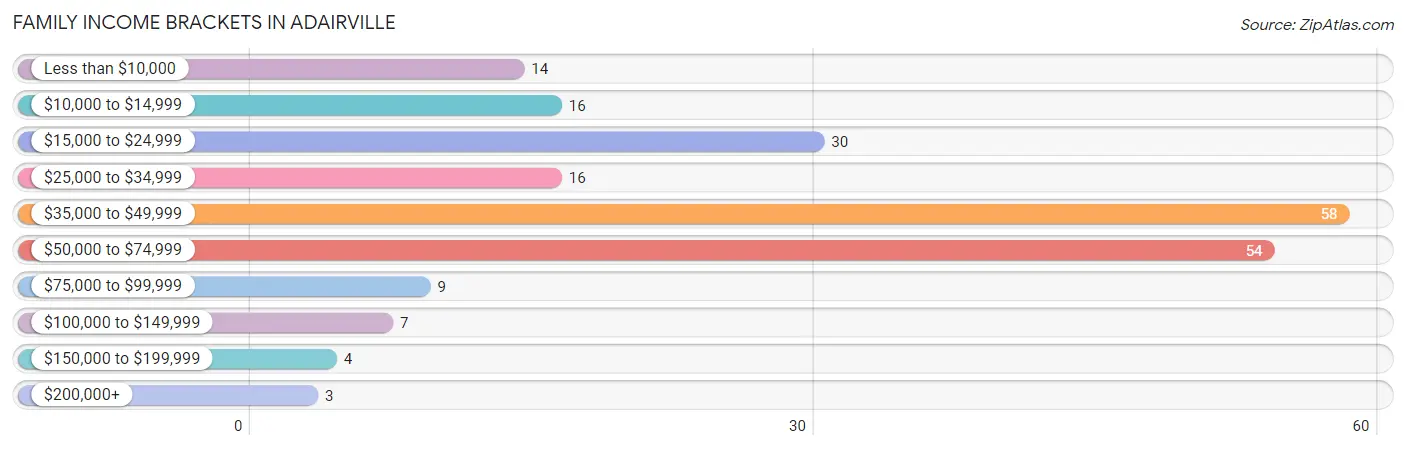
According to the Adairville family income data, there are 58 families falling into the $35,000 to $49,999 income range, which is the most common income bracket and makes up 27.5% of all families. Conversely, the $200,000+ income bracket is the least frequent group with only 3 families (1.4%) belonging to this category.
| Income Bracket | # Families | % Families |
| Less than $10,000 | 14 | 6.6% |
| $10,000 to $14,999 | 16 | 7.6% |
| $15,000 to $24,999 | 30 | 14.2% |
| $25,000 to $34,999 | 16 | 7.6% |
| $35,000 to $49,999 | 58 | 27.5% |
| $50,000 to $74,999 | 54 | 25.6% |
| $75,000 to $99,999 | 9 | 4.3% |
| $100,000 to $149,999 | 7 | 3.3% |
| $150,000 to $199,999 | 4 | 1.9% |
| $200,000+ | 3 | 1.4% |
Family Income by Famaliy Size in Adairville
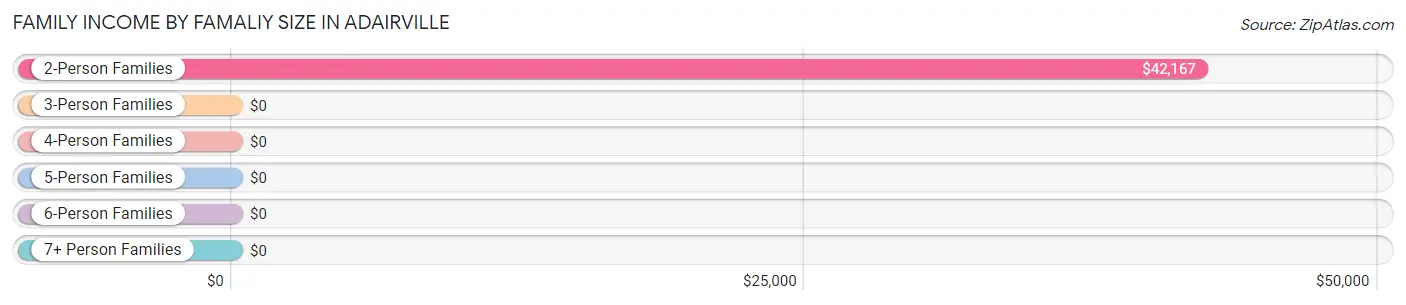
2-person families (152 | 72.0%) account for the highest median family income in Adairville with $42,167 per family, while 2-person families (152 | 72.0%) have the highest median income of $21,084 per family member.
| Income Bracket | # Families | Median Income |
| 2-Person Families | 152 (72.0%) | $42,167 |
| 3-Person Families | 23 (10.9%) | $0 |
| 4-Person Families | 28 (13.3%) | $0 |
| 5-Person Families | 3 (1.4%) | $0 |
| 6-Person Families | 0 (0.0%) | $0 |
| 7+ Person Families | 5 (2.4%) | $0 |
| Total | 211 (100.0%) | $41,450 |
Family Income by Number of Earners in Adairville
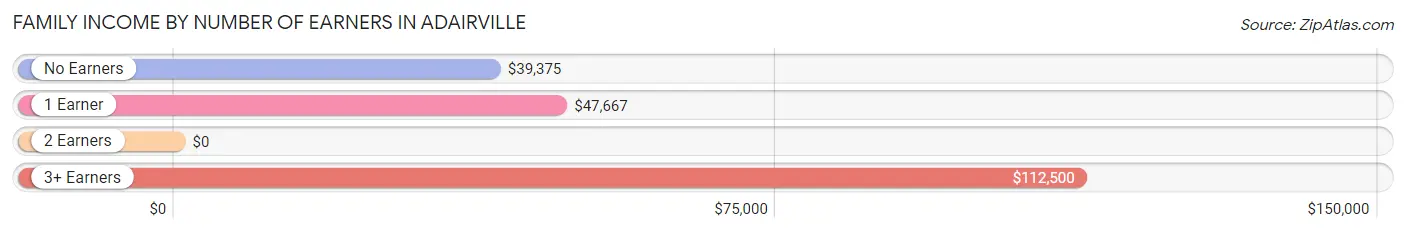
| Number of Earners | # Families | Median Income |
| No Earners | 63 (29.9%) | $39,375 |
| 1 Earner | 90 (42.6%) | $47,667 |
| 2 Earners | 46 (21.8%) | $0 |
| 3+ Earners | 12 (5.7%) | $112,500 |
| Total | 211 (100.0%) | $41,450 |
Household Income in Adairville
Household Income Brackets in Adairville
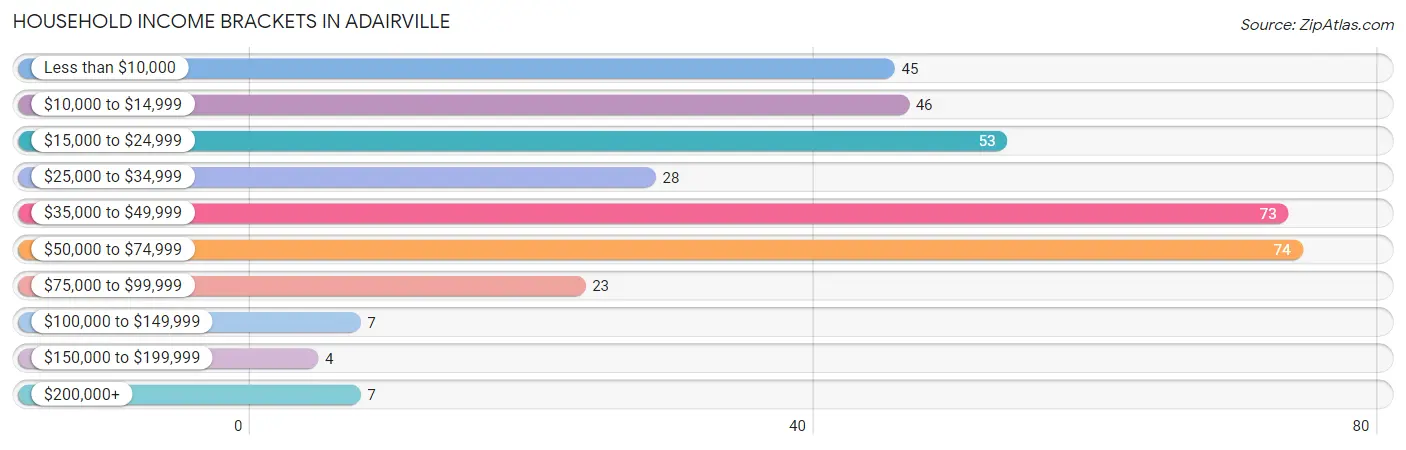
With 74 households falling in the category, the $50,000 to $74,999 income range is the most frequent in Adairville, accounting for 20.6% of all households. In contrast, only 4 households (1.1%) fall into the $150,000 to $199,999 income bracket, making it the least populous group.
| Income Bracket | # Households | % Households |
| Less than $10,000 | 45 | 12.5% |
| $10,000 to $14,999 | 46 | 12.8% |
| $15,000 to $24,999 | 53 | 14.7% |
| $25,000 to $34,999 | 28 | 7.8% |
| $35,000 to $49,999 | 73 | 20.3% |
| $50,000 to $74,999 | 74 | 20.6% |
| $75,000 to $99,999 | 23 | 6.4% |
| $100,000 to $149,999 | 7 | 1.9% |
| $150,000 to $199,999 | 4 | 1.1% |
| $200,000+ | 7 | 1.9% |
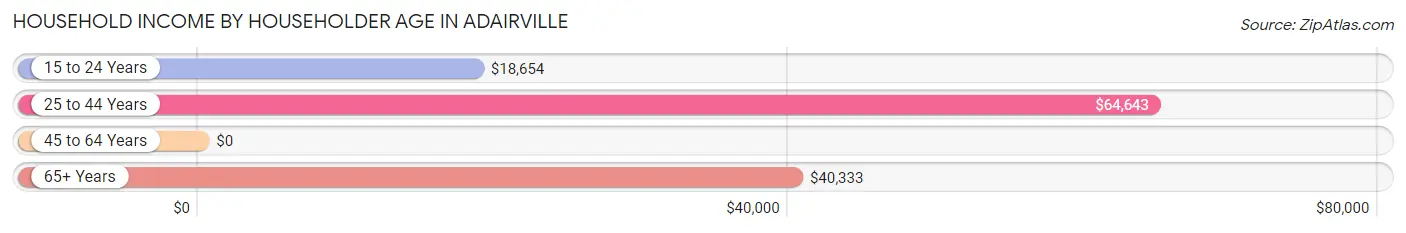
Household Income by Householder Age in Adairville
The median household income in Adairville is $36,176, with the highest median household income of $64,643 found in the 25 to 44 years age bracket for the primary householder. A total of 50 households (13.9%) fall into this category. Meanwhile, the 45 to 64 years age bracket for the primary householder has the lowest median household income of $0, with 142 households (39.4%) in this group.
| Income Bracket | # Households | Median Income |
| 15 to 24 Years | 18 (5.0%) | $18,654 |
| 25 to 44 Years | 50 (13.9%) | $64,643 |
| 45 to 64 Years | 142 (39.4%) | $0 |
| 65+ Years | 150 (41.7%) | $40,333 |
| Total | 360 (100.0%) | $36,176 |
Poverty in Adairville
Income Below Poverty by Sex and Age in Adairville
With 34.6% poverty level for males and 36.1% for females among the residents of Adairville, under 5 year old males and 6 to 11 year old females are the most vulnerable to poverty, with 12 males (100.0%) and 25 females (69.4%) in their respective age groups living below the poverty level.
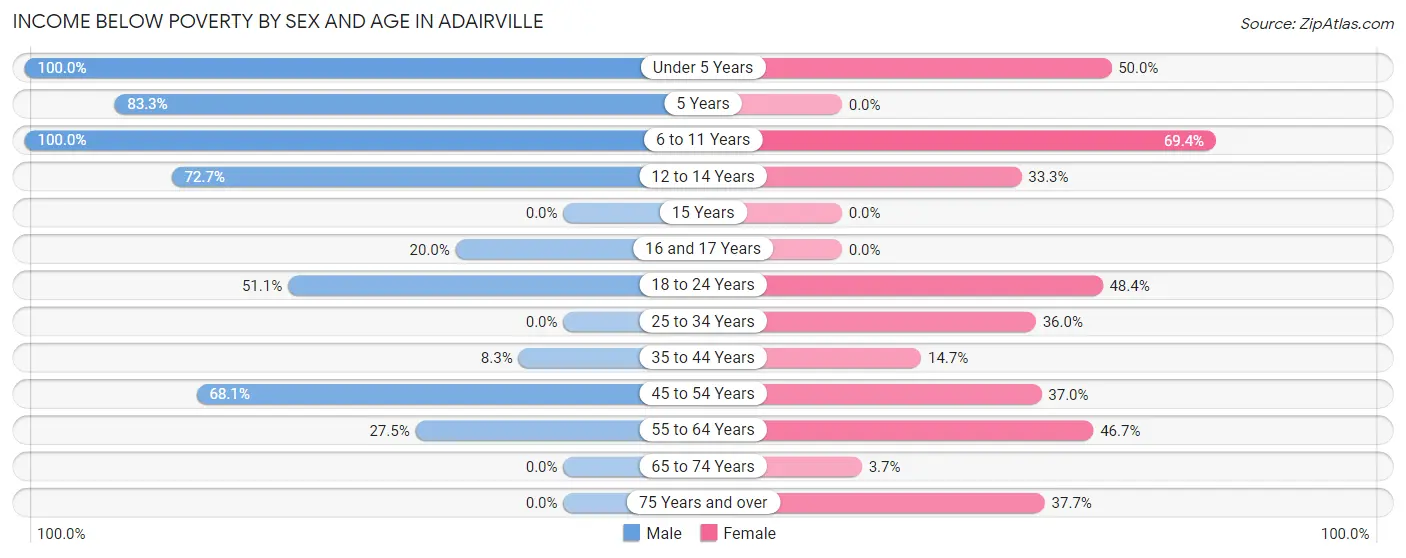
| Age Bracket | Male | Female |
| Under 5 Years | 12 (100.0%) | 2 (50.0%) |
| 5 Years | 5 (83.3%) | 0 (0.0%) |
| 6 to 11 Years | 10 (100.0%) | 25 (69.4%) |
| 12 to 14 Years | 8 (72.7%) | 4 (33.3%) |
| 15 Years | 0 (0.0%) | 0 (0.0%) |
| 16 and 17 Years | 2 (20.0%) | 0 (0.0%) |
| 18 to 24 Years | 23 (51.1%) | 15 (48.4%) |
| 25 to 34 Years | 0 (0.0%) | 9 (36.0%) |
| 35 to 44 Years | 3 (8.3%) | 5 (14.7%) |
| 45 to 54 Years | 32 (68.1%) | 20 (37.0%) |
| 55 to 64 Years | 14 (27.5%) | 42 (46.7%) |
| 65 to 74 Years | 0 (0.0%) | 2 (3.7%) |
| 75 Years and over | 0 (0.0%) | 32 (37.7%) |
| Total | 109 (34.6%) | 156 (36.1%) |
Income Above Poverty by Sex and Age in Adairville
According to the poverty statistics in Adairville, males aged 15 years and females aged 5 years are the age groups that are most secure financially, with 100.0% of males and 100.0% of females in these age groups living above the poverty line.
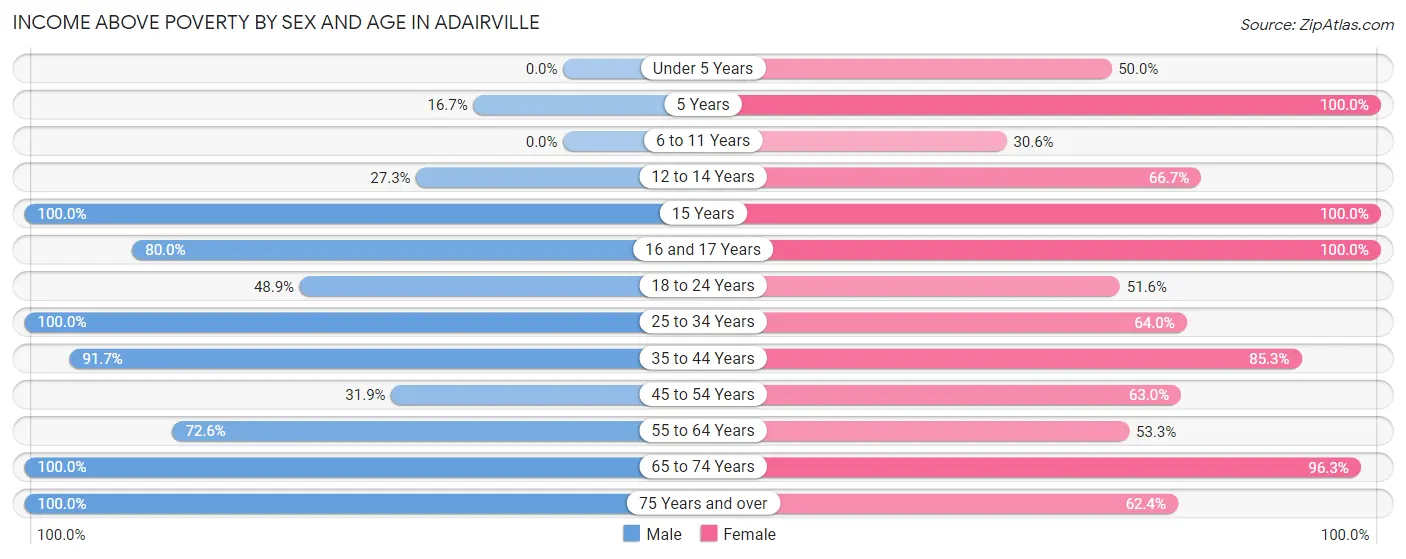
| Age Bracket | Male | Female |
| Under 5 Years | 0 (0.0%) | 2 (50.0%) |
| 5 Years | 1 (16.7%) | 3 (100.0%) |
| 6 to 11 Years | 0 (0.0%) | 11 (30.6%) |
| 12 to 14 Years | 3 (27.3%) | 8 (66.7%) |
| 15 Years | 4 (100.0%) | 2 (100.0%) |
| 16 and 17 Years | 8 (80.0%) | 2 (100.0%) |
| 18 to 24 Years | 22 (48.9%) | 16 (51.6%) |
| 25 to 34 Years | 20 (100.0%) | 16 (64.0%) |
| 35 to 44 Years | 33 (91.7%) | 29 (85.3%) |
| 45 to 54 Years | 15 (31.9%) | 34 (63.0%) |
| 55 to 64 Years | 37 (72.6%) | 48 (53.3%) |
| 65 to 74 Years | 24 (100.0%) | 52 (96.3%) |
| 75 Years and over | 39 (100.0%) | 53 (62.4%) |
| Total | 206 (65.4%) | 276 (63.9%) |
Income Below Poverty Among Married-Couple Families in Adairville
The poverty statistics for married-couple families in Adairville show that 22.1% or 32 of the total 145 families live below the poverty line. Families with 5 or more children have the highest poverty rate of 60.0%, comprising of 3 families. On the other hand, families with no children have the lowest poverty rate of 15.1%, which includes 18 families.
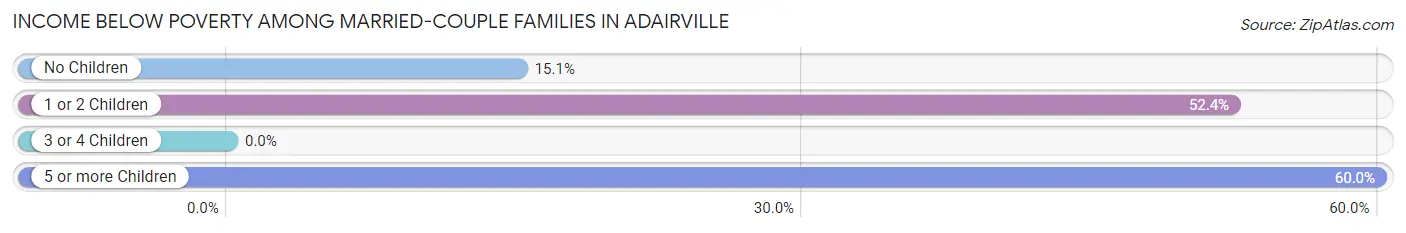
| Children | Above Poverty | Below Poverty |
| No Children | 101 (84.9%) | 18 (15.1%) |
| 1 or 2 Children | 10 (47.6%) | 11 (52.4%) |
| 3 or 4 Children | 0 (0.0%) | 0 (0.0%) |
| 5 or more Children | 2 (40.0%) | 3 (60.0%) |
| Total | 113 (77.9%) | 32 (22.1%) |
Income Below Poverty Among Single-Parent Households in Adairville
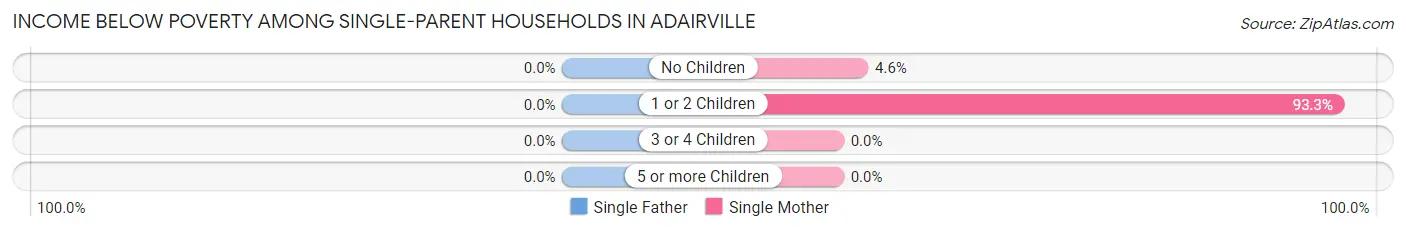
| Children | Single Father | Single Mother |
| No Children | 0 (0.0%) | 2 (4.5%) |
| 1 or 2 Children | 0 (0.0%) | 14 (93.3%) |
| 3 or 4 Children | 0 (0.0%) | 0 (0.0%) |
| 5 or more Children | 0 (0.0%) | 0 (0.0%) |
| Total | 0 (0.0%) | 16 (27.1%) |
Income Below Poverty Among Married-Couple vs Single-Parent Households in Adairville
The poverty data for Adairville shows that 32 of the married-couple family households (22.1%) and 16 of the single-parent households (24.2%) are living below the poverty level. Within the married-couple family households, those with 5 or more children have the highest poverty rate, with 3 households (60.0%) falling below the poverty line. Among the single-parent households, those with 1 or 2 children have the highest poverty rate, with 14 household (63.6%) living below poverty.
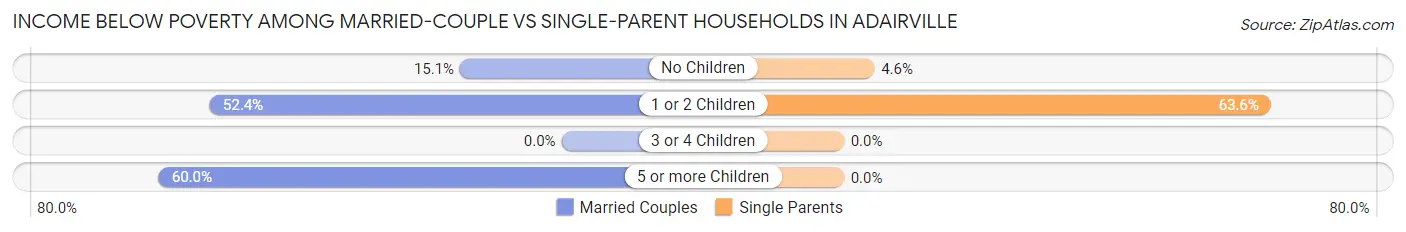
| Children | Married-Couple Families | Single-Parent Households |
| No Children | 18 (15.1%) | 2 (4.5%) |
| 1 or 2 Children | 11 (52.4%) | 14 (63.6%) |
| 3 or 4 Children | 0 (0.0%) | 0 (0.0%) |
| 5 or more Children | 3 (60.0%) | 0 (0.0%) |
| Total | 32 (22.1%) | 16 (24.2%) |
Race in Adairville
The most populous races in Adairville are White / Caucasian (596 | 79.8%), Black / African American (82 | 11.0%), and Two or more Races (60 | 8.0%).
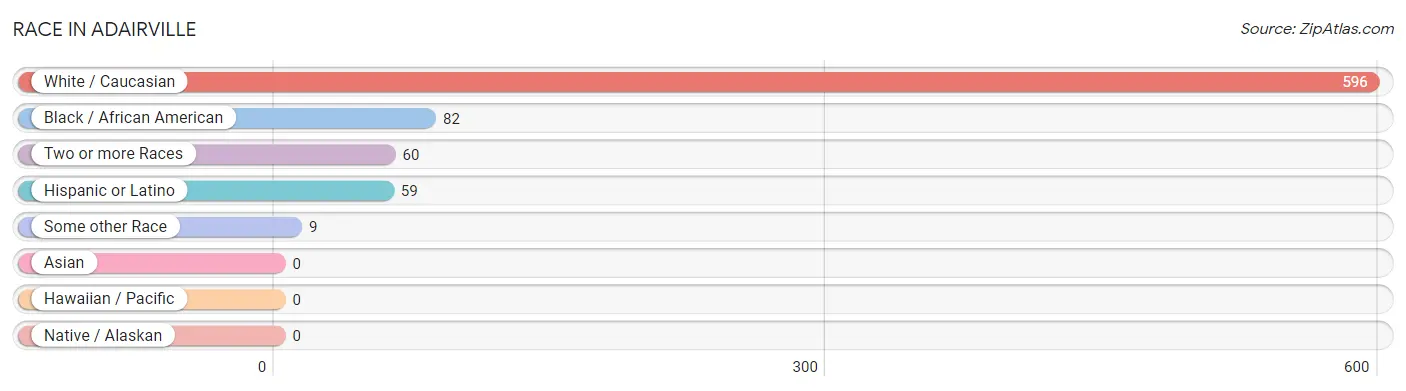
| Race | # Population | % Population |
| Asian | 0 | 0.0% |
| Black / African American | 82 | 11.0% |
| Hawaiian / Pacific | 0 | 0.0% |
| Hispanic or Latino | 59 | 7.9% |
| Native / Alaskan | 0 | 0.0% |
| White / Caucasian | 596 | 79.8% |
| Two or more Races | 60 | 8.0% |
| Some other Race | 9 | 1.2% |
| Total | 747 | 100.0% |
Ancestry in Adairville
The most populous ancestries reported in Adairville are American (103 | 13.8%), German (94 | 12.6%), Irish (86 | 11.5%), Mexican (59 | 7.9%), and English (56 | 7.5%), together accounting for 53.3% of all Adairville residents.
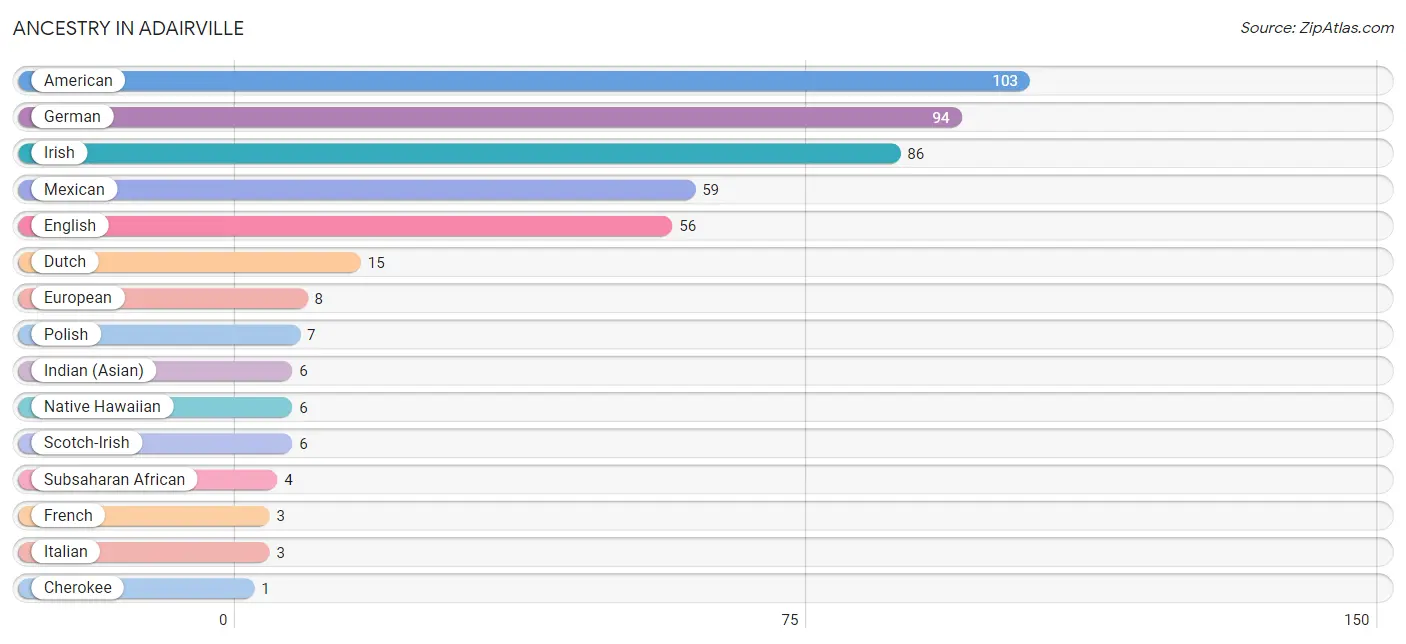
| Ancestry | # Population | % Population |
| American | 103 | 13.8% |
| Cherokee | 1 | 0.1% |
| Chickasaw | 1 | 0.1% |
| Dutch | 15 | 2.0% |
| English | 56 | 7.5% |
| European | 8 | 1.1% |
| French | 3 | 0.4% |
| German | 94 | 12.6% |
| Indian (Asian) | 6 | 0.8% |
| Irish | 86 | 11.5% |
| Italian | 3 | 0.4% |
| Mexican | 59 | 7.9% |
| Native Hawaiian | 6 | 0.8% |
| Polish | 7 | 0.9% |
| Scotch-Irish | 6 | 0.8% |
| Subsaharan African | 4 | 0.5% | View All 16 Rows |
Immigrants in Adairville
The most numerous immigrant groups reported in Adairville came from Central America (8 | 1.1%), Latin America (8 | 1.1%), and Mexico (8 | 1.1%), together accounting for 3.2% of all Adairville residents.
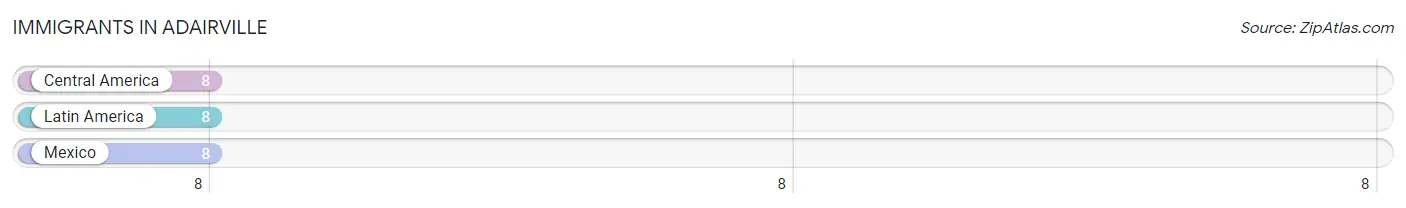
| Immigration Origin | # Population | % Population |
| Central America | 8 | 1.1% |
| Latin America | 8 | 1.1% |
| Mexico | 8 | 1.1% | View All 3 Rows |
Sex and Age in Adairville
Sex and Age in Adairville
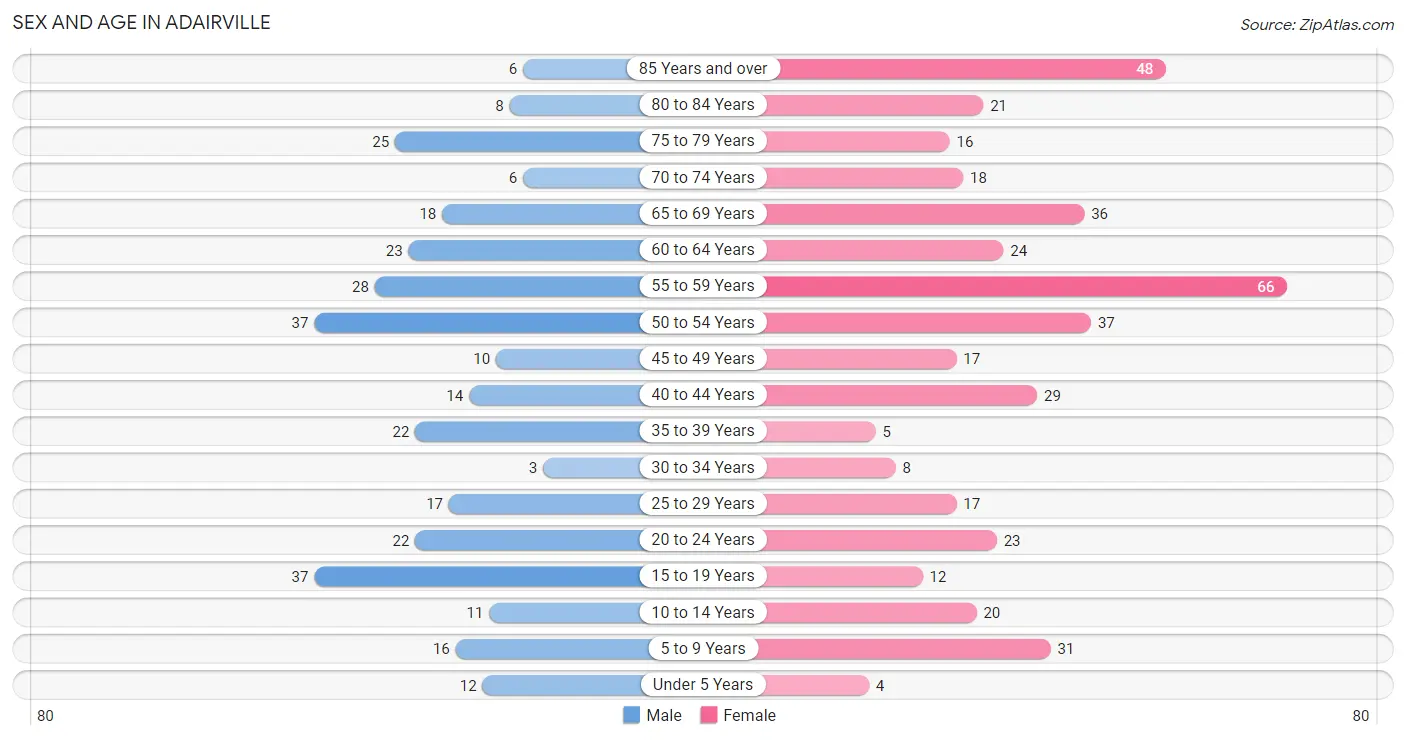
The most populous age groups in Adairville are 15 to 19 Years (37 | 11.7%) for men and 55 to 59 Years (66 | 15.3%) for women.
| Age Bracket | Male | Female |
| Under 5 Years | 12 (3.8%) | 4 (0.9%) |
| 5 to 9 Years | 16 (5.1%) | 31 (7.2%) |
| 10 to 14 Years | 11 (3.5%) | 20 (4.6%) |
| 15 to 19 Years | 37 (11.7%) | 12 (2.8%) |
| 20 to 24 Years | 22 (7.0%) | 23 (5.3%) |
| 25 to 29 Years | 17 (5.4%) | 17 (3.9%) |
| 30 to 34 Years | 3 (0.9%) | 8 (1.8%) |
| 35 to 39 Years | 22 (7.0%) | 5 (1.2%) |
| 40 to 44 Years | 14 (4.4%) | 29 (6.7%) |
| 45 to 49 Years | 10 (3.2%) | 17 (3.9%) |
| 50 to 54 Years | 37 (11.7%) | 37 (8.6%) |
| 55 to 59 Years | 28 (8.9%) | 66 (15.3%) |
| 60 to 64 Years | 23 (7.3%) | 24 (5.6%) |
| 65 to 69 Years | 18 (5.7%) | 36 (8.3%) |
| 70 to 74 Years | 6 (1.9%) | 18 (4.2%) |
| 75 to 79 Years | 25 (7.9%) | 16 (3.7%) |
| 80 to 84 Years | 8 (2.5%) | 21 (4.9%) |
| 85 Years and over | 6 (1.9%) | 48 (11.1%) |
| Total | 315 (100.0%) | 432 (100.0%) |
Families and Households in Adairville
Median Family Size in Adairville
The median family size in Adairville is 2.64 persons per family, with married-couple families (145 | 68.7%) accounting for the largest median family size of 2.84 persons per family. On the other hand, single female/mother families (59 | 28.0%) represent the smallest median family size with 2.14 persons per family.
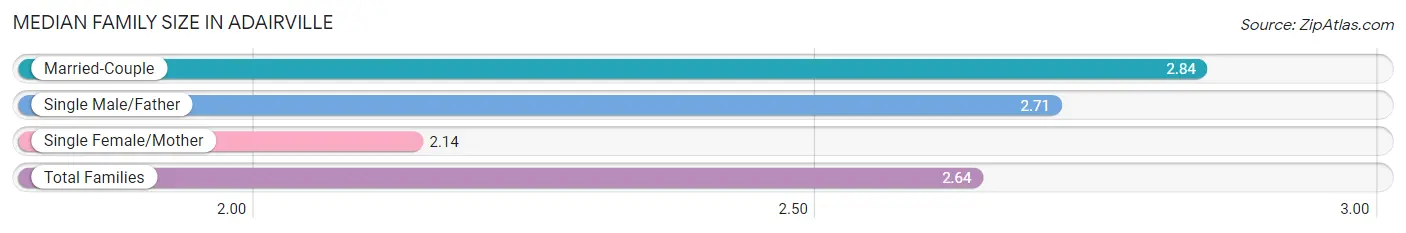
| Family Type | # Families | Family Size |
| Married-Couple | 145 (68.7%) | 2.84 |
| Single Male/Father | 7 (3.3%) | 2.71 |
| Single Female/Mother | 59 (28.0%) | 2.14 |
| Total Families | 211 (100.0%) | 2.64 |
Median Household Size in Adairville
The median household size in Adairville is 2.08 persons per household, with single male/father households (7 | 1.9%) accounting for the largest median household size of 3 persons per household. non-family households (149 | 41.4%) represent the smallest median household size with 1.19 persons per household.
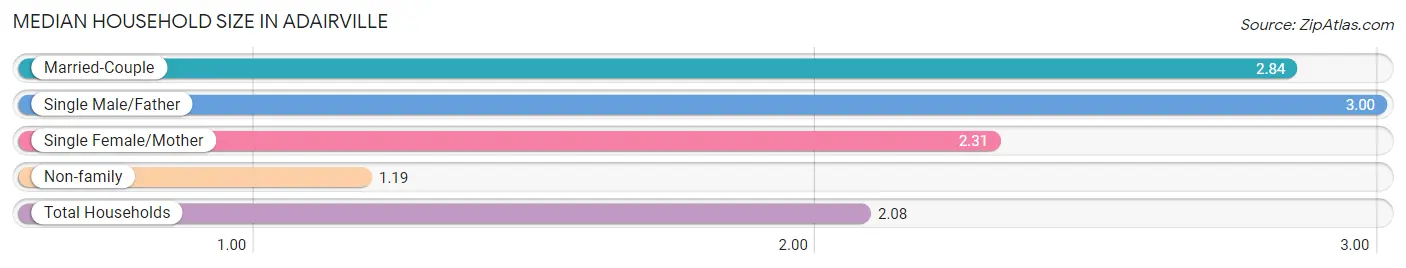
| Household Type | # Households | Household Size |
| Married-Couple | 145 (40.3%) | 2.84 |
| Single Male/Father | 7 (1.9%) | 3.00 |
| Single Female/Mother | 59 (16.4%) | 2.31 |
| Non-family | 149 (41.4%) | 1.19 |
| Total Households | 360 (100.0%) | 2.08 |
Household Size by Marriage Status in Adairville
Out of a total of 360 households in Adairville, 211 (58.6%) are family households, while 149 (41.4%) are nonfamily households. The most numerous type of family households are 2-person households, comprising 151, and the most common type of nonfamily households are 1-person households, comprising 123.
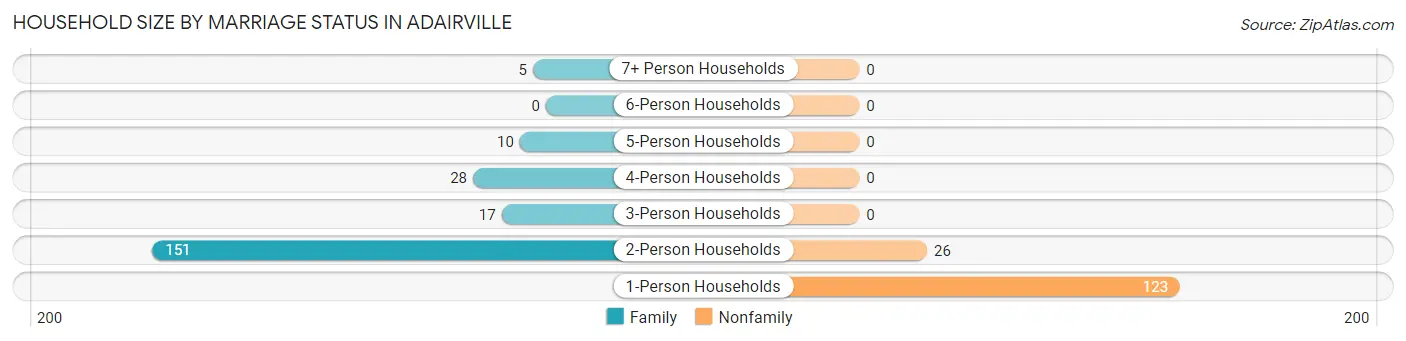
| Household Size | Family Households | Nonfamily Households |
| 1-Person Households | - | 123 (34.2%) |
| 2-Person Households | 151 (41.9%) | 26 (7.2%) |
| 3-Person Households | 17 (4.7%) | 0 (0.0%) |
| 4-Person Households | 28 (7.8%) | 0 (0.0%) |
| 5-Person Households | 10 (2.8%) | 0 (0.0%) |
| 6-Person Households | 0 (0.0%) | 0 (0.0%) |
| 7+ Person Households | 5 (1.4%) | 0 (0.0%) |
| Total | 211 (58.6%) | 149 (41.4%) |
Female Fertility in Adairville
Fertility by Age in Adairville
Average fertility rate in Adairville is 27.0 births per 1,000 women. Women in the age bracket of 20 to 34 years have the highest fertility rate with 63.0 births per 1,000 women. Women in the age bracket of 20 to 34 years acount for 100.0% of all women with births.
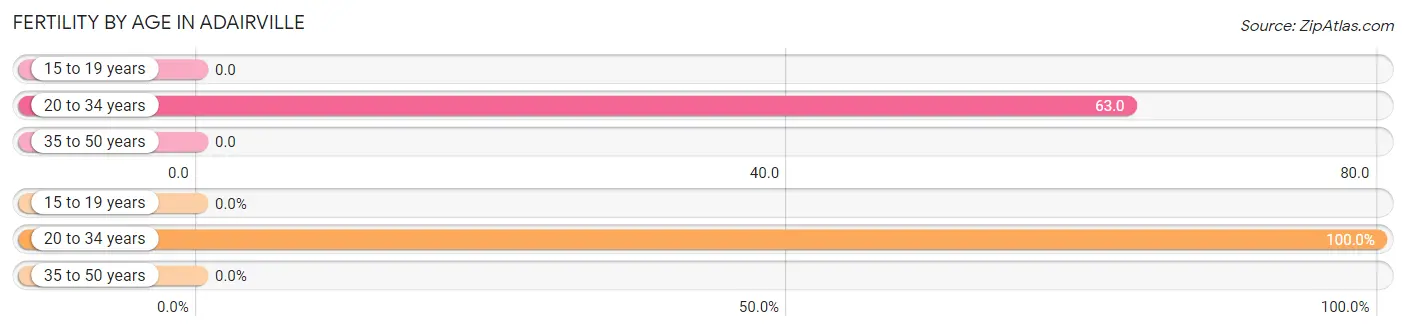
| Age Bracket | Women with Births | Births / 1,000 Women |
| 15 to 19 years | 0 (0.0%) | 0.0 |
| 20 to 34 years | 3 (100.0%) | 63.0 |
| 35 to 50 years | 0 (0.0%) | 0.0 |
| Total | 3 (100.0%) | 27.0 |
Fertility by Age by Marriage Status in Adairville
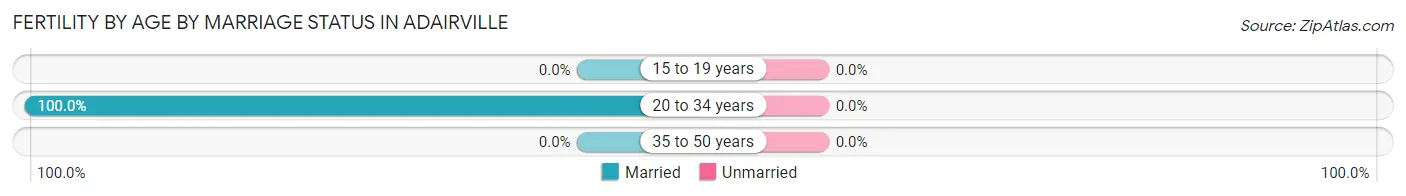
| Age Bracket | Married | Unmarried |
| 15 to 19 years | 0 (0.0%) | 0 (0.0%) |
| 20 to 34 years | 3 (100.0%) | 0 (0.0%) |
| 35 to 50 years | 0 (0.0%) | 0 (0.0%) |
| Total | 3 (100.0%) | 0 (0.0%) |
Fertility by Education in Adairville
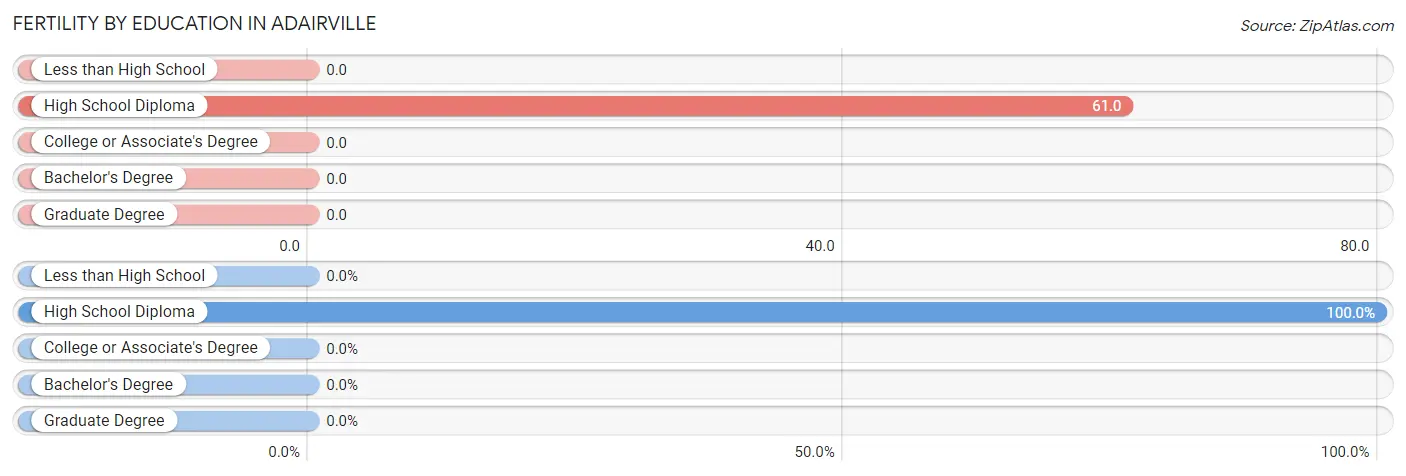
| Educational Attainment | Women with Births | Births / 1,000 Women |
| Less than High School | 0 (0.0%) | 0.0 |
| High School Diploma | 3 (100.0%) | 61.0 |
| College or Associate's Degree | 0 (0.0%) | 0.0 |
| Bachelor's Degree | 0 (0.0%) | 0.0 |
| Graduate Degree | 0 (0.0%) | 0.0 |
| Total | 3 (100.0%) | 27.0 |
Fertility by Education by Marriage Status in Adairville
| Educational Attainment | Married | Unmarried |
| Less than High School | 0 (0.0%) | 0 (0.0%) |
| High School Diploma | 3 (100.0%) | 0 (0.0%) |
| College or Associate's Degree | 0 (0.0%) | 0 (0.0%) |
| Bachelor's Degree | 0 (0.0%) | 0 (0.0%) |
| Graduate Degree | 0 (0.0%) | 0 (0.0%) |
| Total | 3 (100.0%) | 0 (0.0%) |
Employment Characteristics in Adairville
Employment by Class of Employer in Adairville
Among the 266 employed individuals in Adairville, private company employees (207 | 77.8%), self-employed (not incorporated) (36 | 13.5%), and not-for-profit organizations (11 | 4.1%) make up the most common classes of employment.
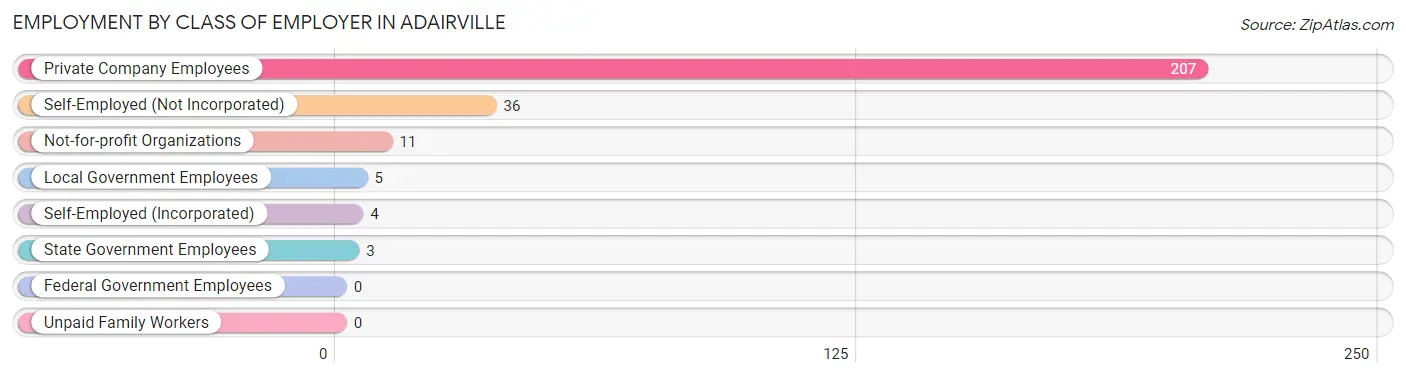
| Employer Class | # Employees | % Employees |
| Private Company Employees | 207 | 77.8% |
| Self-Employed (Incorporated) | 4 | 1.5% |
| Self-Employed (Not Incorporated) | 36 | 13.5% |
| Not-for-profit Organizations | 11 | 4.1% |
| Local Government Employees | 5 | 1.9% |
| State Government Employees | 3 | 1.1% |
| Federal Government Employees | 0 | 0.0% |
| Unpaid Family Workers | 0 | 0.0% |
| Total | 266 | 100.0% |
Employment Status by Age in Adairville
According to the labor force statistics for Adairville, out of the total population over 16 years of age (647), 45.9% or 297 individuals are in the labor force, with 4.0% or 12 of them unemployed. The age group with the highest labor force participation rate is 25 to 29 years, with 85.3% or 29 individuals in the labor force. Within the labor force, the 60 to 64 years age range has the highest percentage of unemployed individuals, with 20.0% or 6 of them being unemployed.
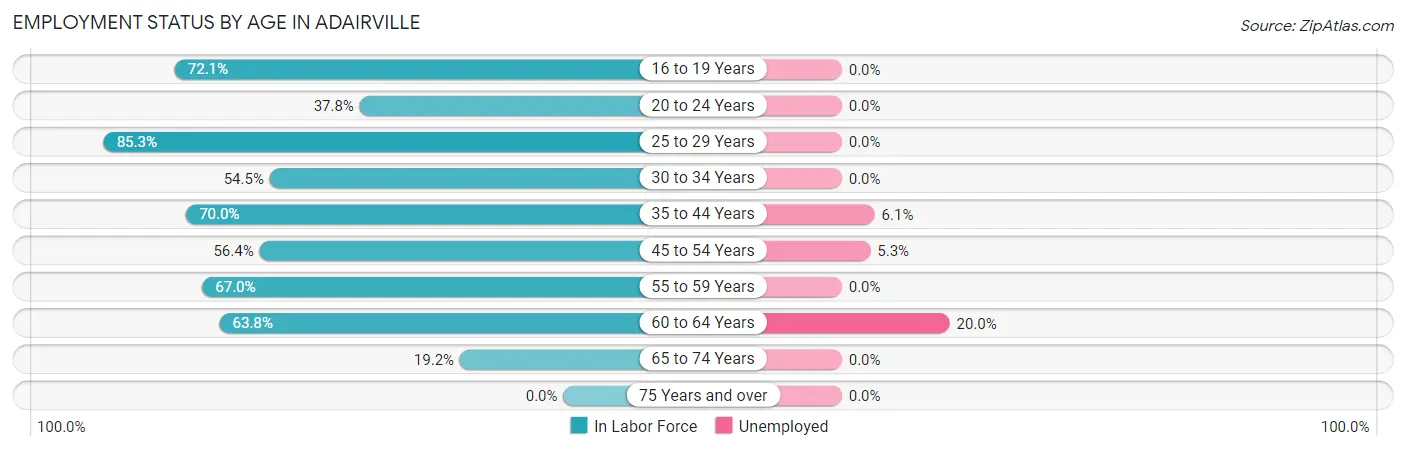
| Age Bracket | In Labor Force | Unemployed |
| 16 to 19 Years | 31 (72.1%) | 0 (0.0%) |
| 20 to 24 Years | 17 (37.8%) | 0 (0.0%) |
| 25 to 29 Years | 29 (85.3%) | 0 (0.0%) |
| 30 to 34 Years | 6 (54.5%) | 0 (0.0%) |
| 35 to 44 Years | 49 (70.0%) | 3 (6.1%) |
| 45 to 54 Years | 57 (56.4%) | 3 (5.3%) |
| 55 to 59 Years | 63 (67.0%) | 0 (0.0%) |
| 60 to 64 Years | 30 (63.8%) | 6 (20.0%) |
| 65 to 74 Years | 15 (19.2%) | 0 (0.0%) |
| 75 Years and over | 0 (0.0%) | 0 (0.0%) |
| Total | 297 (45.9%) | 12 (4.0%) |
Employment Status by Educational Attainment in Adairville
According to labor force statistics for Adairville, 65.5% of individuals (234) out of the total population between 25 and 64 years of age (357) are in the labor force, with 5.1% or 12 of them being unemployed. The group with the highest labor force participation rate are those with the educational attainment of bachelor's degree or higher, with 87.8% or 43 individuals in the labor force. Within the labor force, individuals with high school diploma education have the highest percentage of unemployment, with 11.1% or 9 of them being unemployed.
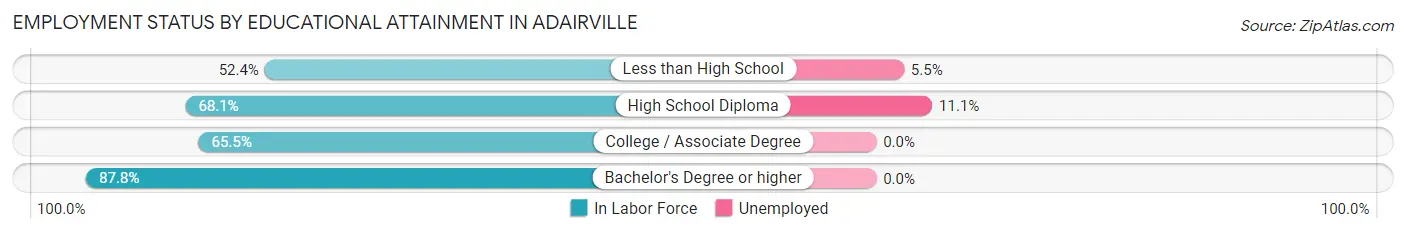
| Educational Attainment | In Labor Force | Unemployed |
| Less than High School | 55 (52.4%) | 6 (5.5%) |
| High School Diploma | 81 (68.1%) | 13 (11.1%) |
| College / Associate Degree | 55 (65.5%) | 0 (0.0%) |
| Bachelor's Degree or higher | 43 (87.8%) | 0 (0.0%) |
| Total | 234 (65.5%) | 18 (5.1%) |
Employment Occupations by Sex in Adairville
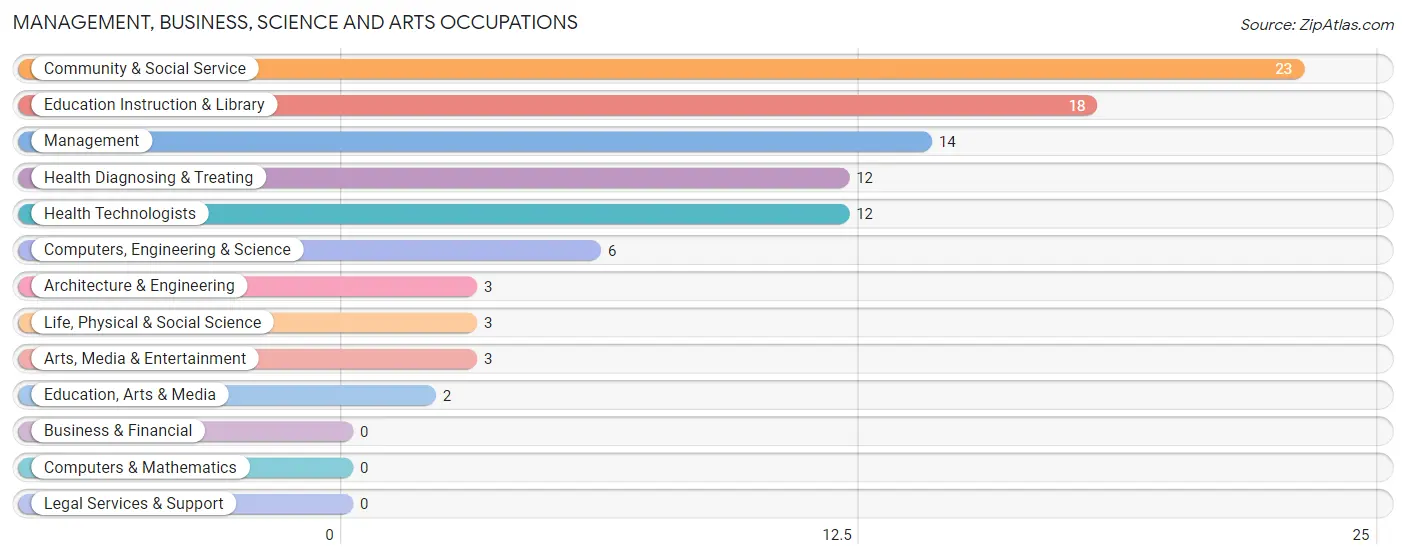
Management, Business, Science and Arts Occupations
The most common Management, Business, Science and Arts occupations in Adairville are Community & Social Service (23 | 8.1%), Education Instruction & Library (18 | 6.3%), Management (14 | 4.9%), Health Diagnosing & Treating (12 | 4.2%), and Health Technologists (12 | 4.2%).
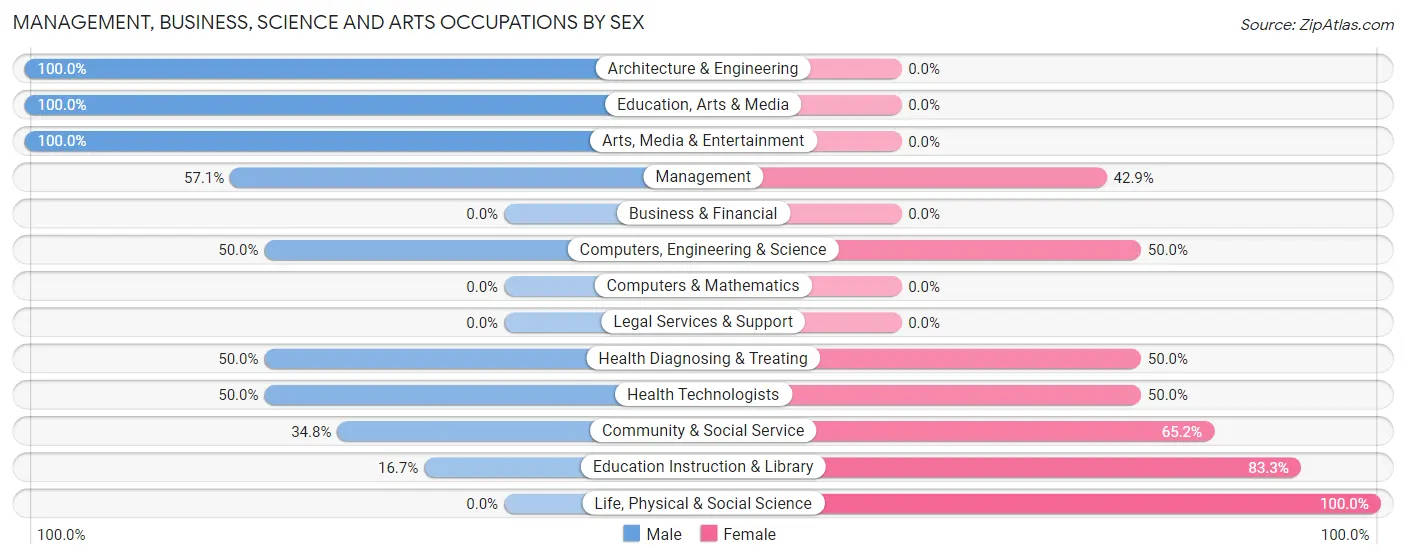
Management, Business, Science and Arts Occupations by Sex
Within the Management, Business, Science and Arts occupations in Adairville, the most male-oriented occupations are Architecture & Engineering (100.0%), Education, Arts & Media (100.0%), and Arts, Media & Entertainment (100.0%), while the most female-oriented occupations are Life, Physical & Social Science (100.0%), Education Instruction & Library (83.3%), and Community & Social Service (65.2%).
| Occupation | Male | Female |
| Management | 8 (57.1%) | 6 (42.9%) |
| Business & Financial | 0 (0.0%) | 0 (0.0%) |
| Computers, Engineering & Science | 3 (50.0%) | 3 (50.0%) |
| Computers & Mathematics | 0 (0.0%) | 0 (0.0%) |
| Architecture & Engineering | 3 (100.0%) | 0 (0.0%) |
| Life, Physical & Social Science | 0 (0.0%) | 3 (100.0%) |
| Community & Social Service | 8 (34.8%) | 15 (65.2%) |
| Education, Arts & Media | 2 (100.0%) | 0 (0.0%) |
| Legal Services & Support | 0 (0.0%) | 0 (0.0%) |
| Education Instruction & Library | 3 (16.7%) | 15 (83.3%) |
| Arts, Media & Entertainment | 3 (100.0%) | 0 (0.0%) |
| Health Diagnosing & Treating | 6 (50.0%) | 6 (50.0%) |
| Health Technologists | 6 (50.0%) | 6 (50.0%) |
| Total (Category) | 25 (45.5%) | 30 (54.5%) |
| Total (Overall) | 162 (56.8%) | 123 (43.2%) |
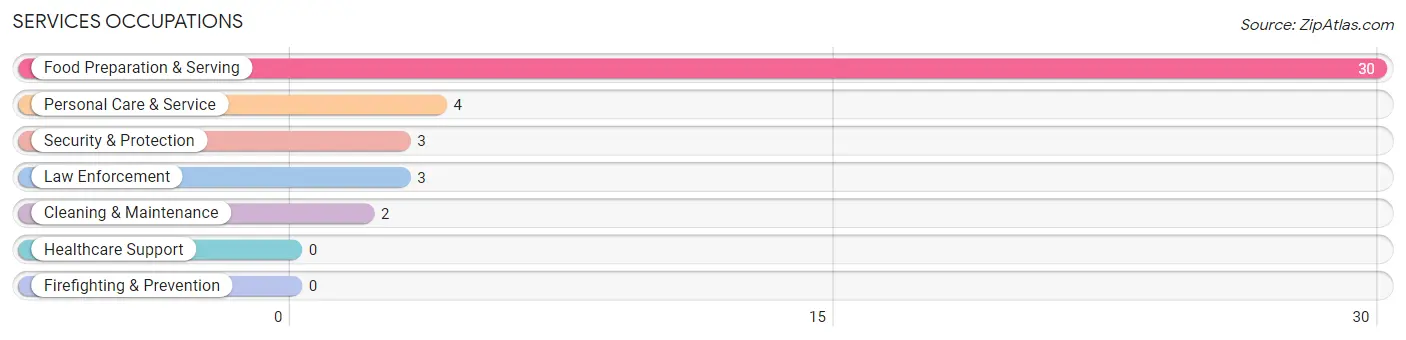
Services Occupations
The most common Services occupations in Adairville are Food Preparation & Serving (30 | 10.5%), Personal Care & Service (4 | 1.4%), Security & Protection (3 | 1.1%), Law Enforcement (3 | 1.1%), and Cleaning & Maintenance (2 | 0.7%).
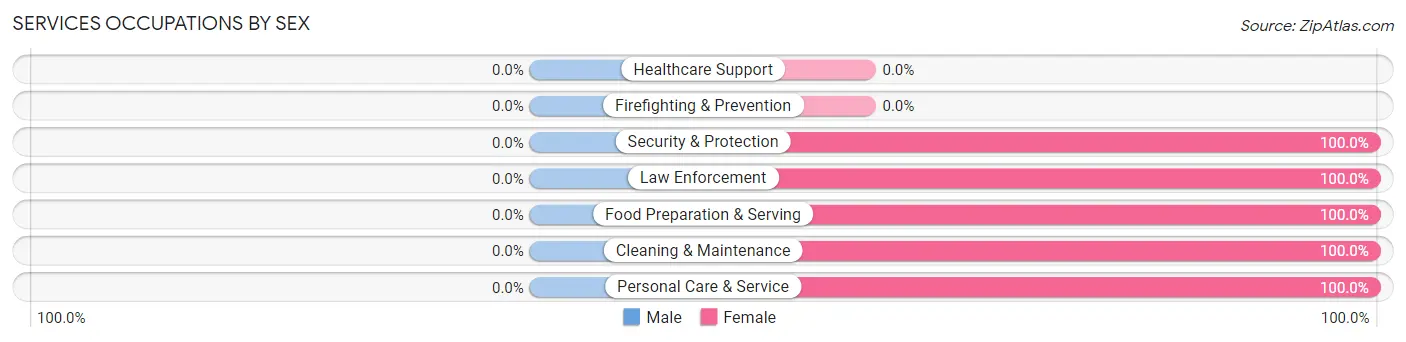
Services Occupations by Sex
| Occupation | Male | Female |
| Healthcare Support | 0 (0.0%) | 0 (0.0%) |
| Security & Protection | 0 (0.0%) | 3 (100.0%) |
| Firefighting & Prevention | 0 (0.0%) | 0 (0.0%) |
| Law Enforcement | 0 (0.0%) | 3 (100.0%) |
| Food Preparation & Serving | 0 (0.0%) | 30 (100.0%) |
| Cleaning & Maintenance | 0 (0.0%) | 2 (100.0%) |
| Personal Care & Service | 0 (0.0%) | 4 (100.0%) |
| Total (Category) | 0 (0.0%) | 39 (100.0%) |
| Total (Overall) | 162 (56.8%) | 123 (43.2%) |
Sales and Office Occupations
The most common Sales and Office occupations in Adairville are Sales & Related (42 | 14.7%), and Office & Administration (31 | 10.9%).
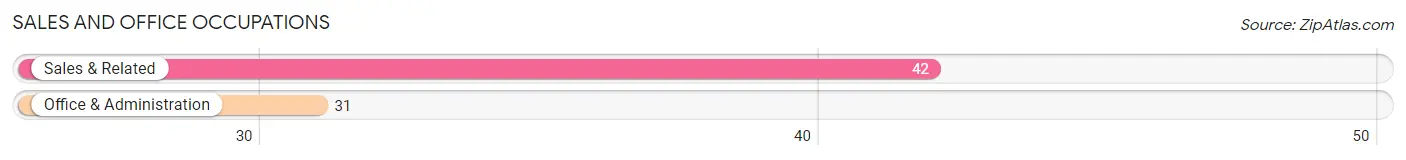
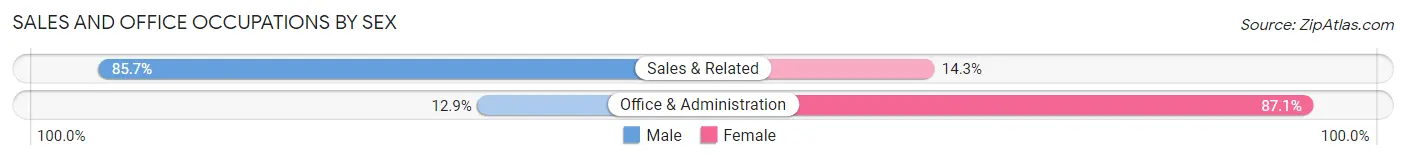
Sales and Office Occupations by Sex
| Occupation | Male | Female |
| Sales & Related | 36 (85.7%) | 6 (14.3%) |
| Office & Administration | 4 (12.9%) | 27 (87.1%) |
| Total (Category) | 40 (54.8%) | 33 (45.2%) |
| Total (Overall) | 162 (56.8%) | 123 (43.2%) |
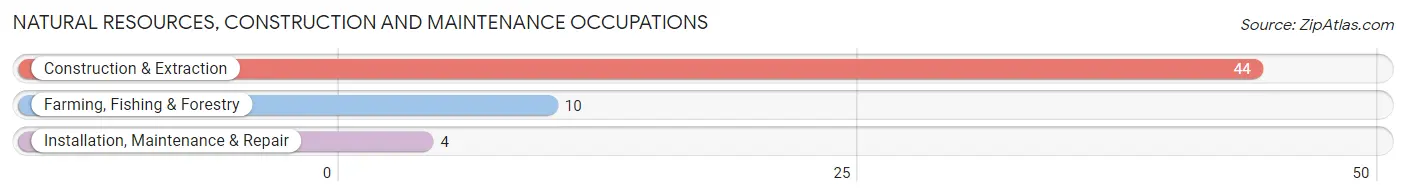
Natural Resources, Construction and Maintenance Occupations
The most common Natural Resources, Construction and Maintenance occupations in Adairville are Construction & Extraction (44 | 15.4%), Farming, Fishing & Forestry (10 | 3.5%), and Installation, Maintenance & Repair (4 | 1.4%).
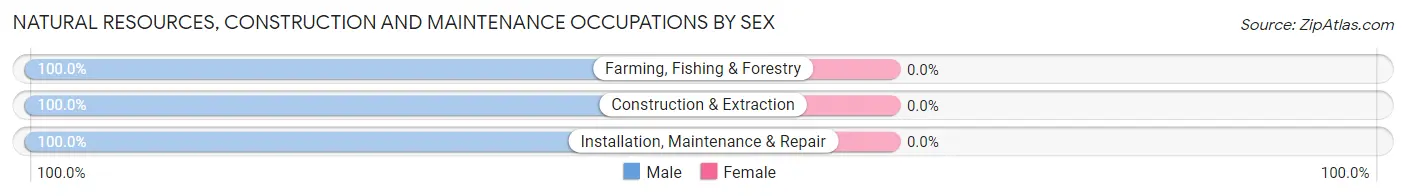
Natural Resources, Construction and Maintenance Occupations by Sex
| Occupation | Male | Female |
| Farming, Fishing & Forestry | 10 (100.0%) | 0 (0.0%) |
| Construction & Extraction | 44 (100.0%) | 0 (0.0%) |
| Installation, Maintenance & Repair | 4 (100.0%) | 0 (0.0%) |
| Total (Category) | 58 (100.0%) | 0 (0.0%) |
| Total (Overall) | 162 (56.8%) | 123 (43.2%) |
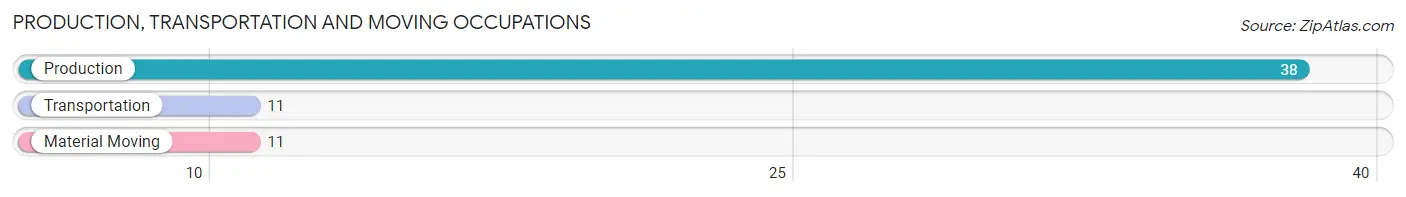
Production, Transportation and Moving Occupations
The most common Production, Transportation and Moving occupations in Adairville are Production (38 | 13.3%), Transportation (11 | 3.9%), and Material Moving (11 | 3.9%).
Production, Transportation and Moving Occupations by Sex
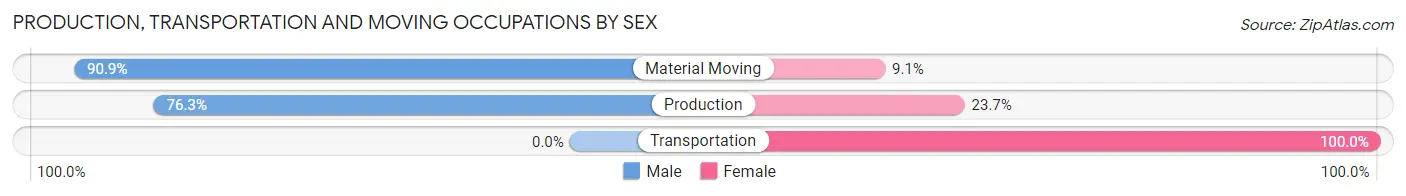
| Occupation | Male | Female |
| Production | 29 (76.3%) | 9 (23.7%) |
| Transportation | 0 (0.0%) | 11 (100.0%) |
| Material Moving | 10 (90.9%) | 1 (9.1%) |
| Total (Category) | 39 (65.0%) | 21 (35.0%) |
| Total (Overall) | 162 (56.8%) | 123 (43.2%) |
Employment Industries by Sex in Adairville
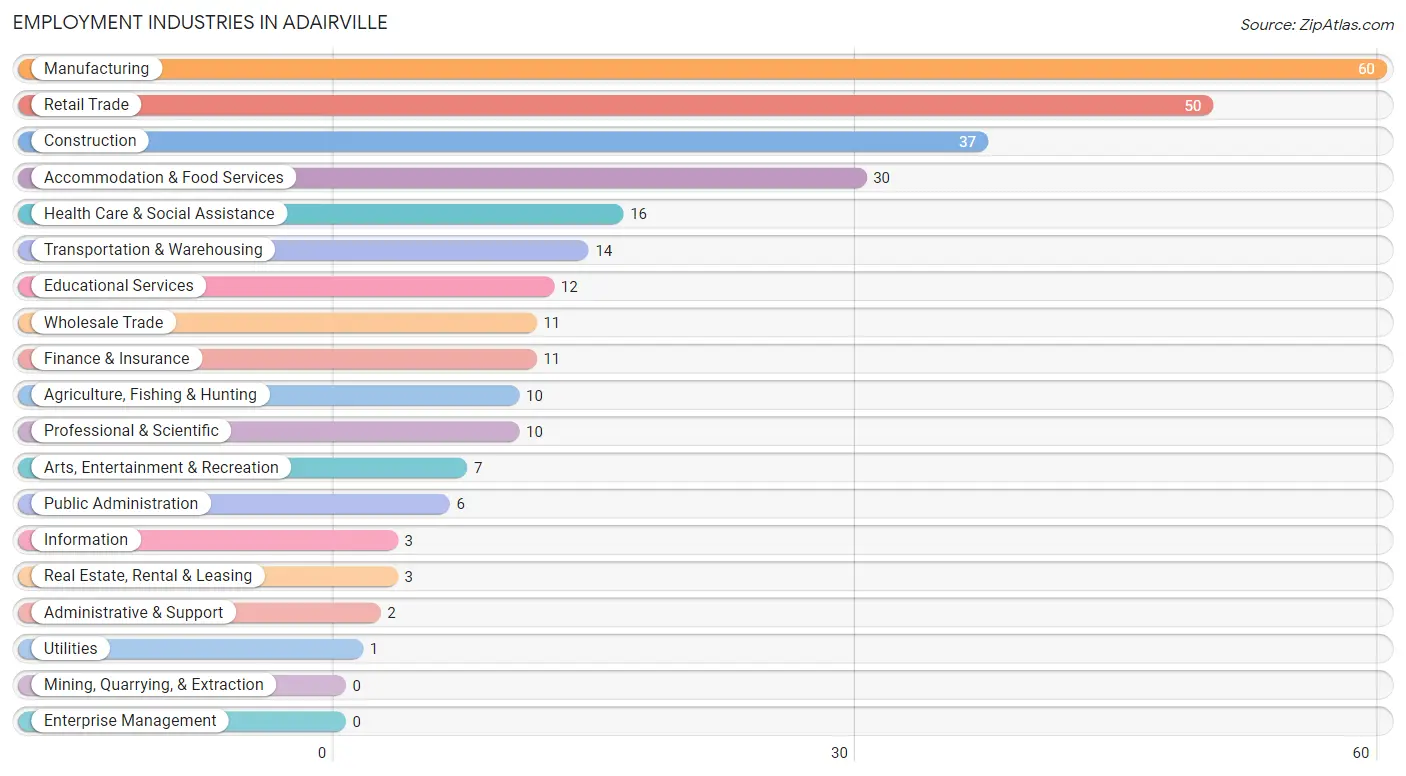
Employment Industries in Adairville
The major employment industries in Adairville include Manufacturing (60 | 21.0%), Retail Trade (50 | 17.5%), Construction (37 | 13.0%), Accommodation & Food Services (30 | 10.5%), and Health Care & Social Assistance (16 | 5.6%).
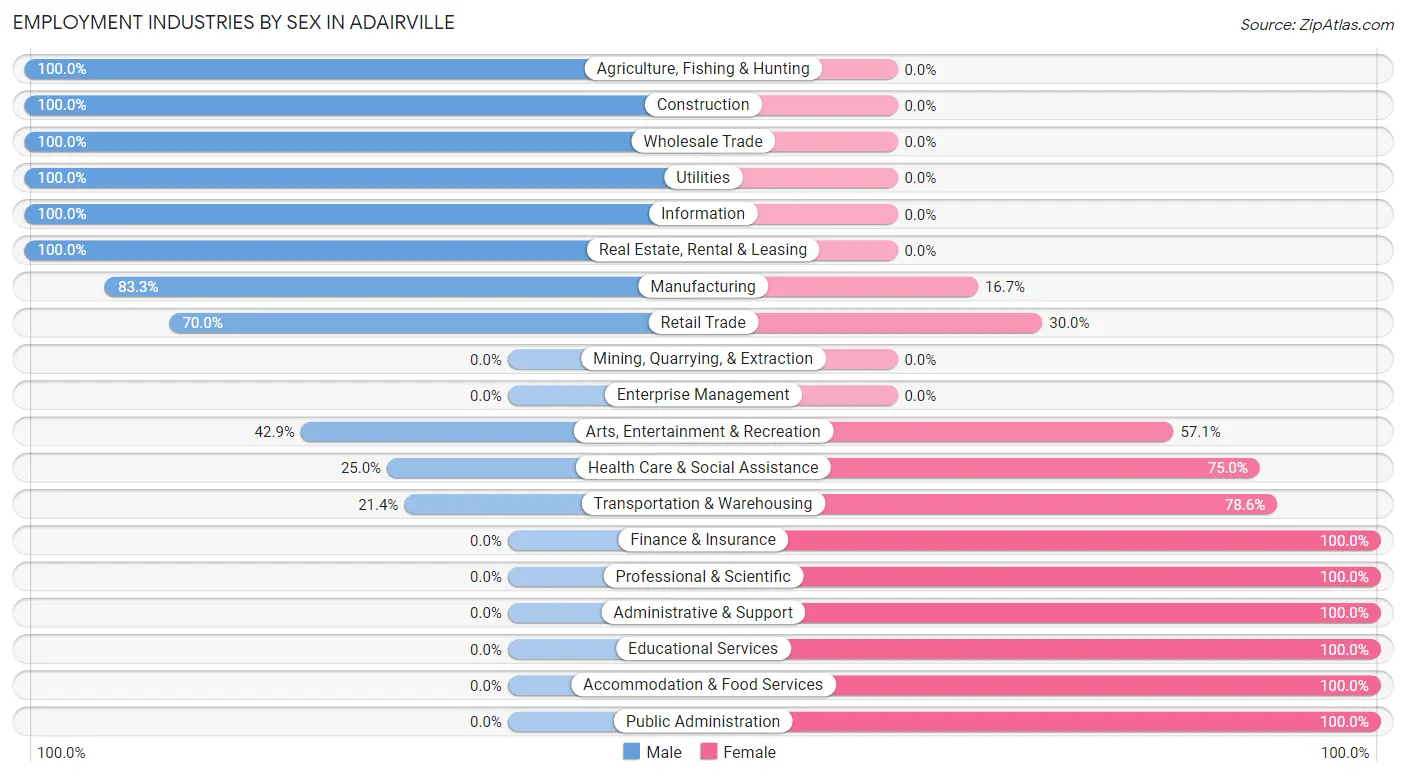
Employment Industries by Sex in Adairville
The Adairville industries that see more men than women are Agriculture, Fishing & Hunting (100.0%), Construction (100.0%), and Wholesale Trade (100.0%), whereas the industries that tend to have a higher number of women are Finance & Insurance (100.0%), Professional & Scientific (100.0%), and Administrative & Support (100.0%).
| Industry | Male | Female |
| Agriculture, Fishing & Hunting | 10 (100.0%) | 0 (0.0%) |
| Mining, Quarrying, & Extraction | 0 (0.0%) | 0 (0.0%) |
| Construction | 37 (100.0%) | 0 (0.0%) |
| Manufacturing | 50 (83.3%) | 10 (16.7%) |
| Wholesale Trade | 11 (100.0%) | 0 (0.0%) |
| Retail Trade | 35 (70.0%) | 15 (30.0%) |
| Transportation & Warehousing | 3 (21.4%) | 11 (78.6%) |
| Utilities | 1 (100.0%) | 0 (0.0%) |
| Information | 3 (100.0%) | 0 (0.0%) |
| Finance & Insurance | 0 (0.0%) | 11 (100.0%) |
| Real Estate, Rental & Leasing | 3 (100.0%) | 0 (0.0%) |
| Professional & Scientific | 0 (0.0%) | 10 (100.0%) |
| Enterprise Management | 0 (0.0%) | 0 (0.0%) |
| Administrative & Support | 0 (0.0%) | 2 (100.0%) |
| Educational Services | 0 (0.0%) | 12 (100.0%) |
| Health Care & Social Assistance | 4 (25.0%) | 12 (75.0%) |
| Arts, Entertainment & Recreation | 3 (42.9%) | 4 (57.1%) |
| Accommodation & Food Services | 0 (0.0%) | 30 (100.0%) |
| Public Administration | 0 (0.0%) | 6 (100.0%) |
| Total | 162 (56.8%) | 123 (43.2%) |
Education in Adairville
School Enrollment in Adairville
The most common levels of schooling among the 140 students in Adairville are elementary school (38 | 27.1%), college / undergraduate (33 | 23.6%), and high school (28 | 20.0%).
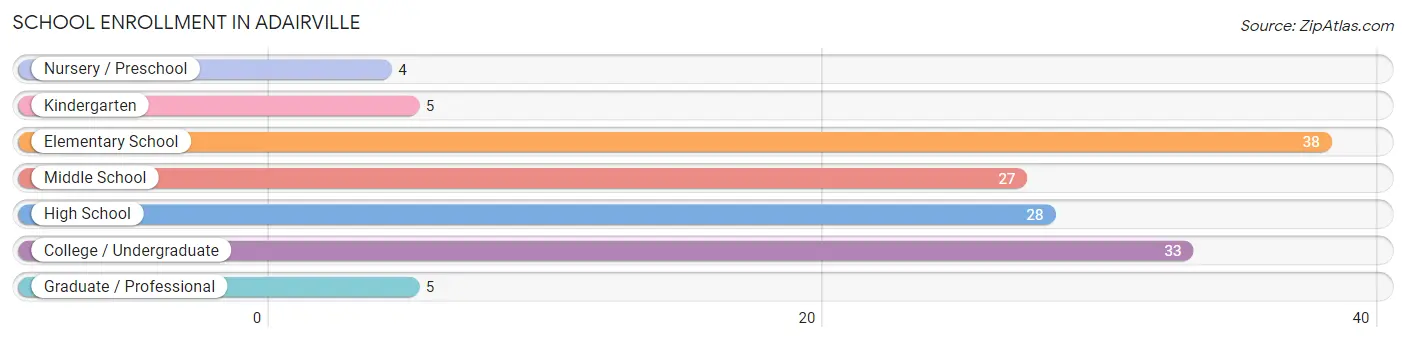
| School Level | # Students | % Students |
| Nursery / Preschool | 4 | 2.9% |
| Kindergarten | 5 | 3.6% |
| Elementary School | 38 | 27.1% |
| Middle School | 27 | 19.3% |
| High School | 28 | 20.0% |
| College / Undergraduate | 33 | 23.6% |
| Graduate / Professional | 5 | 3.6% |
| Total | 140 | 100.0% |
School Enrollment by Age by Funding Source in Adairville
Out of a total of 140 students who are enrolled in schools in Adairville, 12 (8.6%) attend a private institution, while the remaining 128 (91.4%) are enrolled in public schools. The age group of 15 to 17 year olds has the highest likelihood of being enrolled in private schools, with 10 (62.5% in the age bracket) enrolled. Conversely, the age group of 3 to 4 year olds has the lowest likelihood of being enrolled in a private school, with 3 (100.0% in the age bracket) attending a public institution.
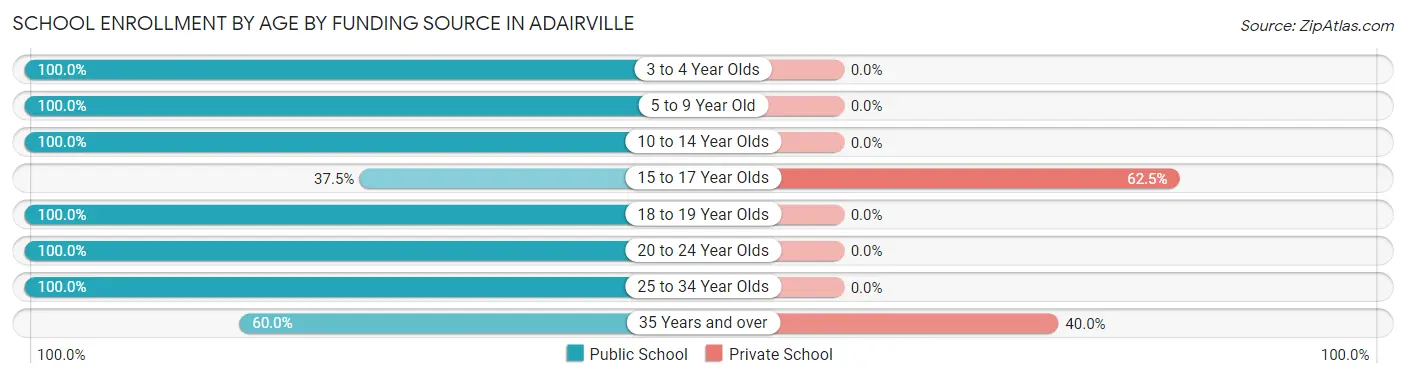
| Age Bracket | Public School | Private School |
| 3 to 4 Year Olds | 3 (100.0%) | 0 (0.0%) |
| 5 to 9 Year Old | 44 (100.0%) | 0 (0.0%) |
| 10 to 14 Year Olds | 31 (100.0%) | 0 (0.0%) |
| 15 to 17 Year Olds | 6 (37.5%) | 10 (62.5%) |
| 18 to 19 Year Olds | 31 (100.0%) | 0 (0.0%) |
| 20 to 24 Year Olds | 7 (100.0%) | 0 (0.0%) |
| 25 to 34 Year Olds | 3 (100.0%) | 0 (0.0%) |
| 35 Years and over | 3 (60.0%) | 2 (40.0%) |
| Total | 128 (91.4%) | 12 (8.6%) |
Educational Attainment by Field of Study in Adairville
Business (17 | 25.4%), visual & performing arts (13 | 19.4%), education (8 | 11.9%), liberal arts & history (8 | 11.9%), and physical & health sciences (6 | 9.0%) are the most common fields of study among 67 individuals in Adairville who have obtained a bachelor's degree or higher.
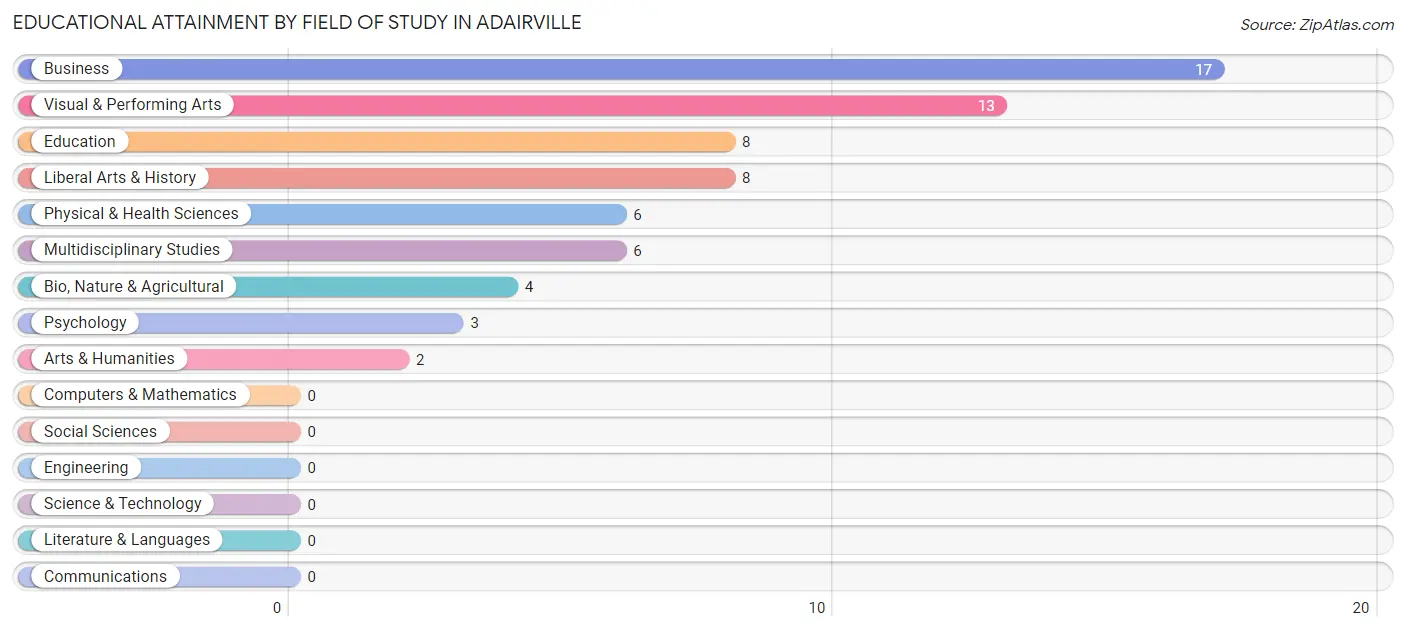
| Field of Study | # Graduates | % Graduates |
| Computers & Mathematics | 0 | 0.0% |
| Bio, Nature & Agricultural | 4 | 6.0% |
| Physical & Health Sciences | 6 | 9.0% |
| Psychology | 3 | 4.5% |
| Social Sciences | 0 | 0.0% |
| Engineering | 0 | 0.0% |
| Multidisciplinary Studies | 6 | 9.0% |
| Science & Technology | 0 | 0.0% |
| Business | 17 | 25.4% |
| Education | 8 | 11.9% |
| Literature & Languages | 0 | 0.0% |
| Liberal Arts & History | 8 | 11.9% |
| Visual & Performing Arts | 13 | 19.4% |
| Communications | 0 | 0.0% |
| Arts & Humanities | 2 | 3.0% |
| Total | 67 | 100.0% |
Transportation & Commute in Adairville
Vehicle Availability by Sex in Adairville
The most prevalent vehicle ownership categories in Adairville are males with 2 vehicles (65, accounting for 40.1%) and females with 2 vehicles (35, making up 62.5%).
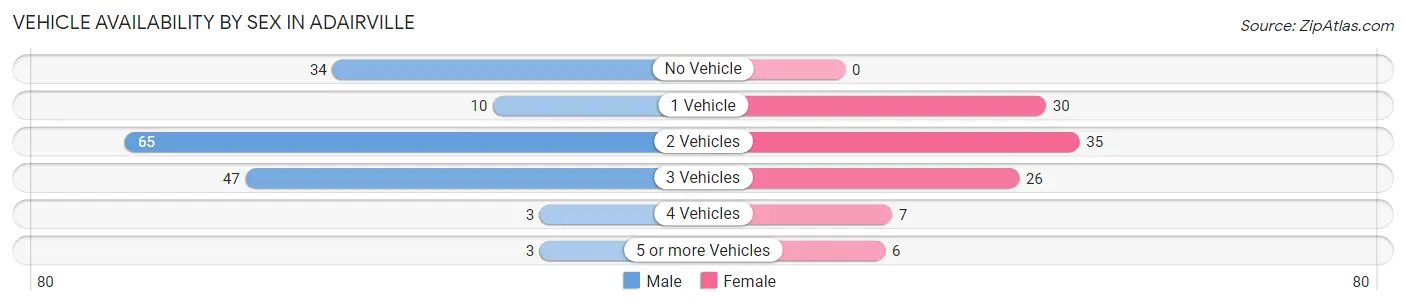
| Vehicles Available | Male | Female |
| No Vehicle | 34 (21.0%) | 0 (0.0%) |
| 1 Vehicle | 10 (6.2%) | 30 (28.8%) |
| 2 Vehicles | 65 (40.1%) | 35 (33.7%) |
| 3 Vehicles | 47 (29.0%) | 26 (25.0%) |
| 4 Vehicles | 3 (1.8%) | 7 (6.7%) |
| 5 or more Vehicles | 3 (1.8%) | 6 (5.8%) |
| Total | 162 (100.0%) | 104 (100.0%) |
Commute Time in Adairville
The most frequently occuring commute durations in Adairville are 20 to 24 minutes (53 commuters, 21.1%), 45 to 59 minutes (51 commuters, 20.3%), and less than 5 minutes (29 commuters, 11.6%).
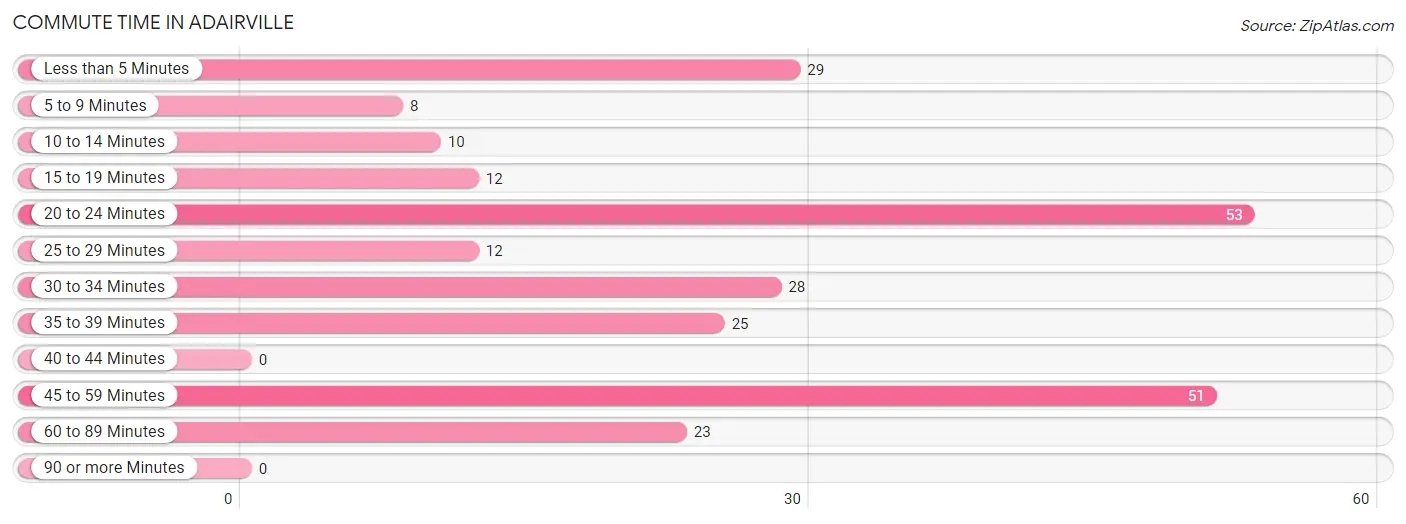
| Commute Time | # Commuters | % Commuters |
| Less than 5 Minutes | 29 | 11.6% |
| 5 to 9 Minutes | 8 | 3.2% |
| 10 to 14 Minutes | 10 | 4.0% |
| 15 to 19 Minutes | 12 | 4.8% |
| 20 to 24 Minutes | 53 | 21.1% |
| 25 to 29 Minutes | 12 | 4.8% |
| 30 to 34 Minutes | 28 | 11.2% |
| 35 to 39 Minutes | 25 | 10.0% |
| 40 to 44 Minutes | 0 | 0.0% |
| 45 to 59 Minutes | 51 | 20.3% |
| 60 to 89 Minutes | 23 | 9.2% |
| 90 or more Minutes | 0 | 0.0% |
Commute Time by Sex in Adairville
The most common commute times in Adairville are 20 to 24 minutes (35 commuters, 22.3%) for males and 45 to 59 minutes (20 commuters, 21.3%) for females.
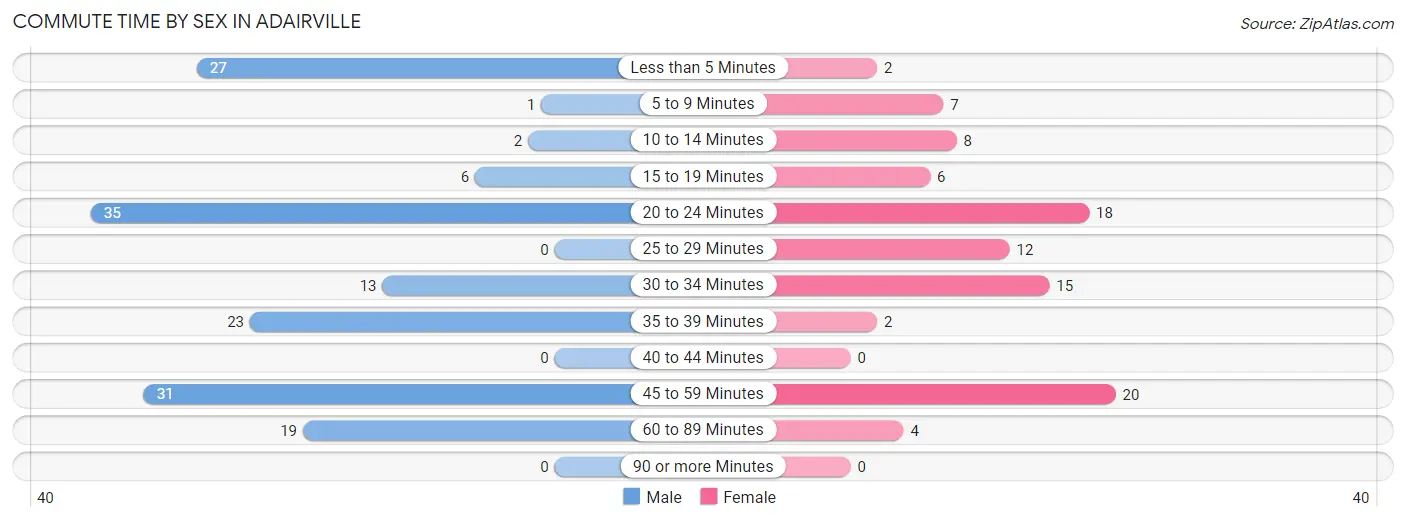
| Commute Time | Male | Female |
| Less than 5 Minutes | 27 (17.2%) | 2 (2.1%) |
| 5 to 9 Minutes | 1 (0.6%) | 7 (7.4%) |
| 10 to 14 Minutes | 2 (1.3%) | 8 (8.5%) |
| 15 to 19 Minutes | 6 (3.8%) | 6 (6.4%) |
| 20 to 24 Minutes | 35 (22.3%) | 18 (19.2%) |
| 25 to 29 Minutes | 0 (0.0%) | 12 (12.8%) |
| 30 to 34 Minutes | 13 (8.3%) | 15 (16.0%) |
| 35 to 39 Minutes | 23 (14.6%) | 2 (2.1%) |
| 40 to 44 Minutes | 0 (0.0%) | 0 (0.0%) |
| 45 to 59 Minutes | 31 (19.8%) | 20 (21.3%) |
| 60 to 89 Minutes | 19 (12.1%) | 4 (4.3%) |
| 90 or more Minutes | 0 (0.0%) | 0 (0.0%) |
Time of Departure to Work by Sex in Adairville
The most frequent times of departure to work in Adairville are 7:00 AM to 7:29 AM (44, 28.0%) for males and 7:30 AM to 7:59 AM (29, 30.8%) for females.
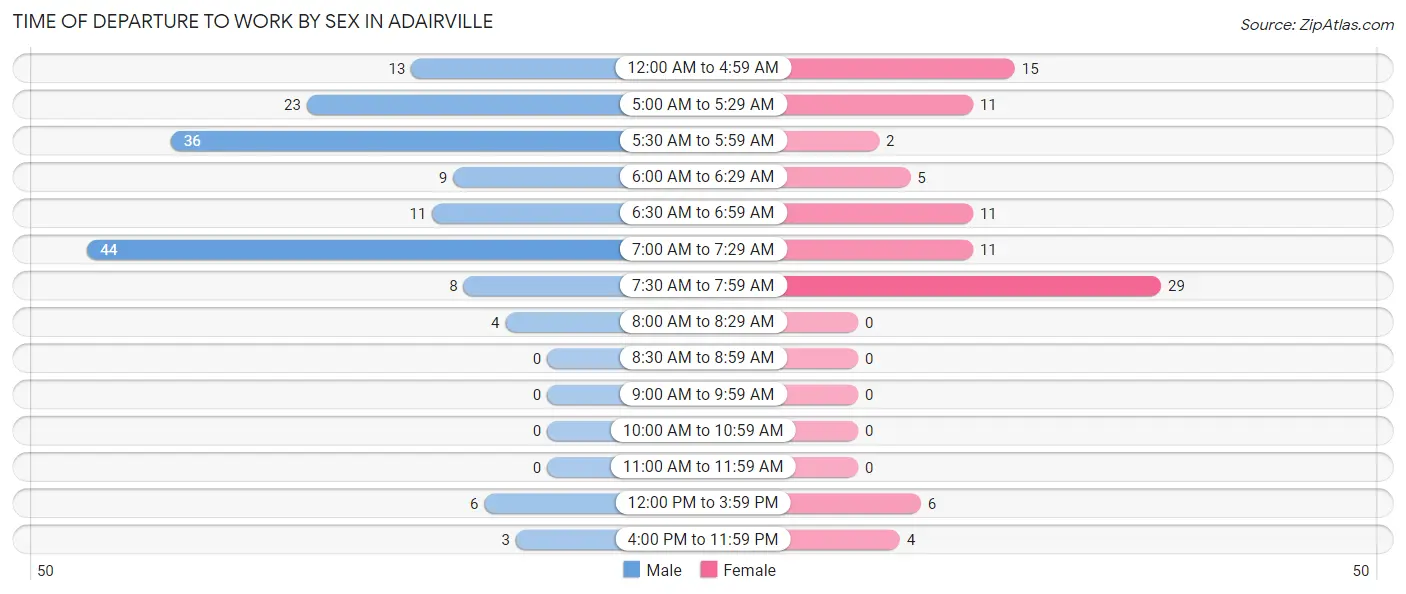
| Time of Departure | Male | Female |
| 12:00 AM to 4:59 AM | 13 (8.3%) | 15 (16.0%) |
| 5:00 AM to 5:29 AM | 23 (14.6%) | 11 (11.7%) |
| 5:30 AM to 5:59 AM | 36 (22.9%) | 2 (2.1%) |
| 6:00 AM to 6:29 AM | 9 (5.7%) | 5 (5.3%) |
| 6:30 AM to 6:59 AM | 11 (7.0%) | 11 (11.7%) |
| 7:00 AM to 7:29 AM | 44 (28.0%) | 11 (11.7%) |
| 7:30 AM to 7:59 AM | 8 (5.1%) | 29 (30.8%) |
| 8:00 AM to 8:29 AM | 4 (2.5%) | 0 (0.0%) |
| 8:30 AM to 8:59 AM | 0 (0.0%) | 0 (0.0%) |
| 9:00 AM to 9:59 AM | 0 (0.0%) | 0 (0.0%) |
| 10:00 AM to 10:59 AM | 0 (0.0%) | 0 (0.0%) |
| 11:00 AM to 11:59 AM | 0 (0.0%) | 0 (0.0%) |
| 12:00 PM to 3:59 PM | 6 (3.8%) | 6 (6.4%) |
| 4:00 PM to 11:59 PM | 3 (1.9%) | 4 (4.3%) |
| Total | 157 (100.0%) | 94 (100.0%) |
Housing Occupancy in Adairville
Occupancy by Ownership in Adairville
Of the total 360 dwellings in Adairville, owner-occupied units account for 178 (49.4%), while renter-occupied units make up 182 (50.6%).
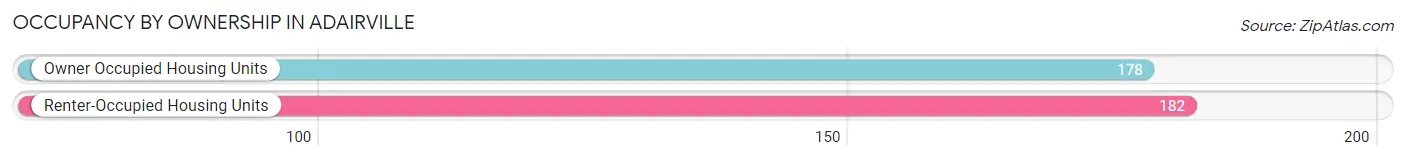
| Occupancy | # Housing Units | % Housing Units |
| Owner Occupied Housing Units | 178 | 49.4% |
| Renter-Occupied Housing Units | 182 | 50.6% |
| Total Occupied Housing Units | 360 | 100.0% |
Occupancy by Household Size in Adairville
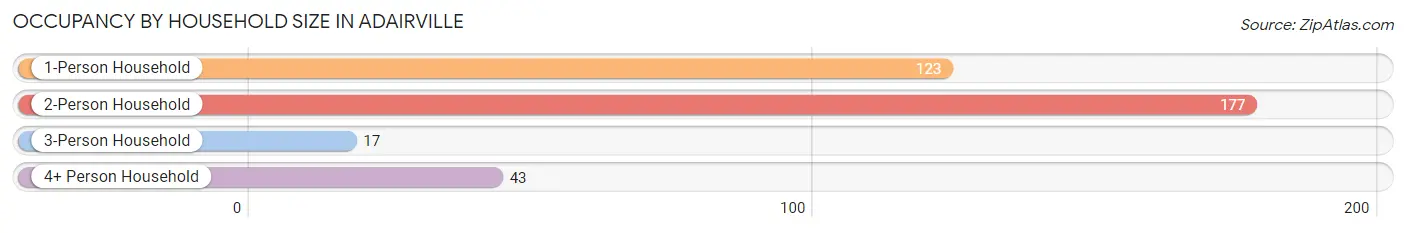
| Household Size | # Housing Units | % Housing Units |
| 1-Person Household | 123 | 34.2% |
| 2-Person Household | 177 | 49.2% |
| 3-Person Household | 17 | 4.7% |
| 4+ Person Household | 43 | 11.9% |
| Total Housing Units | 360 | 100.0% |
Occupancy by Ownership by Household Size in Adairville
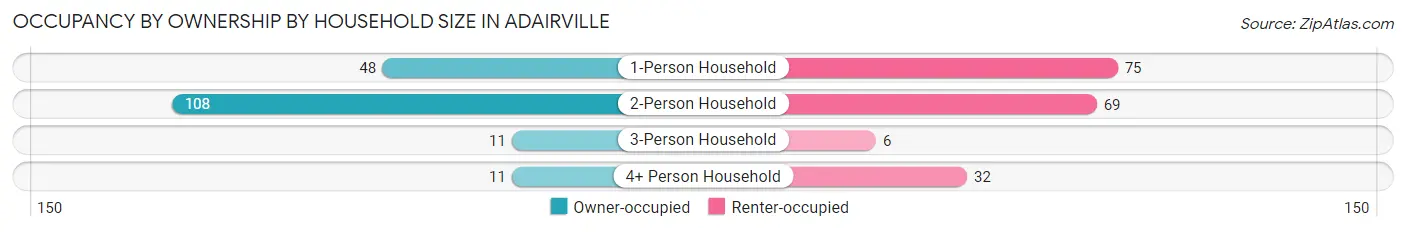
| Household Size | Owner-occupied | Renter-occupied |
| 1-Person Household | 48 (39.0%) | 75 (61.0%) |
| 2-Person Household | 108 (61.0%) | 69 (39.0%) |
| 3-Person Household | 11 (64.7%) | 6 (35.3%) |
| 4+ Person Household | 11 (25.6%) | 32 (74.4%) |
| Total Housing Units | 178 (49.4%) | 182 (50.6%) |
Occupancy by Educational Attainment in Adairville
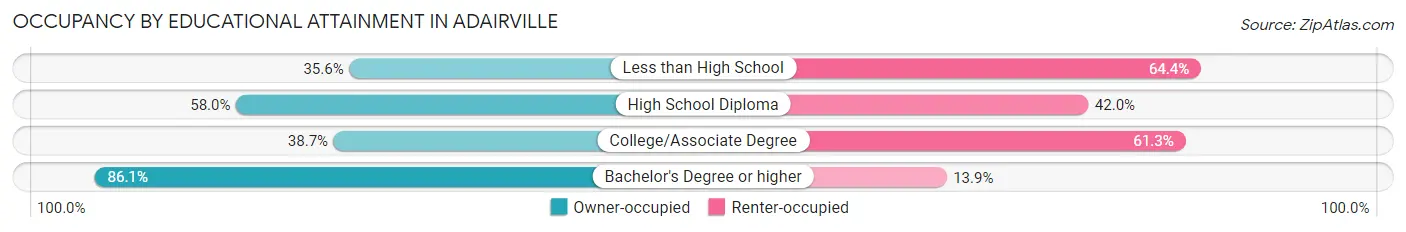
| Household Size | Owner-occupied | Renter-occupied |
| Less than High School | 42 (35.6%) | 76 (64.4%) |
| High School Diploma | 76 (58.0%) | 55 (42.0%) |
| College/Associate Degree | 29 (38.7%) | 46 (61.3%) |
| Bachelor's Degree or higher | 31 (86.1%) | 5 (13.9%) |
Occupancy by Age of Householder in Adairville
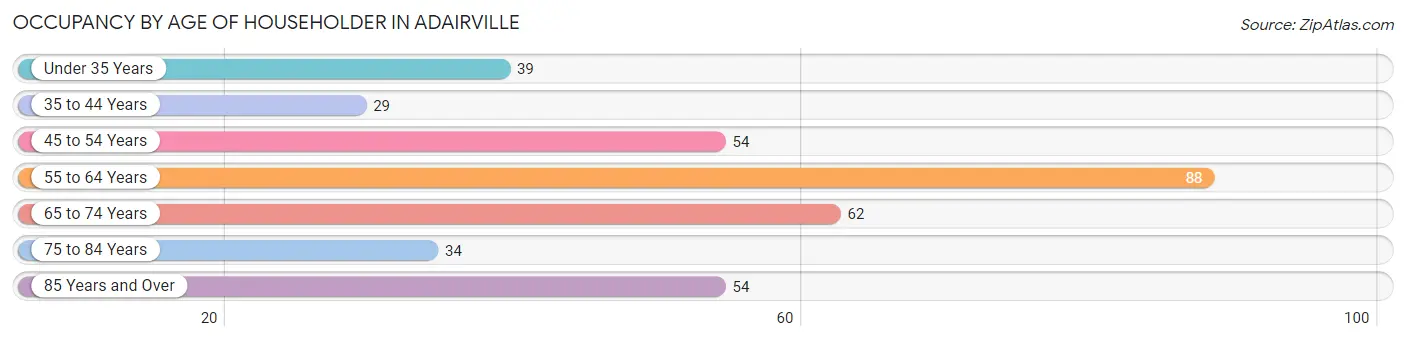
| Age Bracket | # Households | % Households |
| Under 35 Years | 39 | 10.8% |
| 35 to 44 Years | 29 | 8.1% |
| 45 to 54 Years | 54 | 15.0% |
| 55 to 64 Years | 88 | 24.4% |
| 65 to 74 Years | 62 | 17.2% |
| 75 to 84 Years | 34 | 9.4% |
| 85 Years and Over | 54 | 15.0% |
| Total | 360 | 100.0% |
Housing Finances in Adairville
Median Income by Occupancy in Adairville
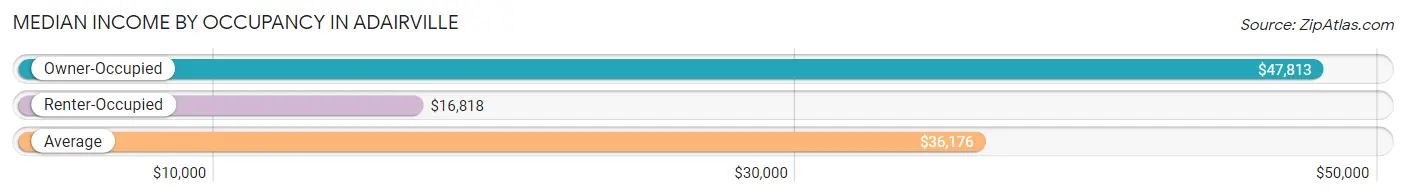
| Occupancy Type | # Households | Median Income |
| Owner-Occupied | 178 (49.4%) | $47,813 |
| Renter-Occupied | 182 (50.6%) | $16,818 |
| Average | 360 (100.0%) | $36,176 |
Occupancy by Householder Income Bracket in Adairville
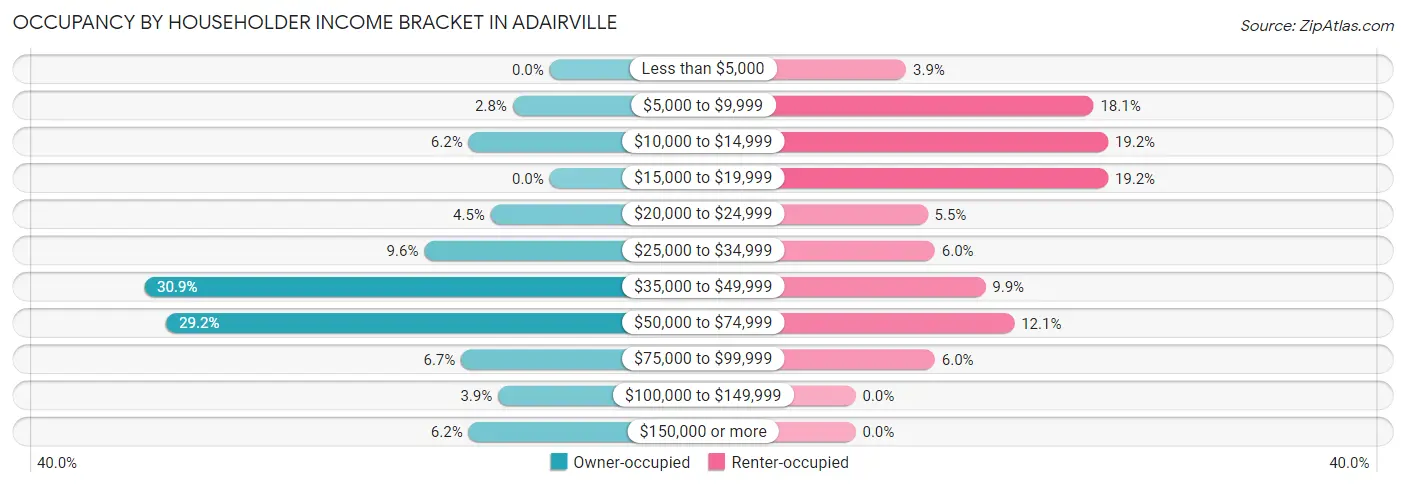
| Income Bracket | Owner-occupied | Renter-occupied |
| Less than $5,000 | 0 (0.0%) | 7 (3.8%) |
| $5,000 to $9,999 | 5 (2.8%) | 33 (18.1%) |
| $10,000 to $14,999 | 11 (6.2%) | 35 (19.2%) |
| $15,000 to $19,999 | 0 (0.0%) | 35 (19.2%) |
| $20,000 to $24,999 | 8 (4.5%) | 10 (5.5%) |
| $25,000 to $34,999 | 17 (9.6%) | 11 (6.0%) |
| $35,000 to $49,999 | 55 (30.9%) | 18 (9.9%) |
| $50,000 to $74,999 | 52 (29.2%) | 22 (12.1%) |
| $75,000 to $99,999 | 12 (6.7%) | 11 (6.0%) |
| $100,000 to $149,999 | 7 (3.9%) | 0 (0.0%) |
| $150,000 or more | 11 (6.2%) | 0 (0.0%) |
| Total | 178 (100.0%) | 182 (100.0%) |
Monthly Housing Cost Tiers in Adairville
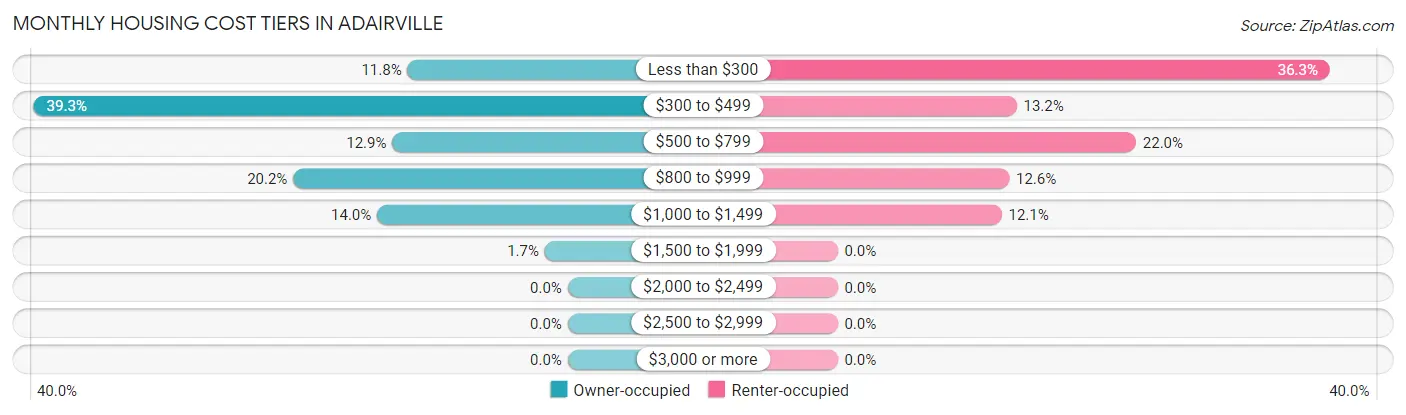
| Monthly Cost | Owner-occupied | Renter-occupied |
| Less than $300 | 21 (11.8%) | 66 (36.3%) |
| $300 to $499 | 70 (39.3%) | 24 (13.2%) |
| $500 to $799 | 23 (12.9%) | 40 (22.0%) |
| $800 to $999 | 36 (20.2%) | 23 (12.6%) |
| $1,000 to $1,499 | 25 (14.0%) | 22 (12.1%) |
| $1,500 to $1,999 | 3 (1.7%) | 0 (0.0%) |
| $2,000 to $2,499 | 0 (0.0%) | 0 (0.0%) |
| $2,500 to $2,999 | 0 (0.0%) | 0 (0.0%) |
| $3,000 or more | 0 (0.0%) | 0 (0.0%) |
| Total | 178 (100.0%) | 182 (100.0%) |
Physical Housing Characteristics in Adairville
Housing Structures in Adairville
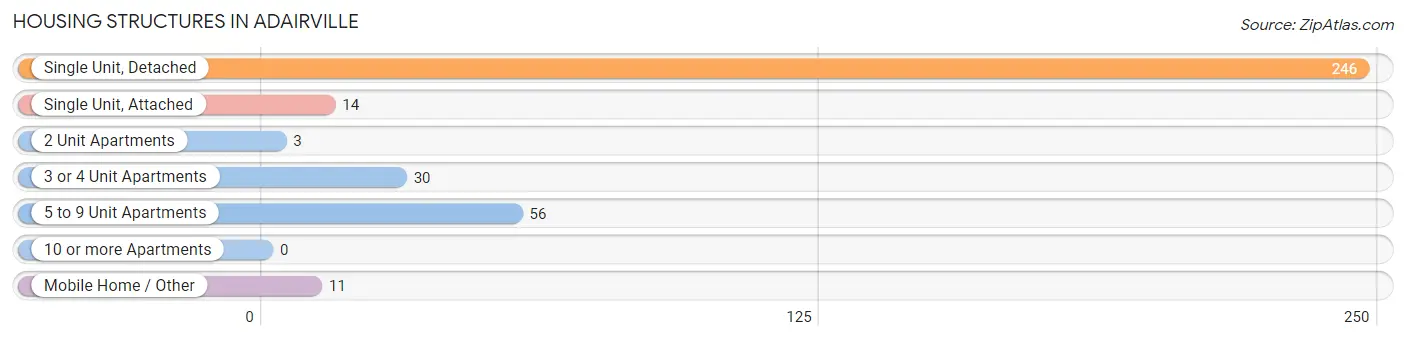
| Structure Type | # Housing Units | % Housing Units |
| Single Unit, Detached | 246 | 68.3% |
| Single Unit, Attached | 14 | 3.9% |
| 2 Unit Apartments | 3 | 0.8% |
| 3 or 4 Unit Apartments | 30 | 8.3% |
| 5 to 9 Unit Apartments | 56 | 15.6% |
| 10 or more Apartments | 0 | 0.0% |
| Mobile Home / Other | 11 | 3.1% |
| Total | 360 | 100.0% |
Housing Structures by Occupancy in Adairville
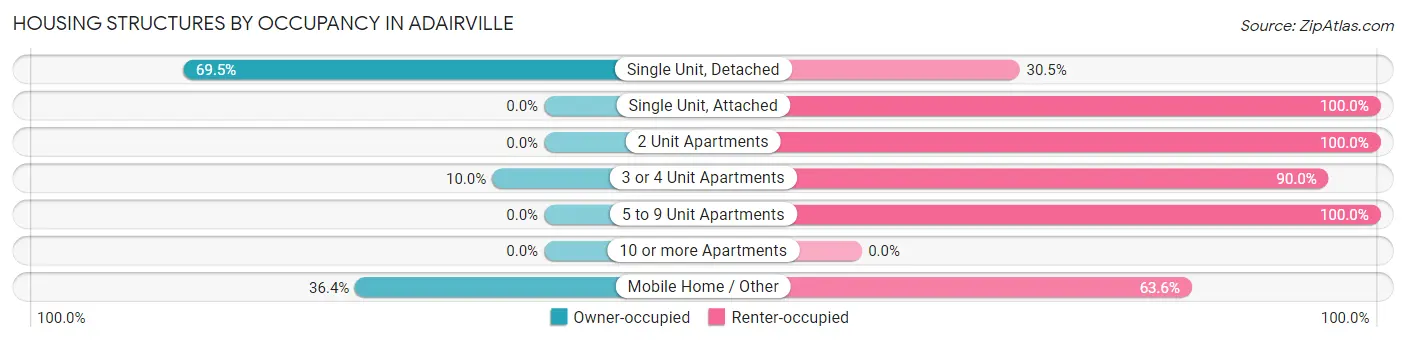
| Structure Type | Owner-occupied | Renter-occupied |
| Single Unit, Detached | 171 (69.5%) | 75 (30.5%) |
| Single Unit, Attached | 0 (0.0%) | 14 (100.0%) |
| 2 Unit Apartments | 0 (0.0%) | 3 (100.0%) |
| 3 or 4 Unit Apartments | 3 (10.0%) | 27 (90.0%) |
| 5 to 9 Unit Apartments | 0 (0.0%) | 56 (100.0%) |
| 10 or more Apartments | 0 (0.0%) | 0 (0.0%) |
| Mobile Home / Other | 4 (36.4%) | 7 (63.6%) |
| Total | 178 (49.4%) | 182 (50.6%) |
Housing Structures by Number of Rooms in Adairville
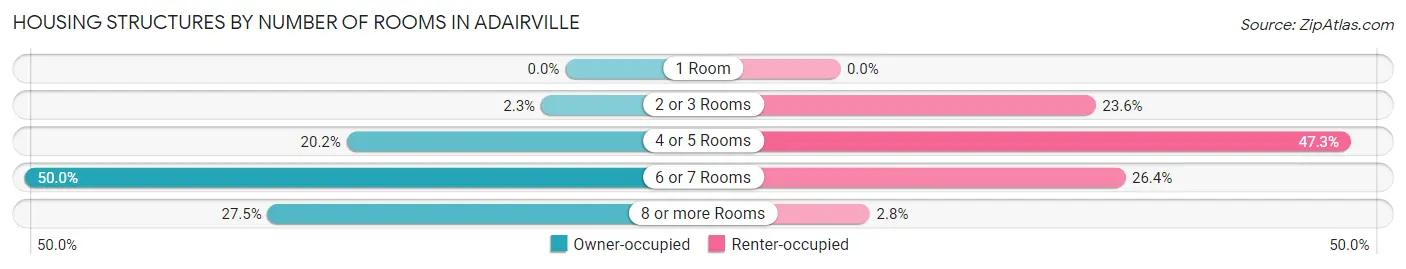
| Number of Rooms | Owner-occupied | Renter-occupied |
| 1 Room | 0 (0.0%) | 0 (0.0%) |
| 2 or 3 Rooms | 4 (2.2%) | 43 (23.6%) |
| 4 or 5 Rooms | 36 (20.2%) | 86 (47.2%) |
| 6 or 7 Rooms | 89 (50.0%) | 48 (26.4%) |
| 8 or more Rooms | 49 (27.5%) | 5 (2.8%) |
| Total | 178 (100.0%) | 182 (100.0%) |
Housing Structure by Heating Type in Adairville
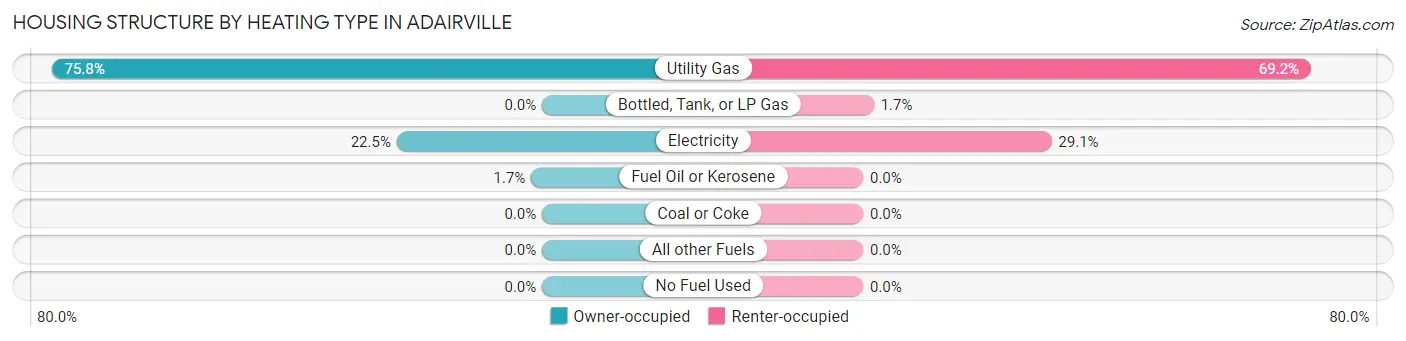
| Heating Type | Owner-occupied | Renter-occupied |
| Utility Gas | 135 (75.8%) | 126 (69.2%) |
| Bottled, Tank, or LP Gas | 0 (0.0%) | 3 (1.7%) |
| Electricity | 40 (22.5%) | 53 (29.1%) |
| Fuel Oil or Kerosene | 3 (1.7%) | 0 (0.0%) |
| Coal or Coke | 0 (0.0%) | 0 (0.0%) |
| All other Fuels | 0 (0.0%) | 0 (0.0%) |
| No Fuel Used | 0 (0.0%) | 0 (0.0%) |
| Total | 178 (100.0%) | 182 (100.0%) |
Household Vehicle Usage in Adairville
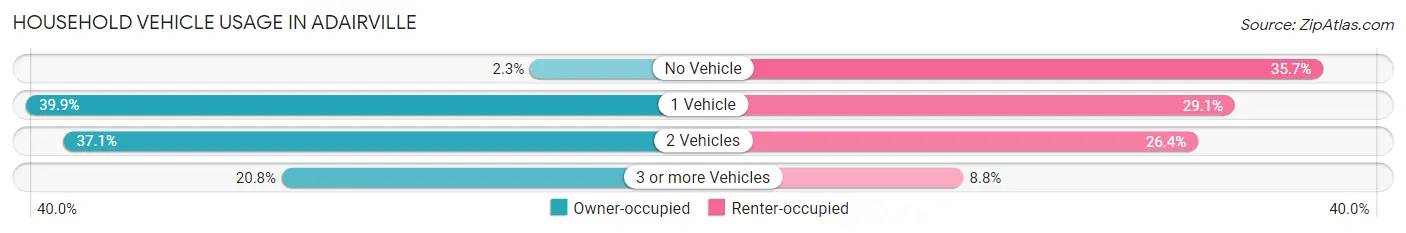
| Vehicles per Household | Owner-occupied | Renter-occupied |
| No Vehicle | 4 (2.2%) | 65 (35.7%) |
| 1 Vehicle | 71 (39.9%) | 53 (29.1%) |
| 2 Vehicles | 66 (37.1%) | 48 (26.4%) |
| 3 or more Vehicles | 37 (20.8%) | 16 (8.8%) |
| Total | 178 (100.0%) | 182 (100.0%) |
Real Estate & Mortgages in Adairville
Real Estate and Mortgage Overview in Adairville
| Characteristic | Without Mortgage | With Mortgage |
| Housing Units | 111 | 67 |
| Median Property Value | $94,600 | $109,200 |
| Median Household Income | $50,750 | $7 |
| Monthly Housing Costs | $448 | $0 |
| Real Estate Taxes | $367 | $14 |
Property Value by Mortgage Status in Adairville
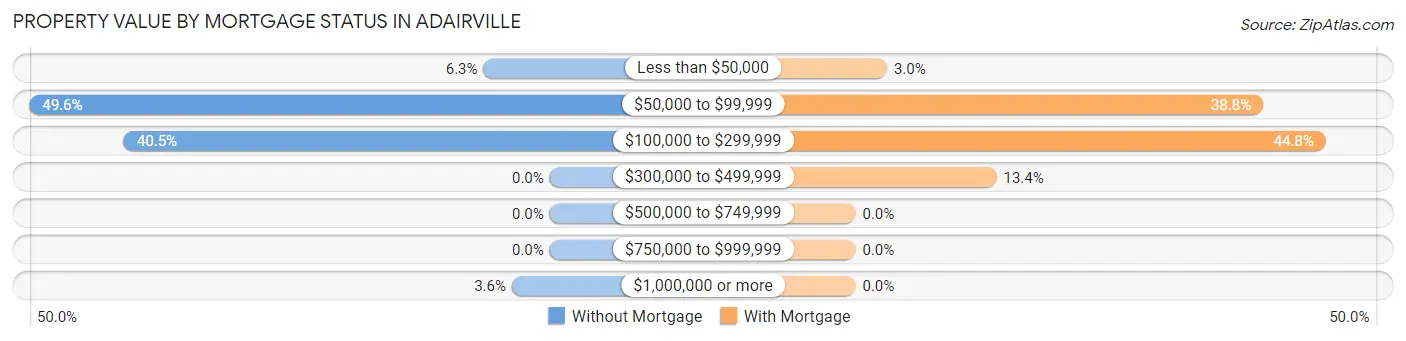
| Property Value | Without Mortgage | With Mortgage |
| Less than $50,000 | 7 (6.3%) | 2 (3.0%) |
| $50,000 to $99,999 | 55 (49.5%) | 26 (38.8%) |
| $100,000 to $299,999 | 45 (40.5%) | 30 (44.8%) |
| $300,000 to $499,999 | 0 (0.0%) | 9 (13.4%) |
| $500,000 to $749,999 | 0 (0.0%) | 0 (0.0%) |
| $750,000 to $999,999 | 0 (0.0%) | 0 (0.0%) |
| $1,000,000 or more | 4 (3.6%) | 0 (0.0%) |
| Total | 111 (100.0%) | 67 (100.0%) |
Household Income by Mortgage Status in Adairville
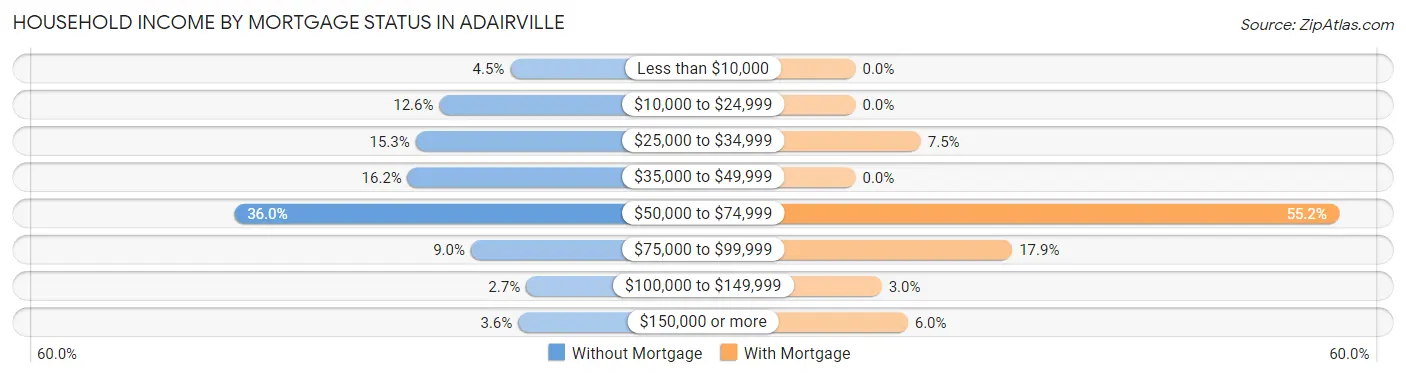
| Household Income | Without Mortgage | With Mortgage |
| Less than $10,000 | 5 (4.5%) | 0 (0.0%) |
| $10,000 to $24,999 | 14 (12.6%) | 0 (0.0%) |
| $25,000 to $34,999 | 17 (15.3%) | 5 (7.5%) |
| $35,000 to $49,999 | 18 (16.2%) | 0 (0.0%) |
| $50,000 to $74,999 | 40 (36.0%) | 37 (55.2%) |
| $75,000 to $99,999 | 10 (9.0%) | 12 (17.9%) |
| $100,000 to $149,999 | 3 (2.7%) | 2 (3.0%) |
| $150,000 or more | 4 (3.6%) | 4 (6.0%) |
| Total | 111 (100.0%) | 67 (100.0%) |
Property Value to Household Income Ratio in Adairville
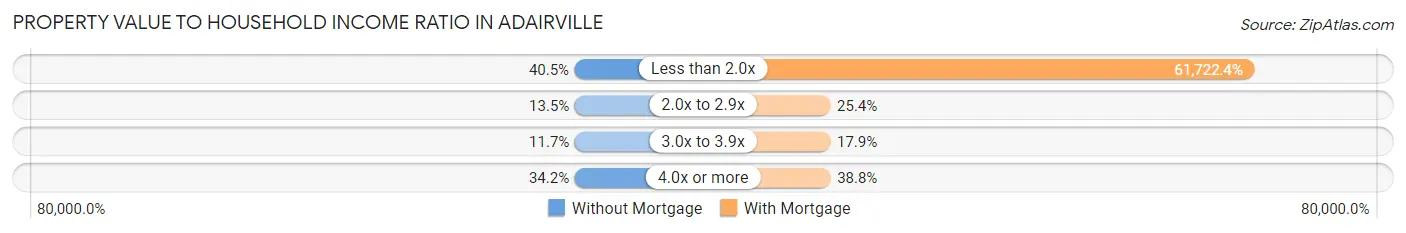
| Value-to-Income Ratio | Without Mortgage | With Mortgage |
| Less than 2.0x | 45 (40.5%) | 41,354 (61,722.4%) |
| 2.0x to 2.9x | 15 (13.5%) | 17 (25.4%) |
| 3.0x to 3.9x | 13 (11.7%) | 12 (17.9%) |
| 4.0x or more | 38 (34.2%) | 26 (38.8%) |
| Total | 111 (100.0%) | 67 (100.0%) |
Real Estate Taxes by Mortgage Status in Adairville
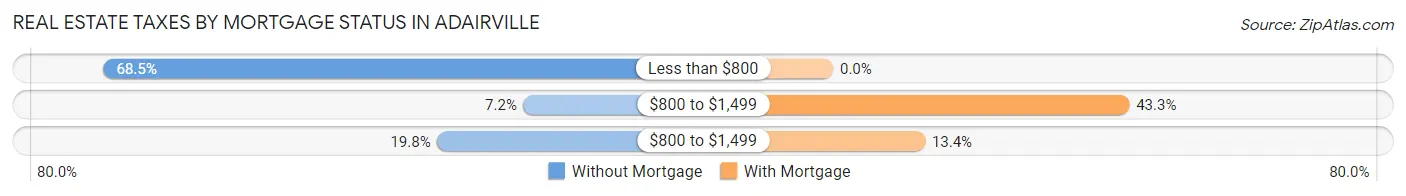
| Property Taxes | Without Mortgage | With Mortgage |
| Less than $800 | 76 (68.5%) | 0 (0.0%) |
| $800 to $1,499 | 8 (7.2%) | 29 (43.3%) |
| $800 to $1,499 | 22 (19.8%) | 9 (13.4%) |
| Total | 111 (100.0%) | 67 (100.0%) |
Health & Disability in Adairville
Health Insurance Coverage by Age in Adairville
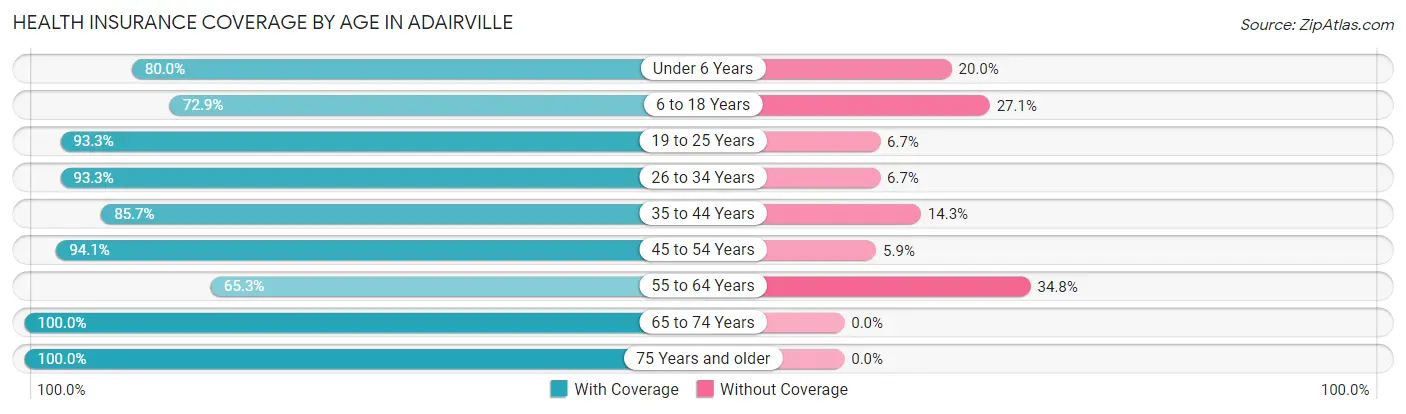
| Age Bracket | With Coverage | Without Coverage |
| Under 6 Years | 20 (80.0%) | 5 (20.0%) |
| 6 to 18 Years | 86 (72.9%) | 32 (27.1%) |
| 19 to 25 Years | 42 (93.3%) | 3 (6.7%) |
| 26 to 34 Years | 42 (93.3%) | 3 (6.7%) |
| 35 to 44 Years | 60 (85.7%) | 10 (14.3%) |
| 45 to 54 Years | 95 (94.1%) | 6 (5.9%) |
| 55 to 64 Years | 92 (65.2%) | 49 (34.7%) |
| 65 to 74 Years | 78 (100.0%) | 0 (0.0%) |
| 75 Years and older | 124 (100.0%) | 0 (0.0%) |
| Total | 639 (85.5%) | 108 (14.5%) |
Health Insurance Coverage by Citizenship Status in Adairville
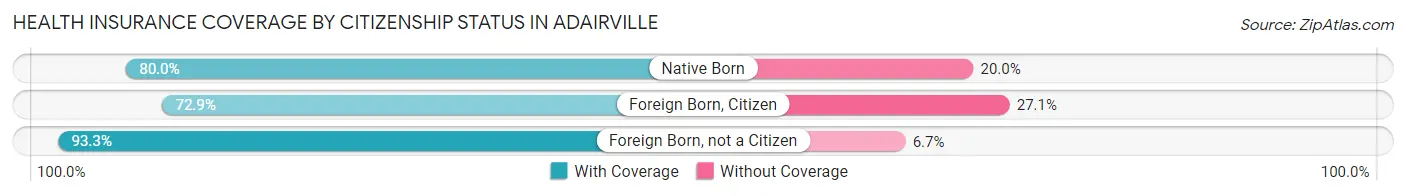
| Citizenship Status | With Coverage | Without Coverage |
| Native Born | 20 (80.0%) | 5 (20.0%) |
| Foreign Born, Citizen | 86 (72.9%) | 32 (27.1%) |
| Foreign Born, not a Citizen | 42 (93.3%) | 3 (6.7%) |
Health Insurance Coverage by Household Income in Adairville
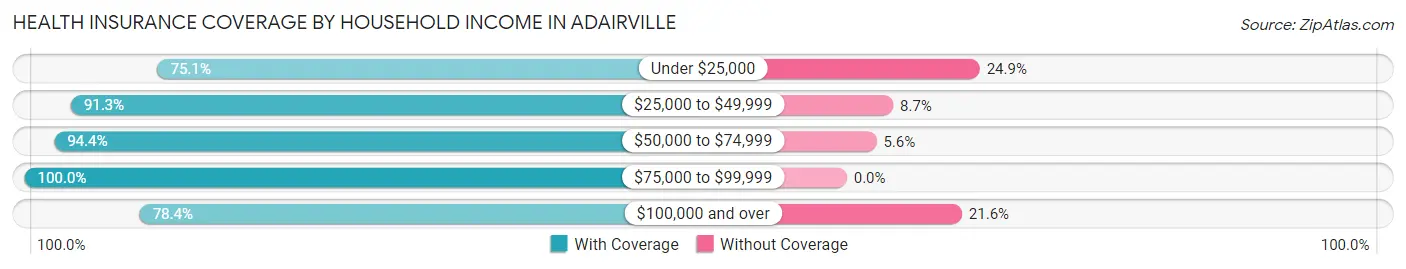
| Household Income | With Coverage | Without Coverage |
| Under $25,000 | 214 (75.1%) | 71 (24.9%) |
| $25,000 to $49,999 | 179 (91.3%) | 17 (8.7%) |
| $50,000 to $74,999 | 153 (94.4%) | 9 (5.6%) |
| $75,000 to $99,999 | 53 (100.0%) | 0 (0.0%) |
| $100,000 and over | 40 (78.4%) | 11 (21.6%) |
Public vs Private Health Insurance Coverage by Age in Adairville
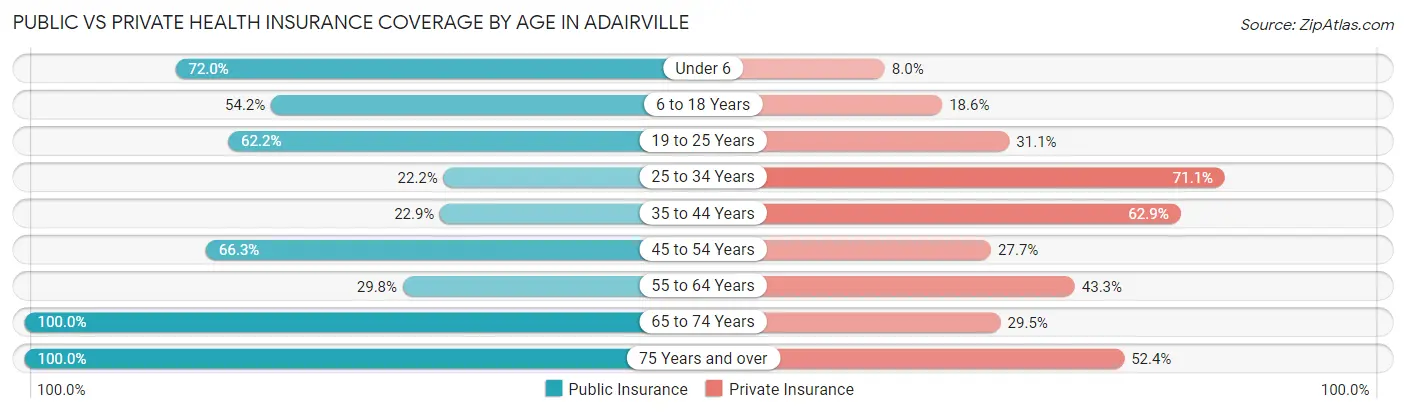
| Age Bracket | Public Insurance | Private Insurance |
| Under 6 | 18 (72.0%) | 2 (8.0%) |
| 6 to 18 Years | 64 (54.2%) | 22 (18.6%) |
| 19 to 25 Years | 28 (62.2%) | 14 (31.1%) |
| 25 to 34 Years | 10 (22.2%) | 32 (71.1%) |
| 35 to 44 Years | 16 (22.9%) | 44 (62.9%) |
| 45 to 54 Years | 67 (66.3%) | 28 (27.7%) |
| 55 to 64 Years | 42 (29.8%) | 61 (43.3%) |
| 65 to 74 Years | 78 (100.0%) | 23 (29.5%) |
| 75 Years and over | 124 (100.0%) | 65 (52.4%) |
| Total | 447 (59.8%) | 291 (39.0%) |
Disability Status by Sex by Age in Adairville
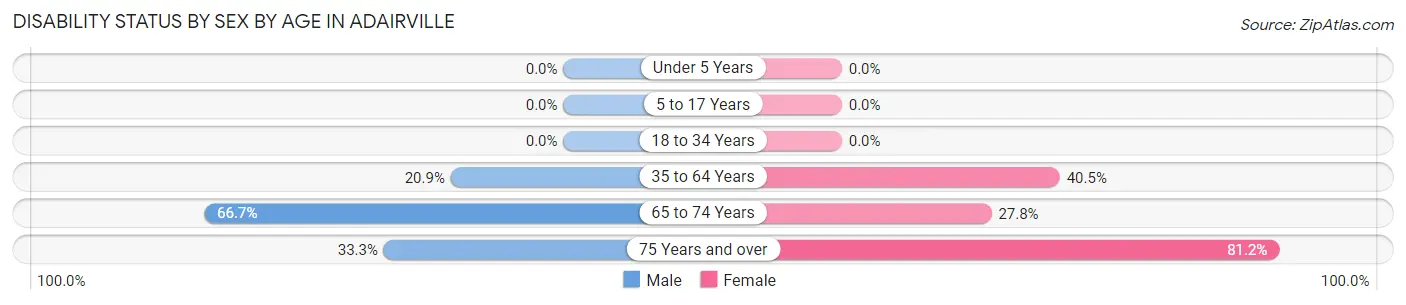
| Age Bracket | Male | Female |
| Under 5 Years | 0 (0.0%) | 0 (0.0%) |
| 5 to 17 Years | 0 (0.0%) | 0 (0.0%) |
| 18 to 34 Years | 0 (0.0%) | 0 (0.0%) |
| 35 to 64 Years | 28 (20.9%) | 72 (40.5%) |
| 65 to 74 Years | 16 (66.7%) | 15 (27.8%) |
| 75 Years and over | 13 (33.3%) | 69 (81.2%) |
Disability Class by Sex by Age in Adairville
Disability Class: Hearing Difficulty
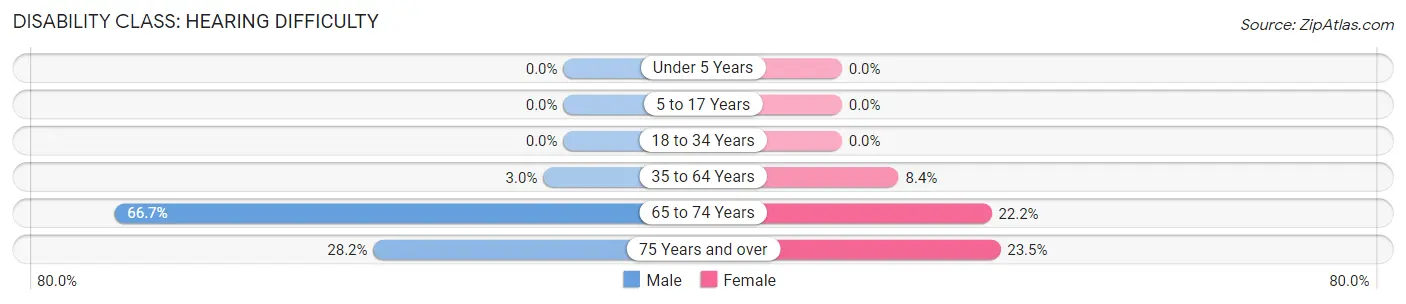
| Age Bracket | Male | Female |
| Under 5 Years | 0 (0.0%) | 0 (0.0%) |
| 5 to 17 Years | 0 (0.0%) | 0 (0.0%) |
| 18 to 34 Years | 0 (0.0%) | 0 (0.0%) |
| 35 to 64 Years | 4 (3.0%) | 15 (8.4%) |
| 65 to 74 Years | 16 (66.7%) | 12 (22.2%) |
| 75 Years and over | 11 (28.2%) | 20 (23.5%) |
Disability Class: Vision Difficulty
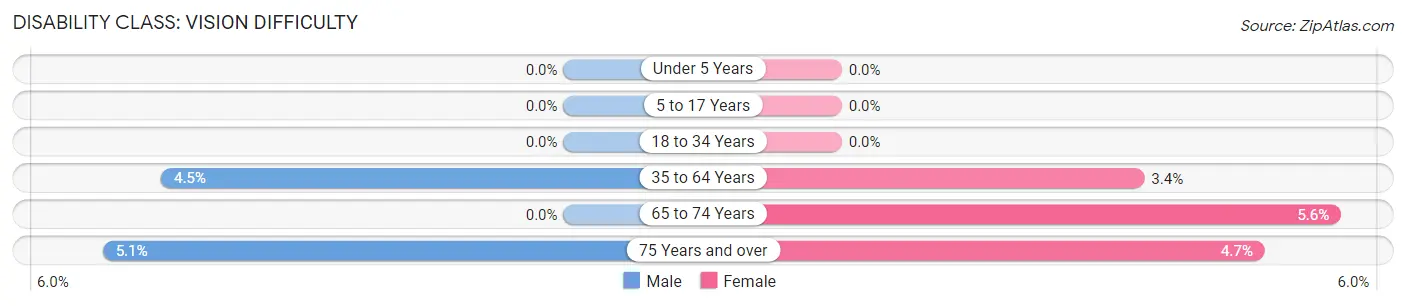
| Age Bracket | Male | Female |
| Under 5 Years | 0 (0.0%) | 0 (0.0%) |
| 5 to 17 Years | 0 (0.0%) | 0 (0.0%) |
| 18 to 34 Years | 0 (0.0%) | 0 (0.0%) |
| 35 to 64 Years | 6 (4.5%) | 6 (3.4%) |
| 65 to 74 Years | 0 (0.0%) | 3 (5.6%) |
| 75 Years and over | 2 (5.1%) | 4 (4.7%) |
Disability Class: Cognitive Difficulty
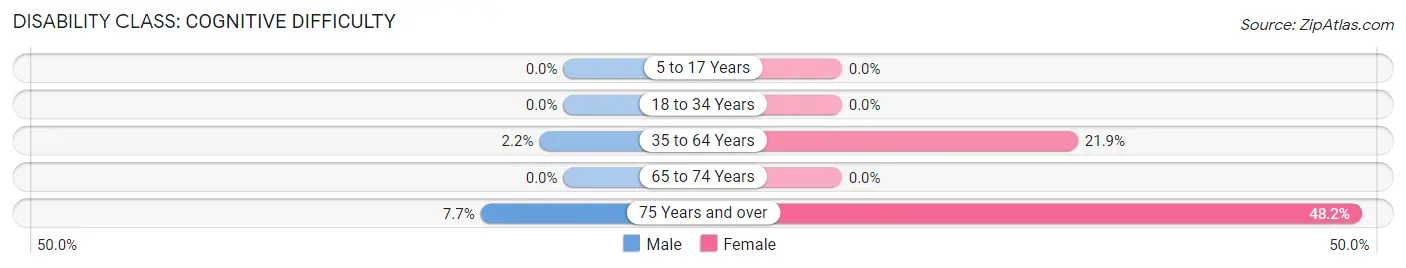
| Age Bracket | Male | Female |
| 5 to 17 Years | 0 (0.0%) | 0 (0.0%) |
| 18 to 34 Years | 0 (0.0%) | 0 (0.0%) |
| 35 to 64 Years | 3 (2.2%) | 39 (21.9%) |
| 65 to 74 Years | 0 (0.0%) | 0 (0.0%) |
| 75 Years and over | 3 (7.7%) | 41 (48.2%) |
Disability Class: Ambulatory Difficulty
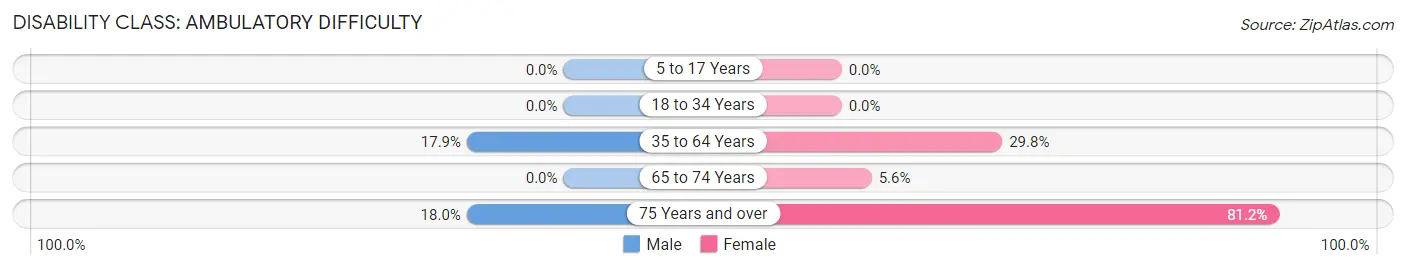
| Age Bracket | Male | Female |
| 5 to 17 Years | 0 (0.0%) | 0 (0.0%) |
| 18 to 34 Years | 0 (0.0%) | 0 (0.0%) |
| 35 to 64 Years | 24 (17.9%) | 53 (29.8%) |
| 65 to 74 Years | 0 (0.0%) | 3 (5.6%) |
| 75 Years and over | 7 (17.9%) | 69 (81.2%) |
Disability Class: Self-Care Difficulty
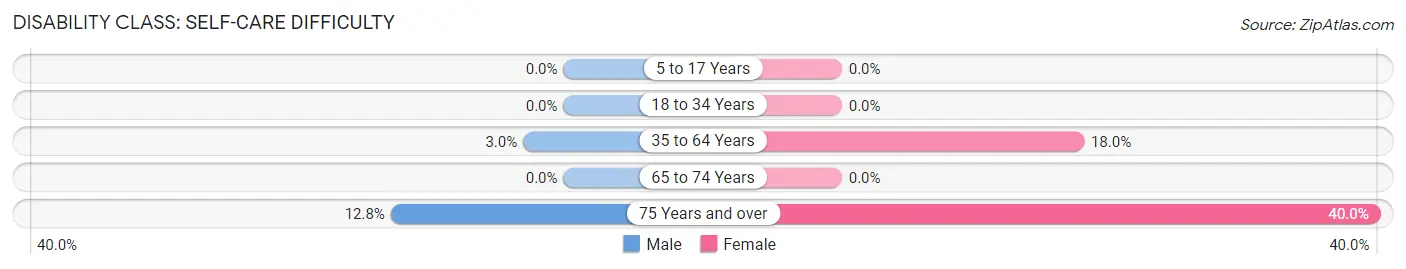
| Age Bracket | Male | Female |
| 5 to 17 Years | 0 (0.0%) | 0 (0.0%) |
| 18 to 34 Years | 0 (0.0%) | 0 (0.0%) |
| 35 to 64 Years | 4 (3.0%) | 32 (18.0%) |
| 65 to 74 Years | 0 (0.0%) | 0 (0.0%) |
| 75 Years and over | 5 (12.8%) | 34 (40.0%) |
Technology Access in Adairville
Computing Device Access in Adairville
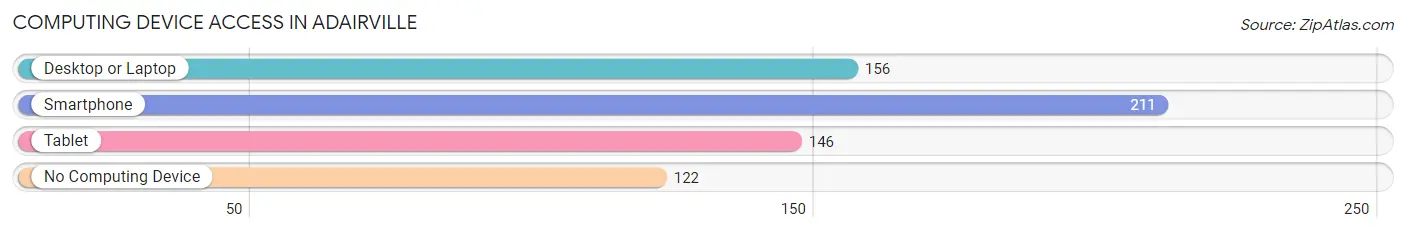
| Device Type | # Households | % Households |
| Desktop or Laptop | 156 | 43.3% |
| Smartphone | 211 | 58.6% |
| Tablet | 146 | 40.6% |
| No Computing Device | 122 | 33.9% |
| Total | 360 | 100.0% |
Internet Access in Adairville
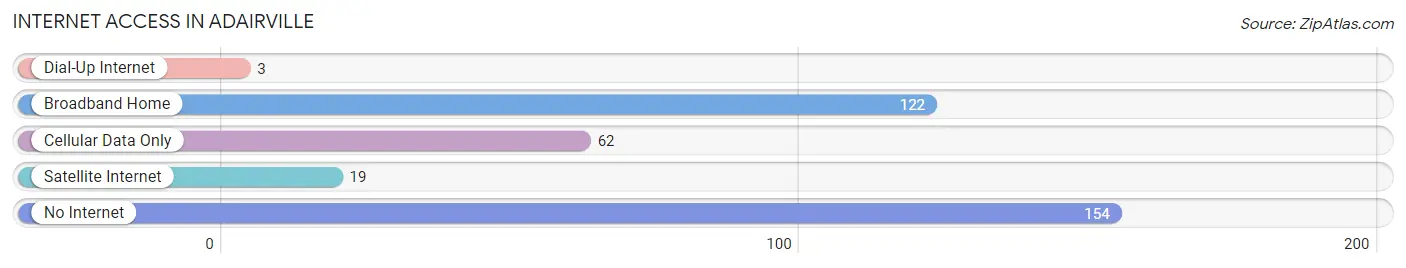
| Internet Type | # Households | % Households |
| Dial-Up Internet | 3 | 0.8% |
| Broadband Home | 122 | 33.9% |
| Cellular Data Only | 62 | 17.2% |
| Satellite Internet | 19 | 5.3% |
| No Internet | 154 | 42.8% |
| Total | 360 | 100.0% |
Adairville Summary
Adairville is a small town located in Logan County, Kentucky, United States. It is situated along the banks of the Green River, approximately 20 miles north of the state capital of Frankfort. The population of Adairville was 1,092 at the 2010 census.
History
Adairville was founded in 1817 by William Adair, a Revolutionary War veteran. Adair had served in the Virginia militia and was granted a land grant in Kentucky for his service. He named the town after himself and it quickly became a thriving community. Adairville was incorporated in 1837 and was the first town in Logan County to be incorporated.
The town was a major stop on the Louisville and Nashville Railroad, which ran through the town from 1859 to 1971. The railroad brought many new businesses to the area, including a cotton mill, a flour mill, and a sawmill. The town also had a number of stores, hotels, and other businesses.
Adairville was the site of a major Civil War battle in 1862. Confederate forces under General Braxton Bragg attacked the town, but were eventually driven back by Union forces. The town was also the site of a major tornado in 1875, which destroyed much of the town.
Geography
Adairville is located at 36°51'45" North, 86°45'45" West (36.8624, -86.7625). The town is situated along the banks of the Green River, approximately 20 miles north of the state capital of Frankfort. The town has a total area of 1.2 square miles, all of which is land.
Economy
Adairville's economy is largely based on agriculture. The town is home to several farms, which produce a variety of crops, including corn, soybeans, wheat, and hay. The town also has a number of small businesses, including a grocery store, a hardware store, and a few restaurants.
Demographics
As of the 2010 census, Adairville had a population of 1,092. The racial makeup of the town was 97.2% White, 0.9% African American, 0.2% Native American, 0.2% Asian, 0.2% from other races, and 1.3% from two or more races. Hispanic or Latino of any race were 0.7% of the population.
The median income for a household in Adairville was $37,500, and the median income for a family was $45,000. The per capita income for the town was $17,845. About 11.2% of families and 14.2% of the population were below the poverty line, including 18.2% of those under age 18 and 8.3% of those age 65 or over.
Adairville is served by the Logan County School District, which includes Adairville Elementary School, Adairville Middle School, and Adairville High School. The town also has a public library, the Adairville Public Library.
Common Questions
What is Per Capita Income in Adairville?
Per Capita income in Adairville is $22,840.
What is the Median Family Income in Adairville?
Median Family Income in Adairville is $41,450.
What is the Median Household income in Adairville?
Median Household Income in Adairville is $36,176.
What is Family Income Deficit in Adairville?
Family Income Deficit in Adairville is $12,119.
Families that are below poverty line in Adairville earn $12,119 less on average than the poverty threshold level.
What is Inequality or Gini Index in Adairville?
Inequality or Gini Index in Adairville is 0.46.
What is the Total Population of Adairville?
Total Population of Adairville is 747.
What is the Total Male Population of Adairville?
Total Male Population of Adairville is 315.
What is the Total Female Population of Adairville?
Total Female Population of Adairville is 432.
What is the Ratio of Males per 100 Females in Adairville?
There are 72.92 Males per 100 Females in Adairville.
What is the Ratio of Females per 100 Males in Adairville?
There are 137.14 Females per 100 Males in Adairville.
What is the Median Population Age in Adairville?
Median Population Age in Adairville is 52.6 Years.
What is the Average Family Size in Adairville
Average Family Size in Adairville is 2.6 People.
What is the Average Household Size in Adairville
Average Household Size in Adairville is 2.1 People.
How Large is the Labor Force in Adairville?
There are 297 People in the Labor Forcein in Adairville.
What is the Percentage of People in the Labor Force in Adairville?
45.9% of People are in the Labor Force in Adairville.
What is the Unemployment Rate in Adairville?
Unemployment Rate in Adairville is 4.0%.